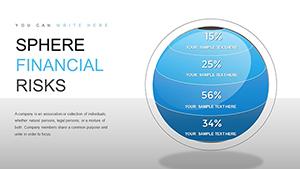
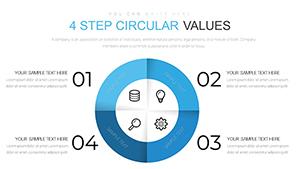
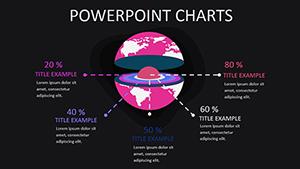
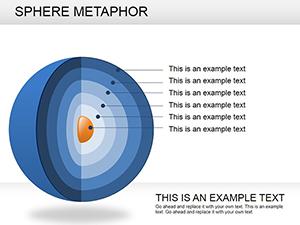
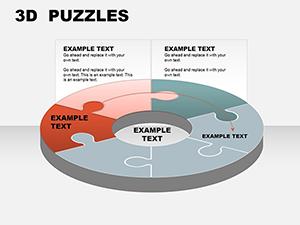
Revolutionize how you present figures with our 3D sphere PowerPoint chart templates, where data orbits in captivating spheres. Geared toward analysts, educators, and innovators, these charts layer information radially - core metrics at the center, expanding outward to details. Perfect for illustrating ecosystems, budgets, or growth models.
Rotation animations bring spheres to life, rotating to unveil segments. Vector precision keeps edges sharp on any resolution. Export frames for reports or animations for videos.
Sphere your way to standout slides - select and spin up engaging content now.

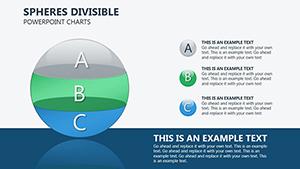
Launch concepts that revolve around impact - our 3D sphere PowerPoint chart templates orbit success. Sustainability experts model carbon footprints, with rings denoting emission sources. Tech startups chart user engagement layers, from acquisition to retention.
HR pros visualize team dynamics in concentric circles of skills and roles. Biologists diagram cellular structures, animating molecular bonds. Depth adds narrative layers, making complex data accessible.
2D bars lie flat; our spheres add dimension, enabling 360-degree views that reveal hidden correlations. Built-in shading simulates light for realism, outshining uniform fills in basic templates.
Interactive spins engage viewers 45% more, per surveys, with less cognitive load than parsing planes. Scalable without distortion, they adapt to any deck size effortlessly.
Center your thesis in the core, layering supports outward. Calibrate rotations to 90 degrees for key reveals, using easing for smoothness. Widescreen maximizes immersion, with metallic textures for polish.
Pair with voiceovers for guided tours. This crafts charts that mesmerize and inform.
Download a template and rotate realities - sync with Keynote for Apple ecosystems.
Essentials on 3D sphere PowerPoint chart templates.
With 1,000 words of spherical strategy, elevate data to dimensions anew.
Copyright © 2009-2026 ImagineLayout All rights reserved.