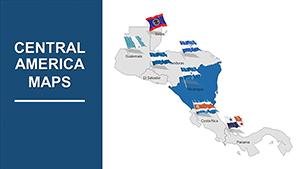
North America Editable Maps: PowerPoint Template


Type: PowerPoint Maps template
Category: North America
Sources Available: .pptx
Product ID: PM00012
Template incl.: 36 editable slides
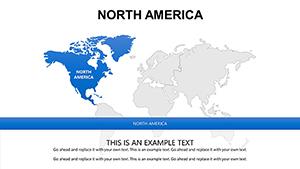
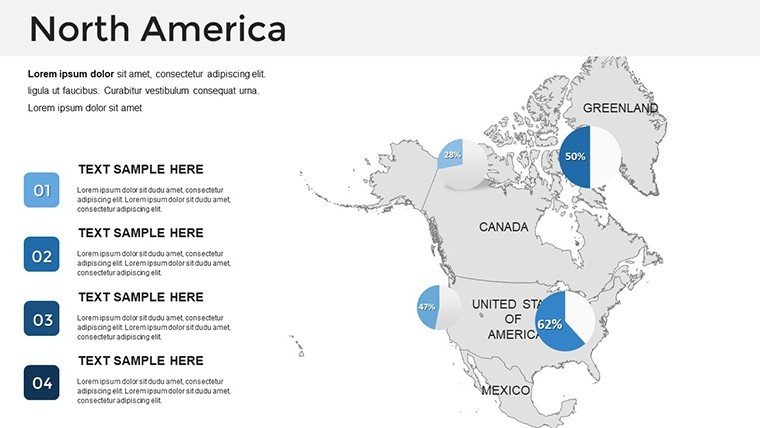
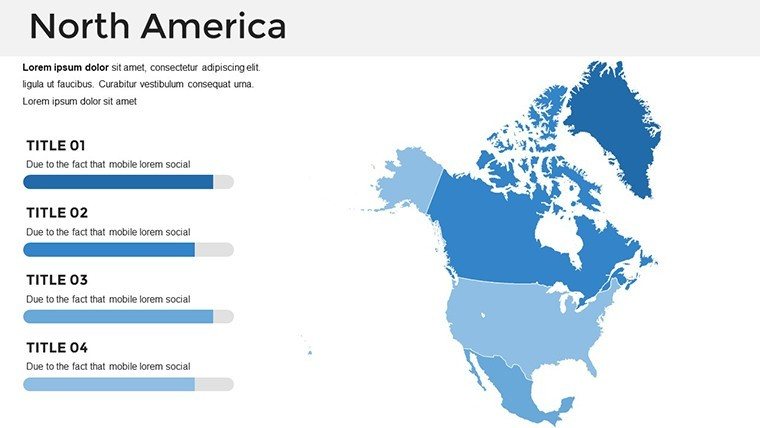
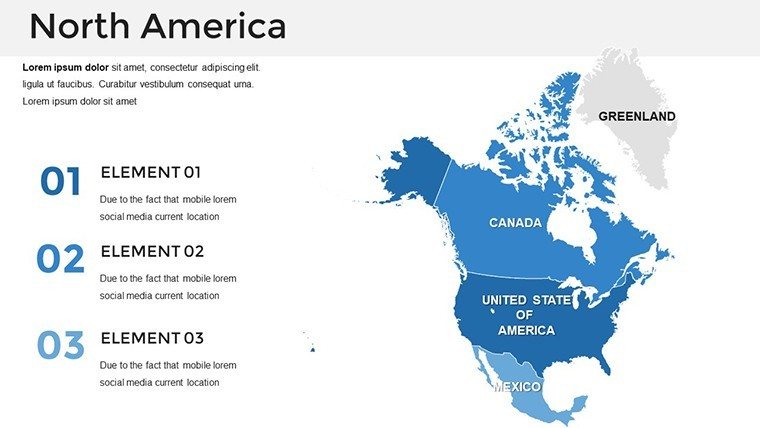
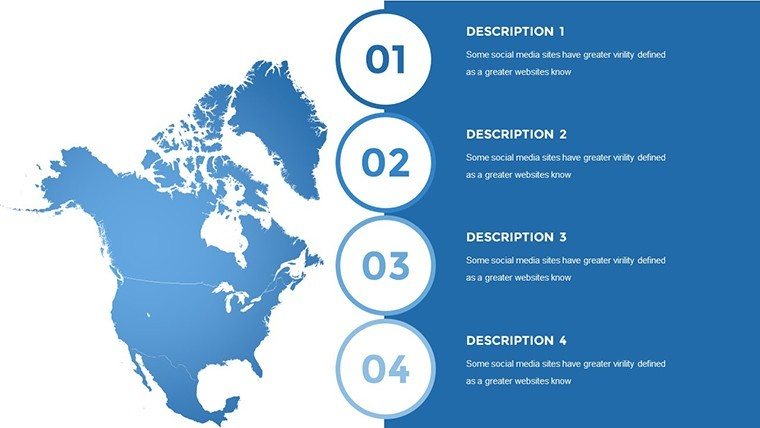
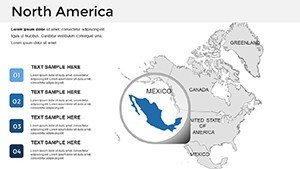
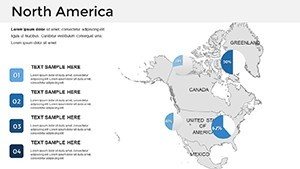
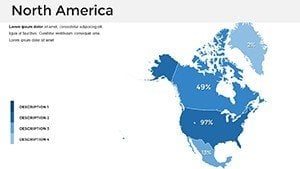
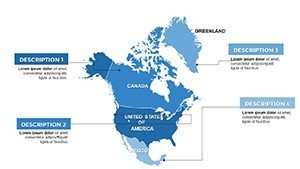
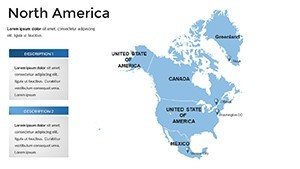
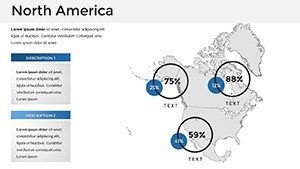
Embark on a continental odyssey with our Editable North America PowerPoint Maps template, encompassing 36 versatile slides that map out the diverse tapestry from Alaska's fjords to Mexico City's vibrancy. Aimed at global business executives, educators, market researchers, and policymakers, this comprehensive .pptx resource works flawlessly in PowerPoint, Google Slides, and Keynote, empowering you to weave intricate stories across borders.
Whether delineating trade routes through the Panama Canal or charting urban sprawl in the Great Lakes region, these maps offer detailed insights with effortless customization. High-quality vectors and interactive features elevate your presentations, replacing outdated clipart with professional-grade visuals that captivate and convince, all while streamlining your workflow.
Envision a multinational firm overlaying supply chains from Toronto to Tijuana, or a professor illustrating NAFTA's evolution - the template's multipurpose utility turns complex geopolitics into accessible narratives, far surpassing basic diagramming tools with its integrated interactivity.
Standout Features for Continental Coverage
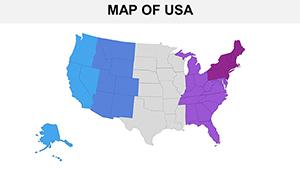
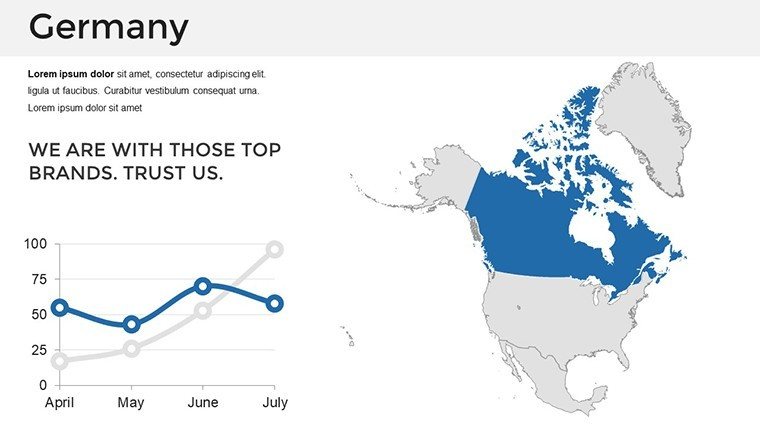
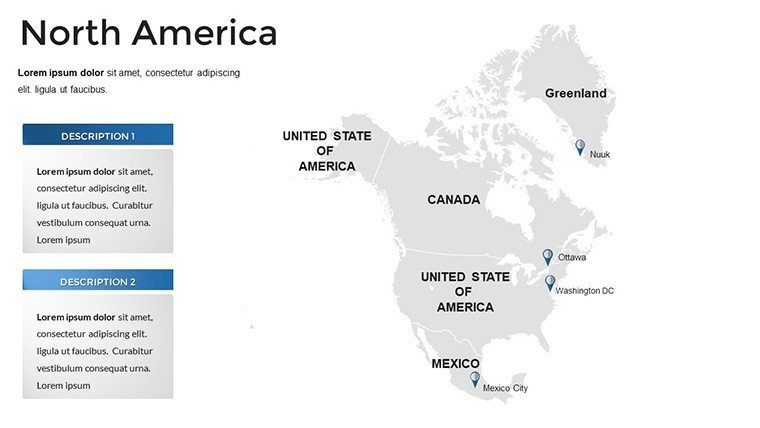
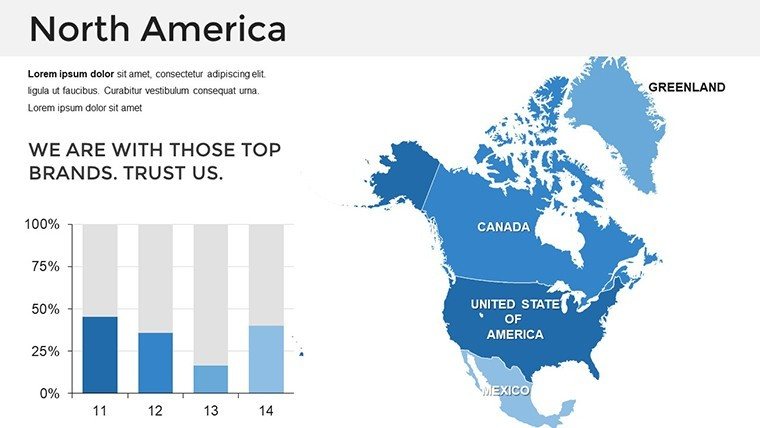
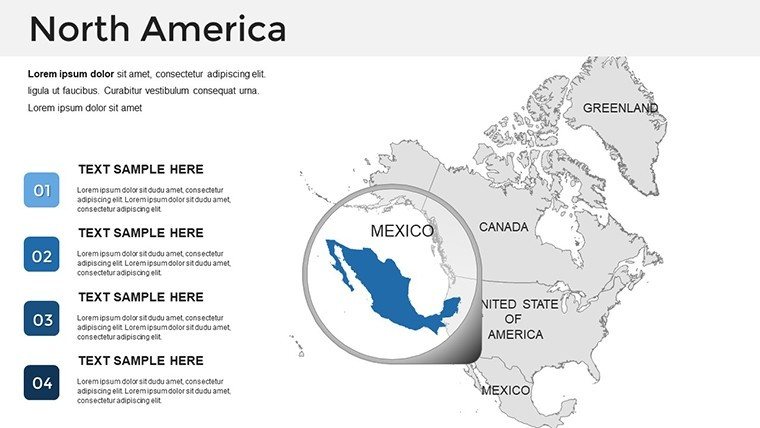
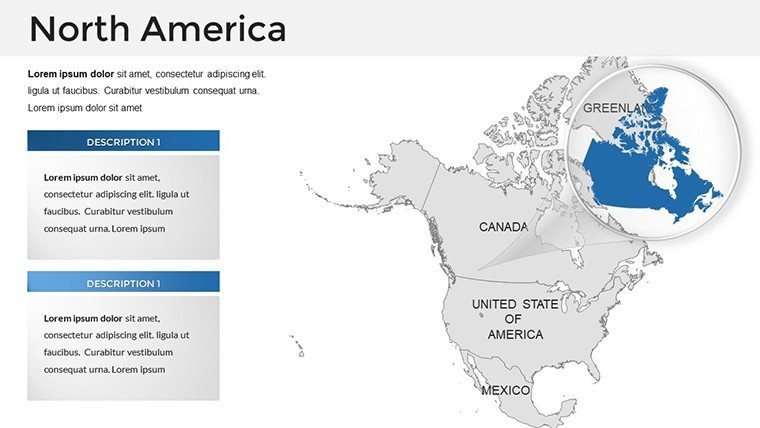
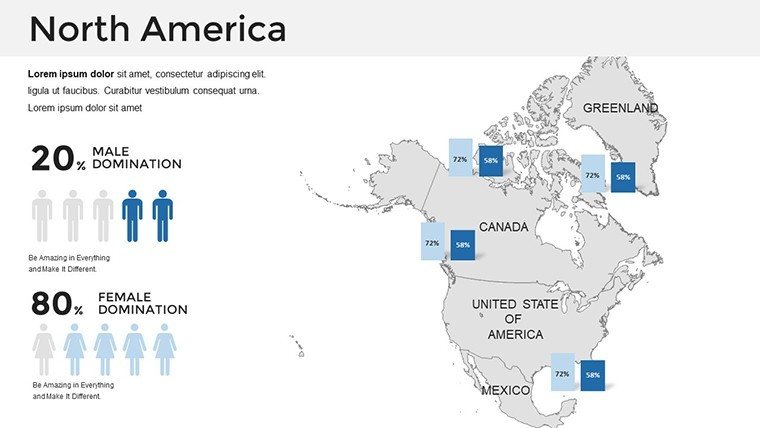
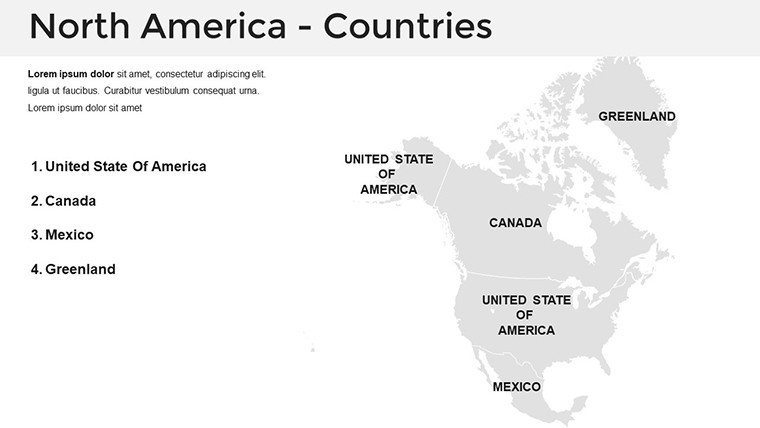
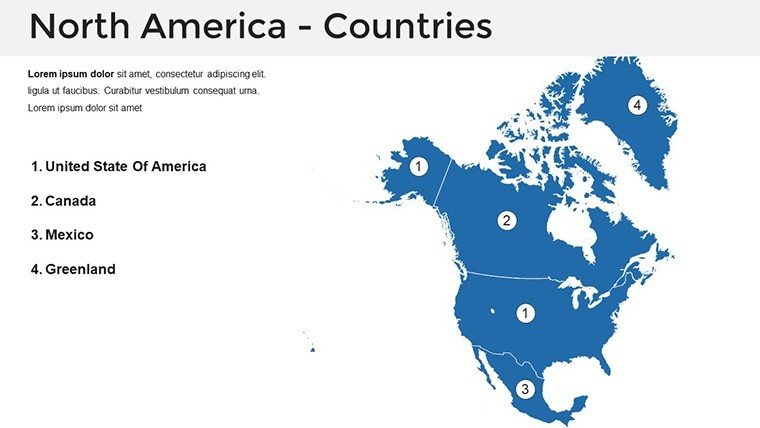
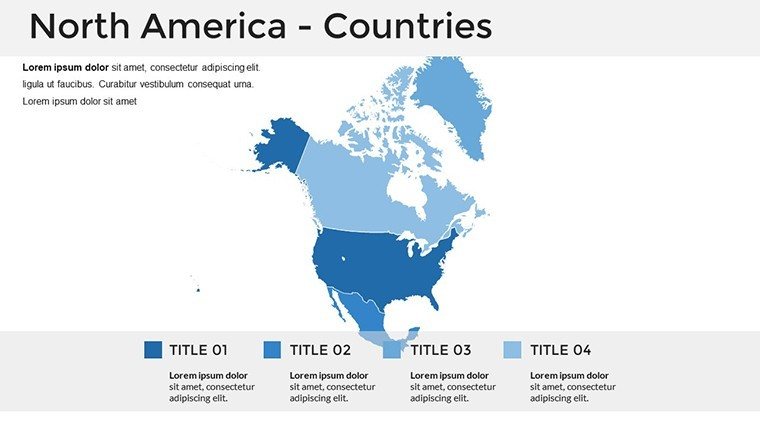
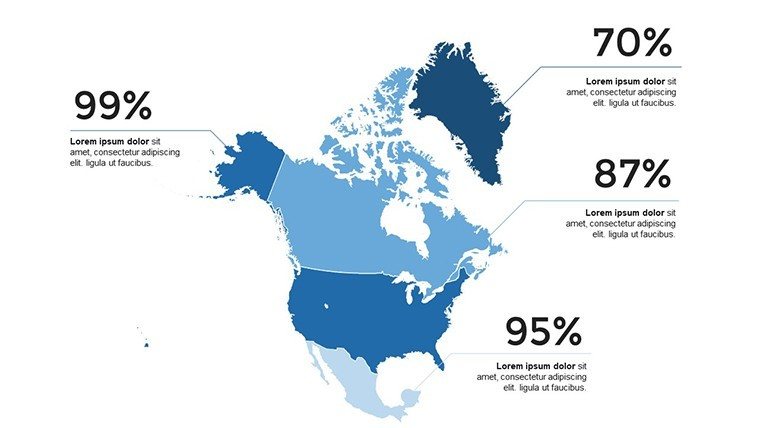
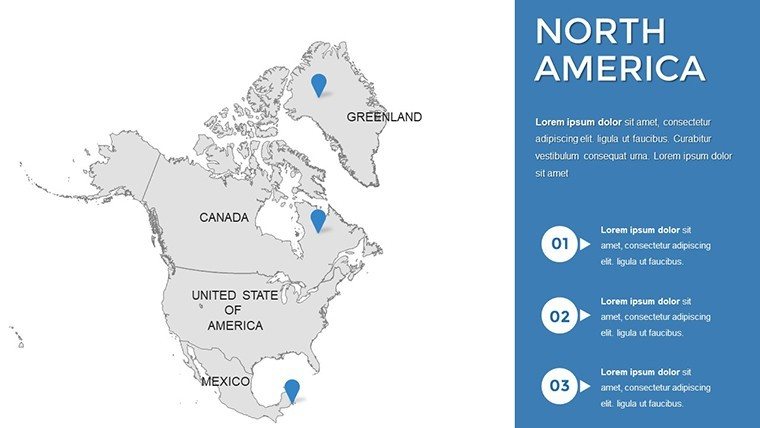
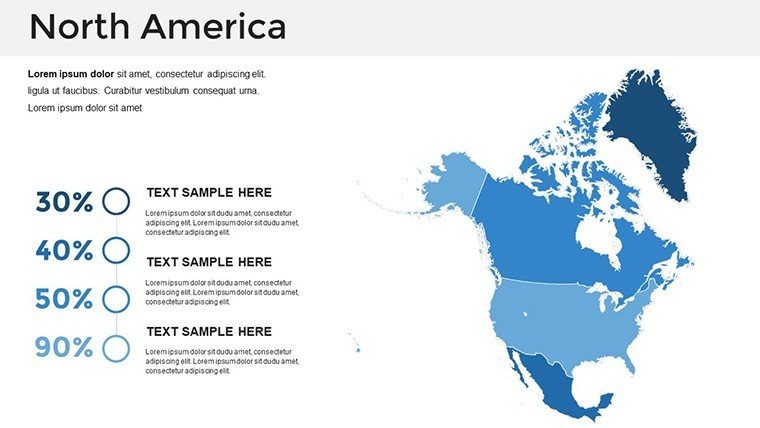
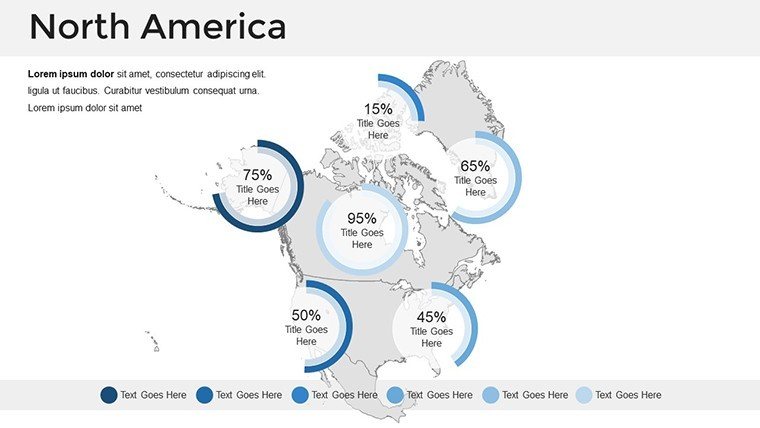
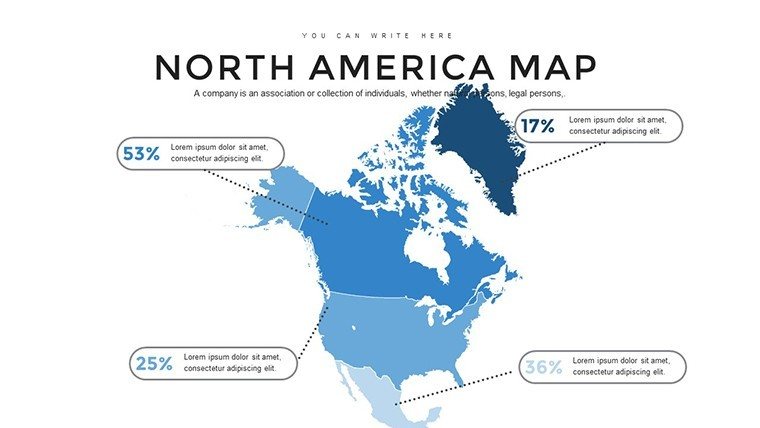
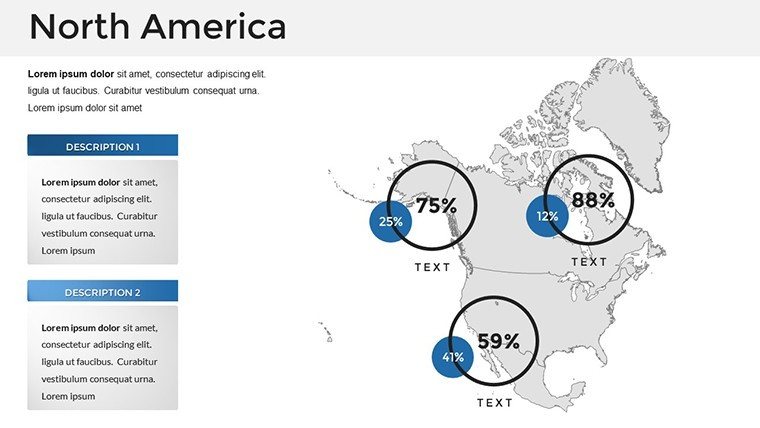
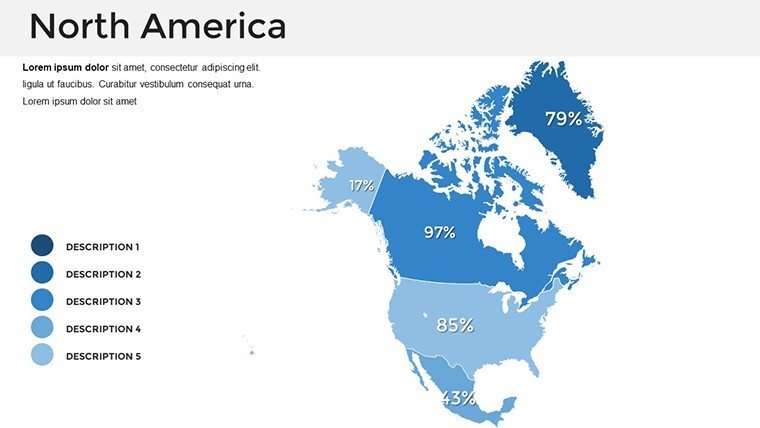
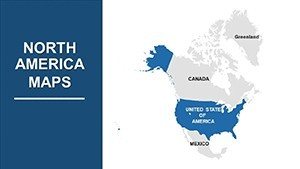
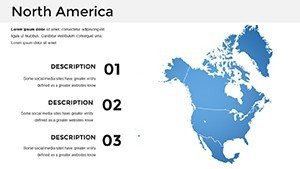
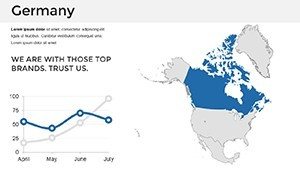
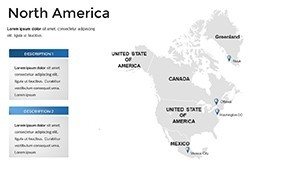
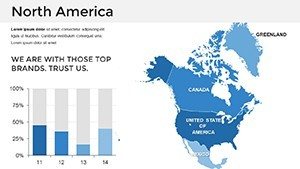
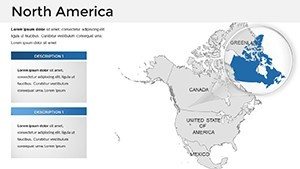
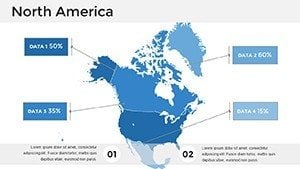
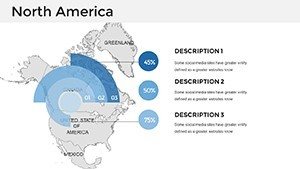
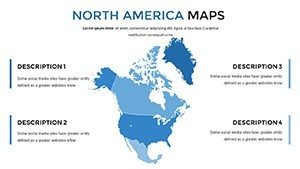
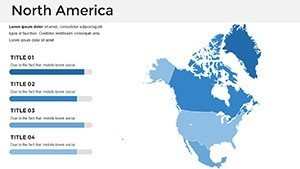
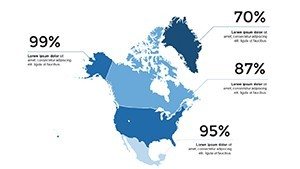
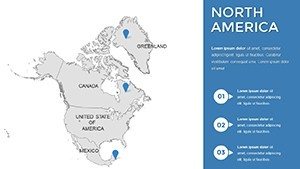
Spanning 36 slides, the template opens with a full North American overview, then zooms into subregions like the Rocky Mountains or the Caribbean coast. Later slides include thematic layers for economics, such as GDP heatmaps across the U.S.-Canada border.
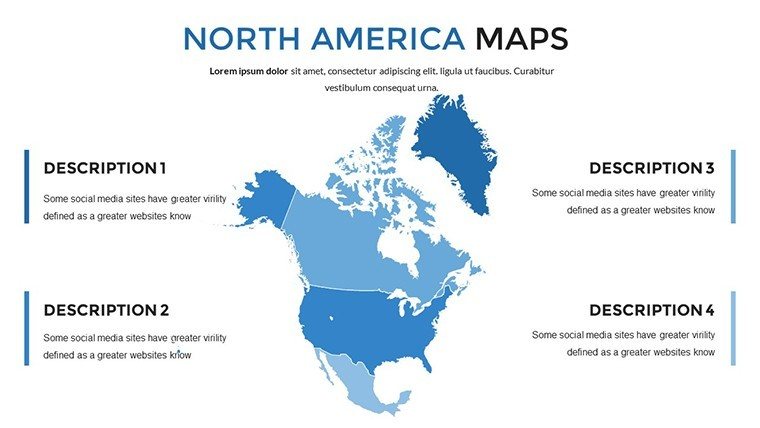
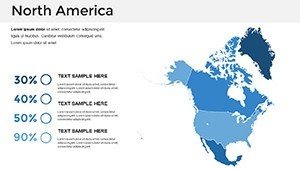
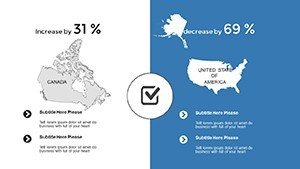
- Easy Customization: Alter colors, labels, and boundaries to fit themes, like branding for a Silicon Valley pitch.
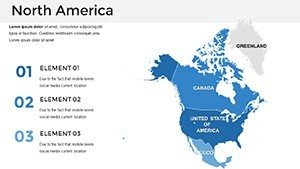
- Geographical Depth: Precise details on climates, from Arctic tundra to Mesoamerican rainforests.
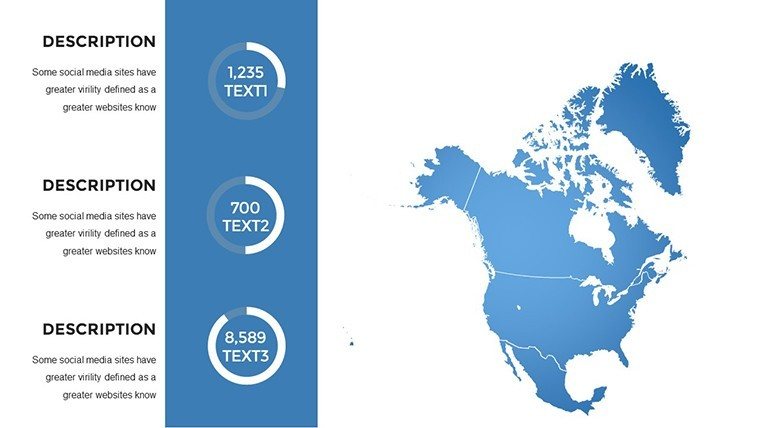
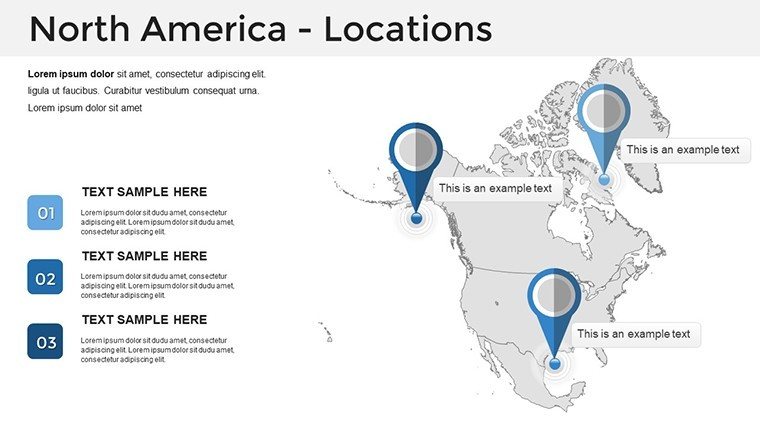
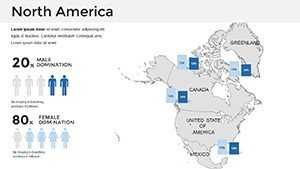
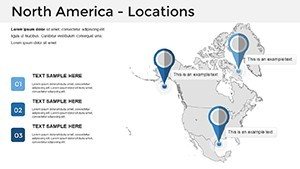
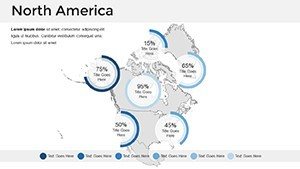
- Interactive Engagement: Clickable hotspots and overlays for exploring migration patterns in the Southwest.
- Versatile Applications: From market research in Montreal to tourism planning in the Yucatan.
- Seamless Compatibility: Integrates across platforms for hybrid team collaborations.
Compared to free web maps, our template's offline-ready design and editable paths ensure privacy and precision, ideal for sensitive corporate data.
Streamlined Customization Process
- Download Access: Obtain the file and load into your software of choice.
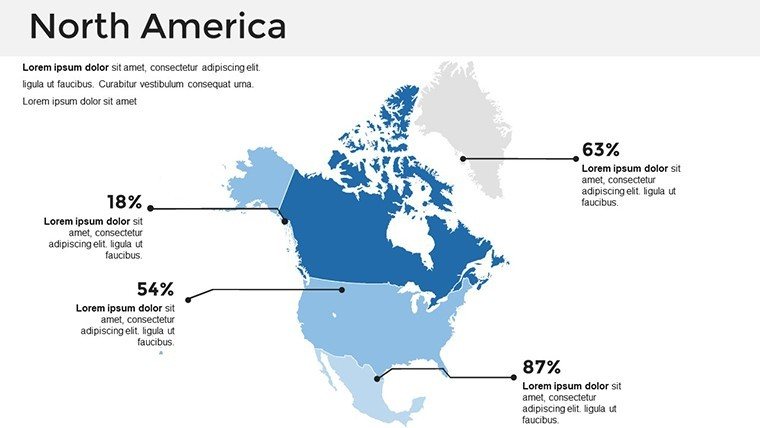
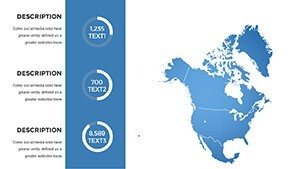
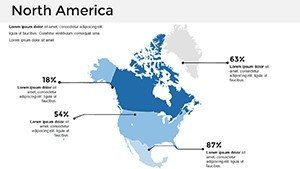
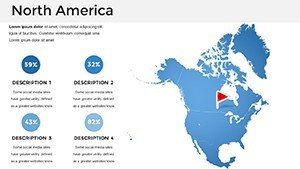
- Personalize Visuals: Recolor for continental themes, adding text for key stats like 579 million inhabitants.
- Data Integration: Embed CSV imports for trade volume graphs spanning the Mississippi to the Rio Grande.
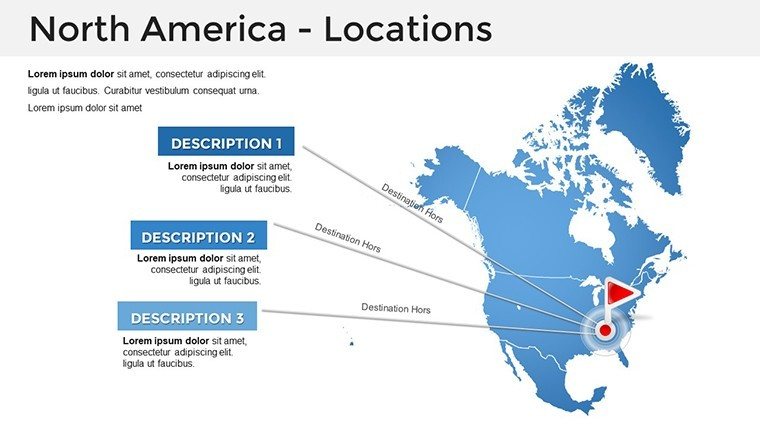
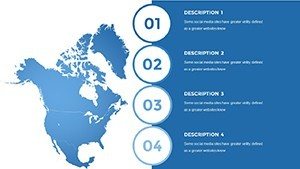
- Boost Interactivity: Add hyperlinks to drill down from overview to state-level views.
- Output Options: Render as interactive PDFs or animated exports for conferences.
Insightful hack: For international relations talks, incorporate Mercator projections adjusted for polar routes, referencing UN cartographic guidelines for accuracy.
Diverse Use Cases: Global to Local
Educators map colonial histories from Quebec to the Alamo, engaging students with animated expansions. Business analysts visualize e-commerce growth in the Amazon basin, drawing from World Bank reports for a 40% presentation speedup. Tourism operators design multi-country itineraries, highlighting Route 66 extensions into Baja California.
Researchers tackle climate models, overlaying sea-level rise on coastal cities like Miami and Vancouver, informed by IPCC data. Governments strategize alliances, using the template for border security visuals that aided diplomatic briefs. Its broad scope - encompassing nuances like the Great Plains' agriculture - distinguishes it from region-specific tools, enabling holistic analyses.
Combine with Tableau for dynamic data or Figma for prototype testing. Ultimately, it empowers decisions that span the continent, fostering innovation from Detroit's auto hubs to Bogotá's tech scenes.
The Professional Advantage of North America Maps
With clean, modern layouts, this template exudes authority, and its 36-slide depth provides exhaustive options without overwhelm. A Mexico City marketing firm credited it with winning a cross-border campaign, thanks to rapid adaptations. Enhance trustworthiness by citing sources like the CIA World Factbook in notes.
Conquer the continent visually - grab the North America Editable Maps template now and redefine your presentations.
Connect dots across borders - edit, visualize, and lead today.
Frequently Asked Questions
How detailed are the North America maps?
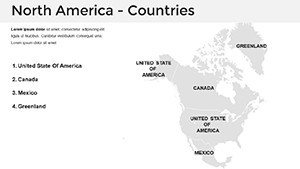
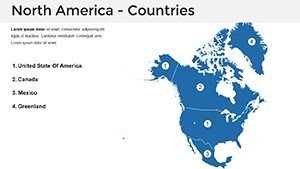
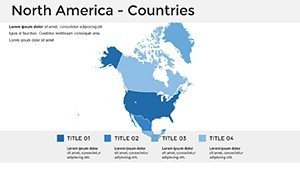
They cover countries, states/provinces, major cities, and natural features with high precision.
Is Keynote compatibility reliable?
Yes, the design translates smoothly, preserving edits and animations.
Can I add my own data overlays?
Definitely, with support for charts and annotations tailored to economic or demographic info.
What makes it interactive?
Features like hyperlinks and layered elements allow for exploratory presentations.
Suitable for educational use?
Perfectly, with tools for teaching geography, history, and current events across the continent.
Any limitations on file size?
No, optimized for performance even with all 36 slides loaded.