Collection of Canada PowerPoint Maps: Chart Your Northern Adventures


Type: PowerPoint Maps template
Category: North America
Sources Available: .pptx
Product ID: PM00079
Template incl.: 22 editable slides
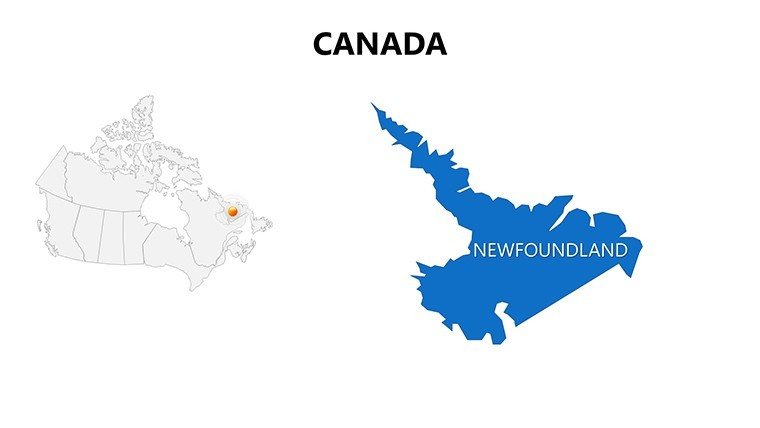
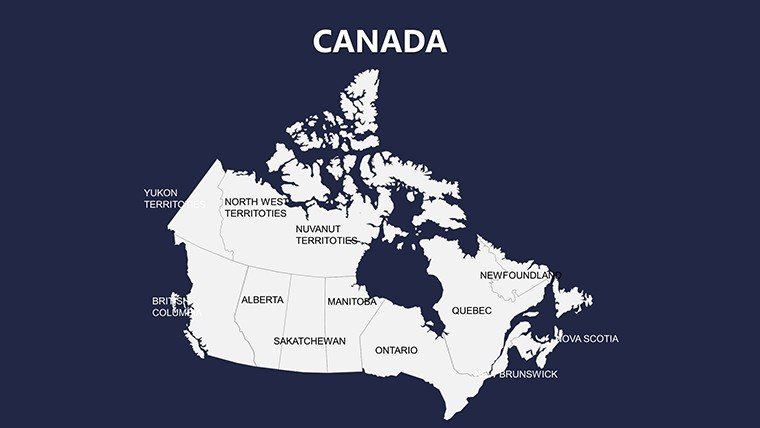
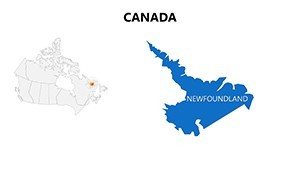
From the towering peaks of the Rocky Mountains to the serene coastlines of Newfoundland, Canada's vast landscapes offer endless opportunities for storytelling in your presentations. Our Collection of Canada PowerPoint Maps template, with its 22 editable slides, empowers architects, environmental consultants, business strategists, and teachers to bring these regions to life. Tailored for those navigating complex regional data, this template turns abstract concepts - like resource distribution or urban growth - into vivid, interactive maps that engage and inform.
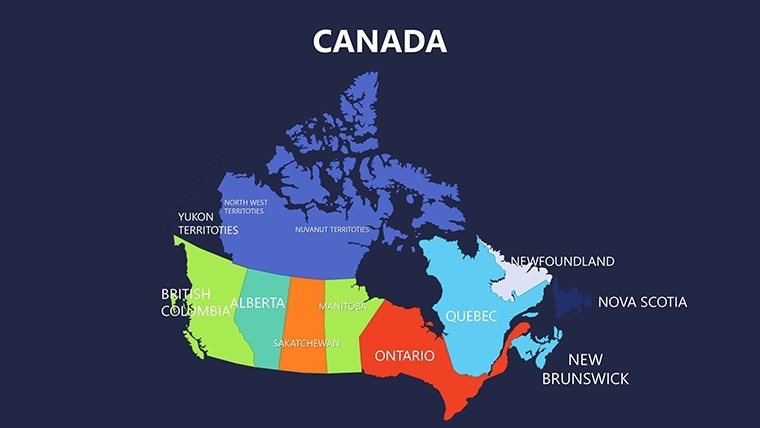
This comprehensive set zooms in on Canada's provinces and territories, major cities, and iconic physical features, providing a foundation for everything from sustainable development proposals to cultural heritage lectures. Each slide is built for ease, with high-resolution graphics that maintain crispness at any zoom level. Customize by adjusting hues to evoke the Arctic's cool blues or the Prairies' warm golds, and layer in your data for personalized insights. It's not just a tool; it's a gateway to showcasing Canada's dynamic geography with professional finesse.
Mastering Canadian Geography Through Editable Designs
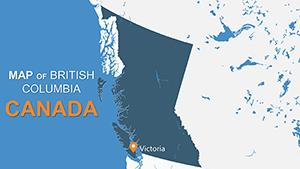
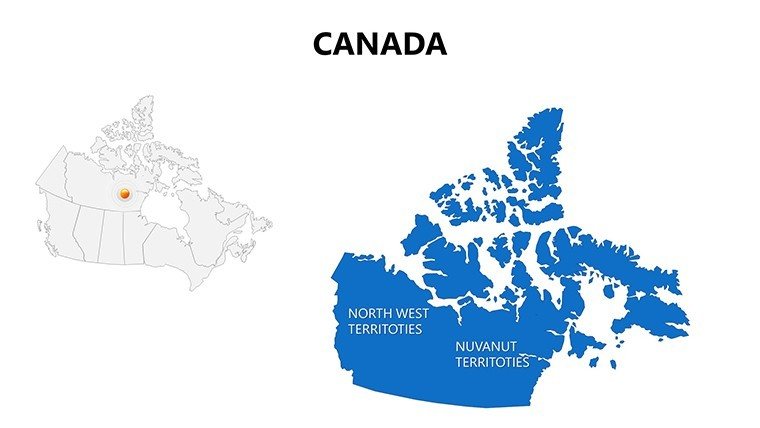
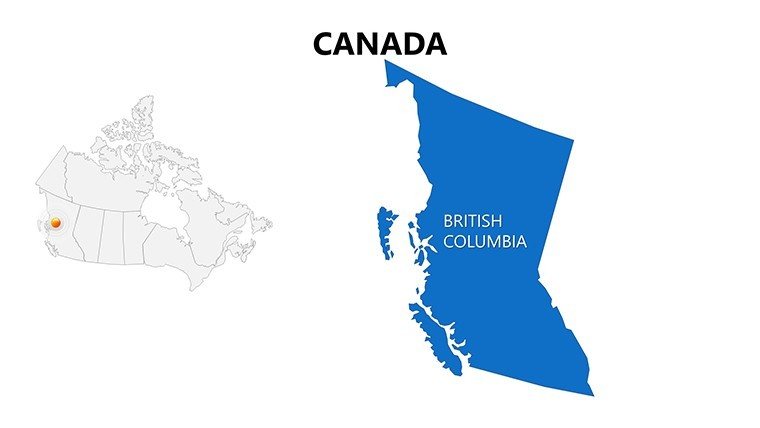
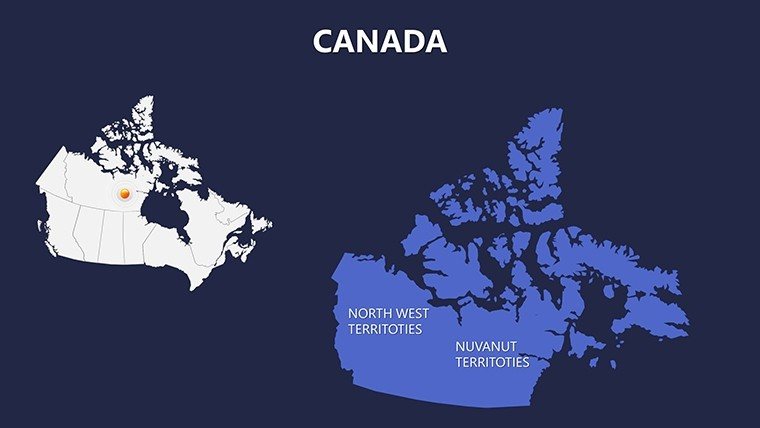
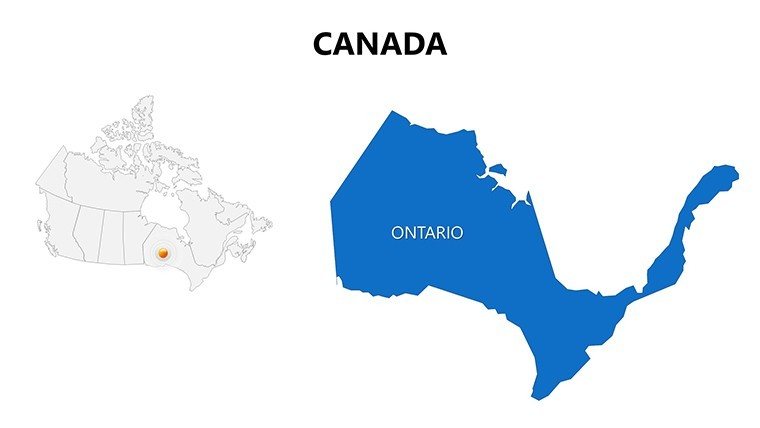
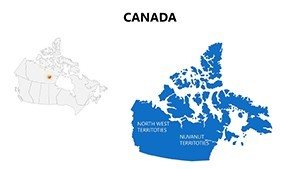
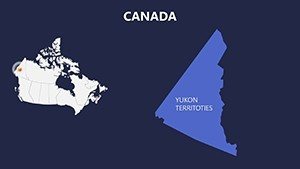
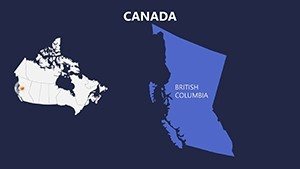
Dive into the template's structure, where precision meets creativity. For urban planners eyeing trans-Canada rail expansions, the province overview slides allow pinpointing key hubs like Toronto or Vancouver, overlaying timelines for phased constructions. Environmental experts can highlight territories like Nunavut for climate impact studies, using editable boundaries to delineate protected areas in line with Canadian Environmental Assessment Agency guidelines.
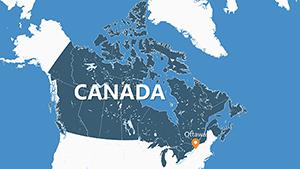
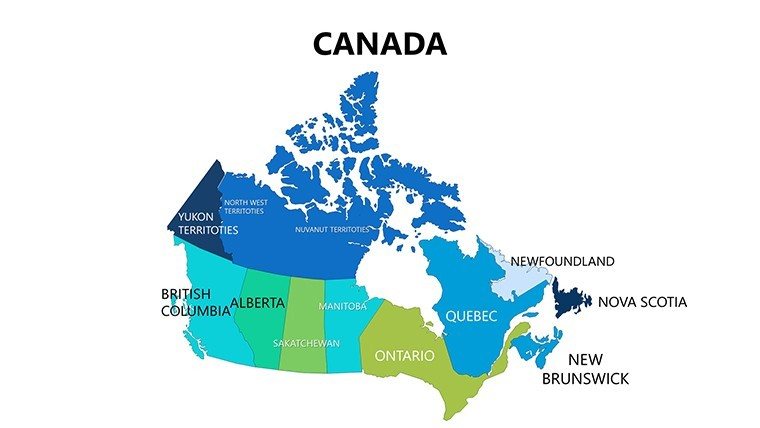
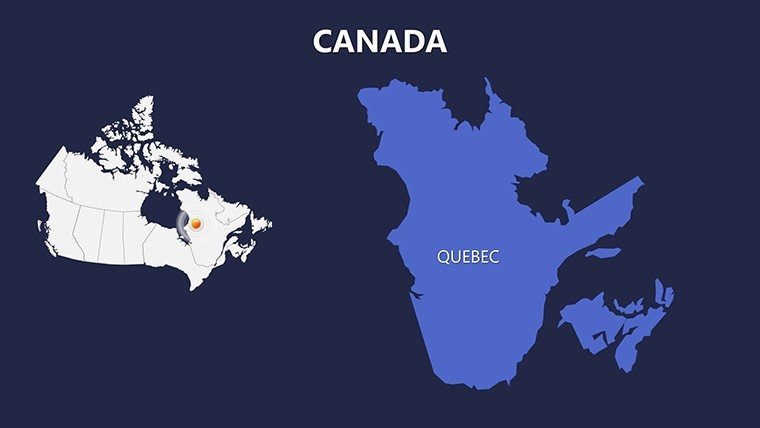
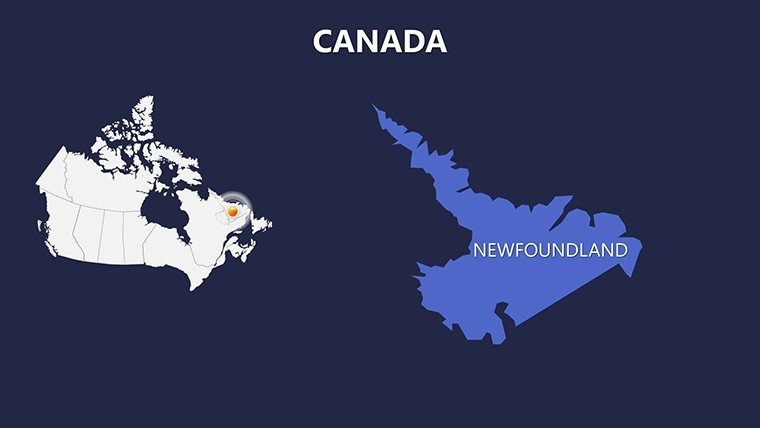
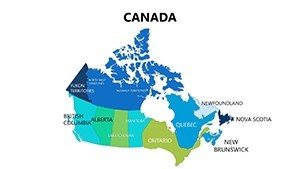
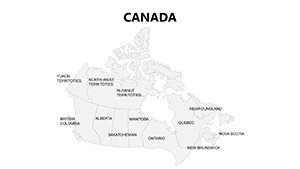
- Slide 1-5: National Overview and Provinces – Broad maps of Canada's 10 provinces and 3 territories, perfect for introductory segments in policy briefings.
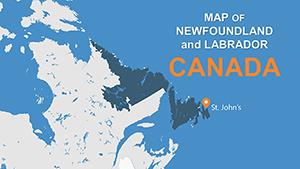
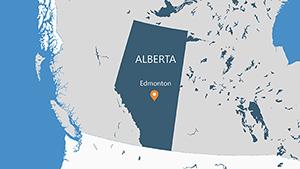
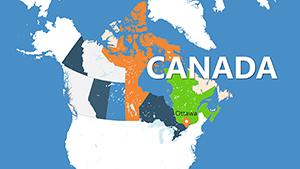
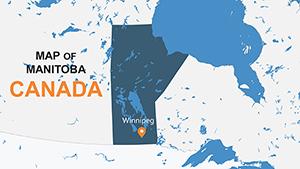
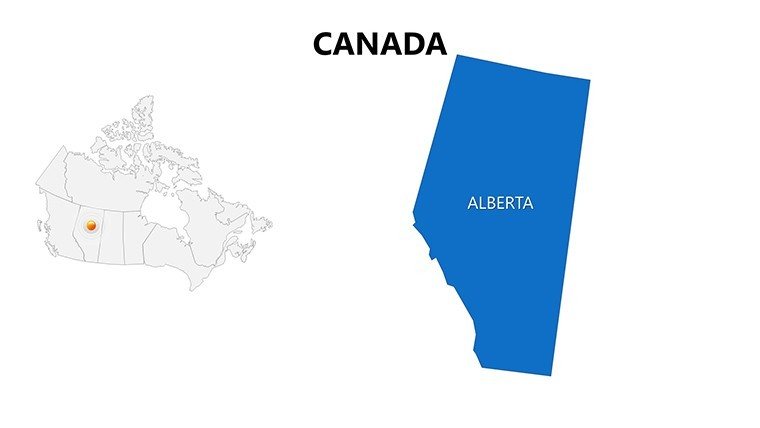
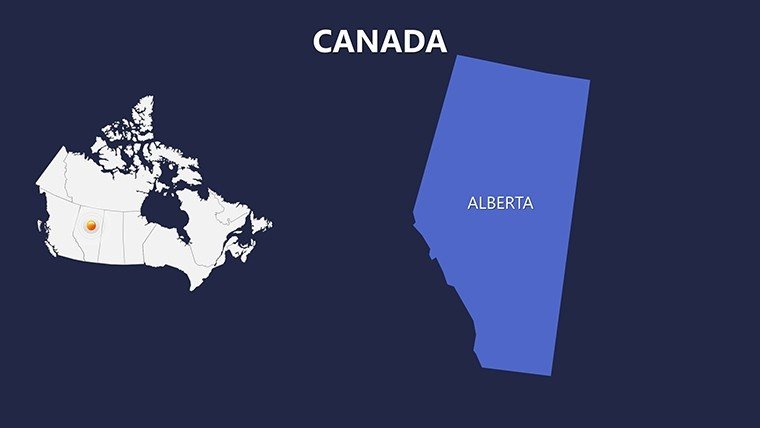
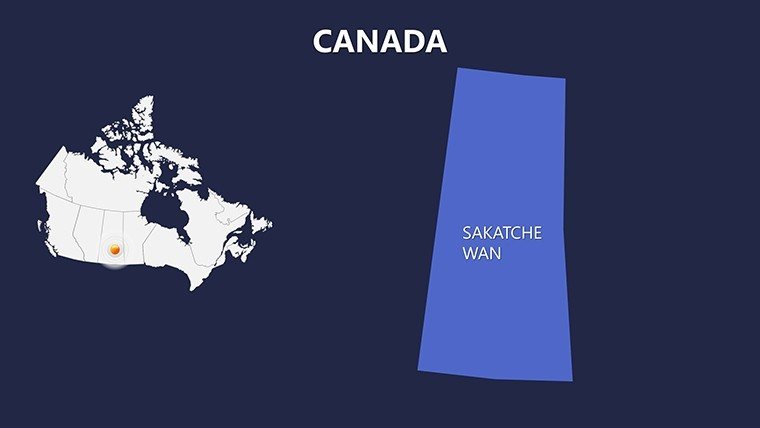
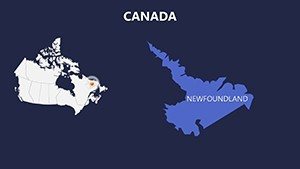
- Slide 6-12: Regional Details – Focus on Western Canada (e.g., Rockies in Alberta) for resource mapping, or Eastern maritime provinces for fisheries data.
- Slide 13-18: Urban Centers – City-specific layouts for Montreal's cultural districts or Calgary's energy sectors, ideal for economic pitches.
- Slide 19-22: Physical Features – Maps of coastlines and mountains, with space for annotations on tourism routes or ecological zones.
Integration is effortless: Embed hyperlinks to external resources or animate paths to trace migration patterns, making your presentation a journey through Canada's diversity.
Pro Tips for Seamless Customization
Begin with the template's drag-and-drop interface - swap fonts to match educational materials or corporate decks. For architecture visuals, add layered infographics showing building densities in Ontario, drawing from real case studies like Vancouver's green skyscrapers. This approach not only saves time but elevates your by demonstrating geospatial savvy, much like pros at firms such as Stantec use for national projects.
Versatile Applications Across Industries
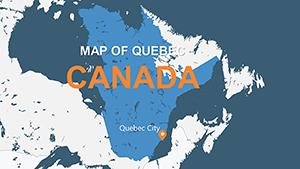
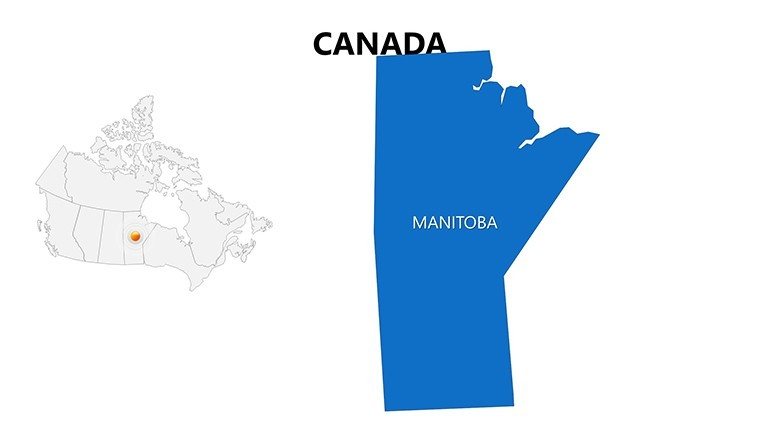
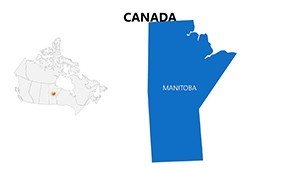
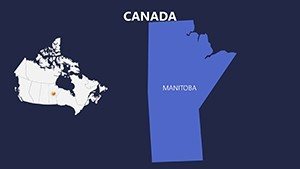
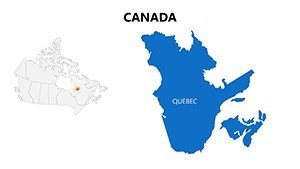
Business professionals leverage these maps for market entry strategies, plotting consumer trends across Quebec's bilingual markets versus Manitoba's agricultural heartlands. In education, teachers create interactive lessons on indigenous territories, fostering discussions on reconciliation efforts. Tourism operators map adventure trails from Banff to the Cabot Trail, pinning highlights to attract adventure seekers.
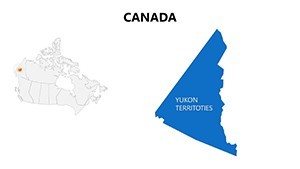
Government agencies find value in disaster response planning, overlaying risk zones on territorial maps for proactive simulations. Nonprofits use them for fundraising pitches, visualizing aid distribution in remote areas like the Yukon.
- Step 1: Select Your Focus Area – Choose slides matching your topic, like coastal maps for marine projects.
- Step 2: Input Custom Data – Use placeholders for stats, such as population growth charts integrated via PowerPoint tools.
- Step 3: Brand and Animate – Apply your logo and sequence elements for narrative flow, e.g., revealing provinces one by one.
- Step 4: Test and Present – Preview in slideshow mode; compatible with PowerPoint and Google Slides for hybrid events.
Unlike standard maps that fade into the background, this template's high-quality vectors stand out, reducing prep by 50% according to user feedback from similar tools. It's a game-changer for anyone dealing with Canada's expansive scale.
Empower Your Narrative with Canadian Precision
What sets this apart is its blend of accuracy and adaptability, informed by cartographic best practices. Whether mapping urban sprawl in the GTA or conservation in the North, it builds trust through detailed, reliable visuals. Architects, take note: Pair these with BIM software exports for holistic project overviews.
Seize the moment - download the Collection of Canada PowerPoint Maps template and navigate your presentations to new horizons with confidence and style.
Frequently Asked Questions
What makes these Canada maps high-resolution and scalable?
Utilizing vector graphics, the maps remain sharp at any size, from thumbnails to full-screen projections, ensuring professional quality in all formats.
How can educators use this template for interactive lessons?
Teachers can edit labels and add quizzes via hyperlinks, aligning with curriculum on Canadian geography and history for engaging classroom activities.
Is customization limited to colors, or more?
Go beyond colors - resize shapes, add pins for cities, and integrate logos or charts for a fully branded experience.
Can it support environmental impact visualizations?
Yes, overlay data like carbon footprints on territorial maps, ideal for sustainability reports following federal guidelines.
What's the compatibility with presentation software?
Fully works in PowerPoint 2013+ and Google Slides; animations transfer smoothly for versatile use.
Are there pre-built icons for Canadian features?
Indeed, includes icons for mountains, cities, and routes, customizable to fit themes like tourism or industry.