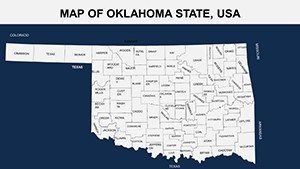
Oklahoma PowerPoint Maps: Unlock State Insights with Editable Templates


Type: PowerPoint Maps template
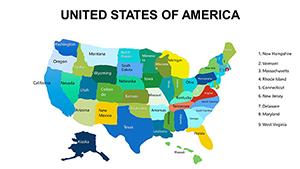
Category: North America
Sources Available: .pptx
Product ID: PM00064
Template incl.: 26 editable slides
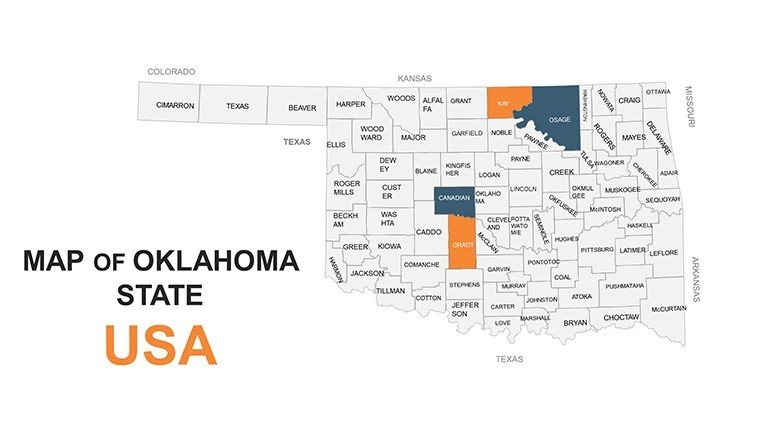
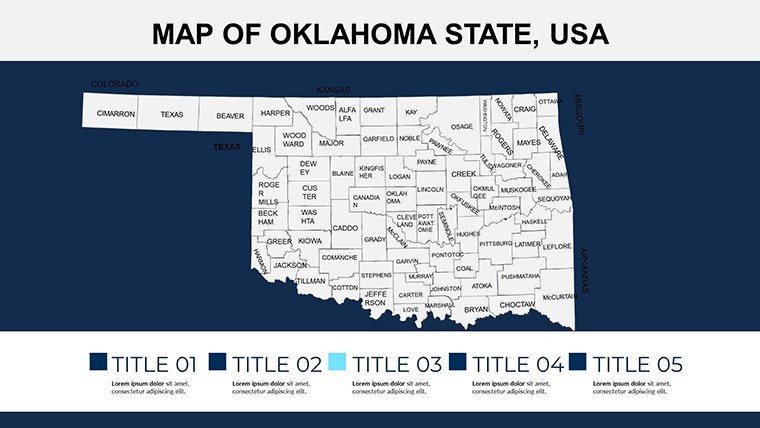
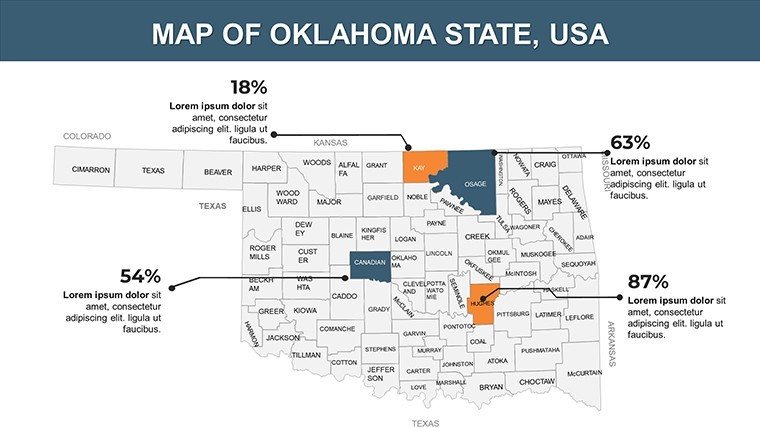
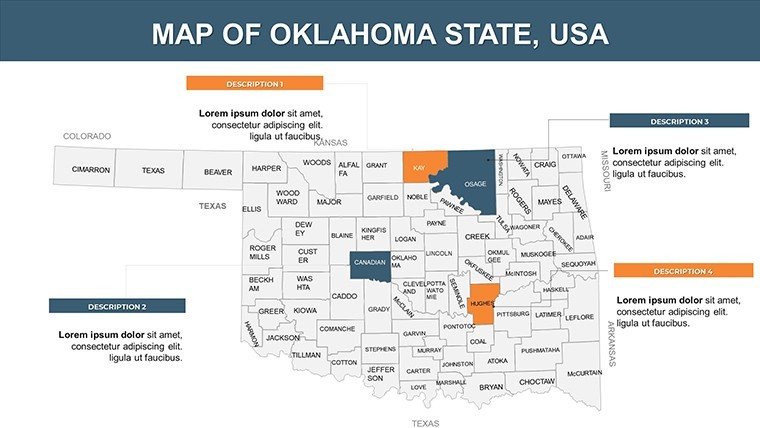
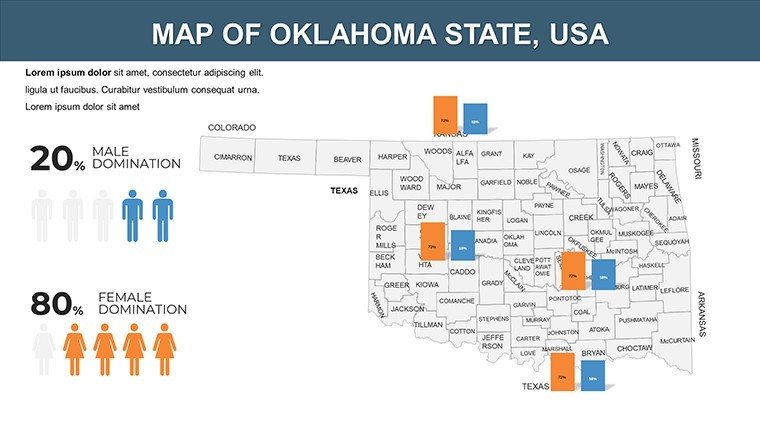
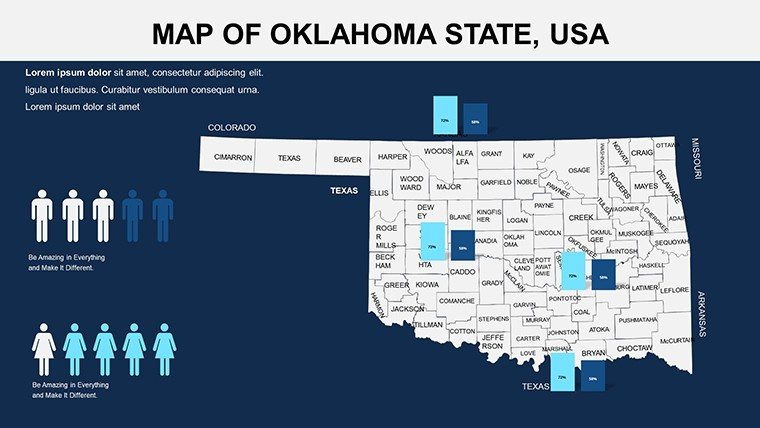
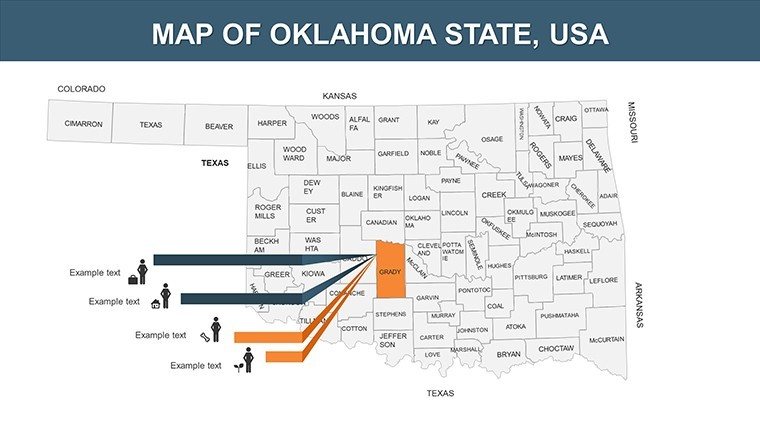
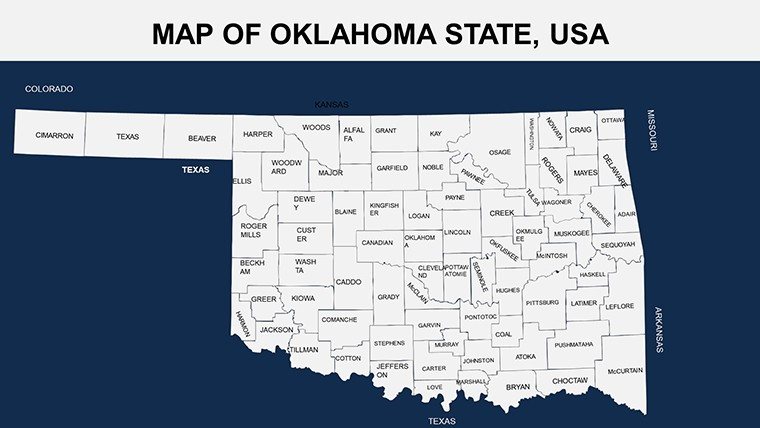
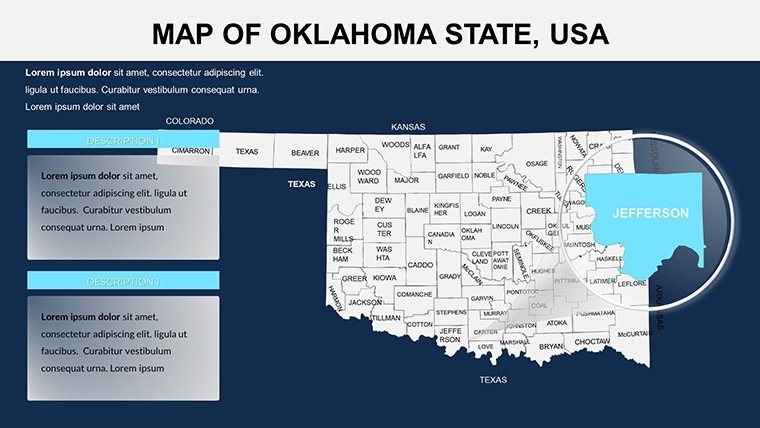
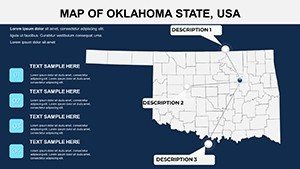
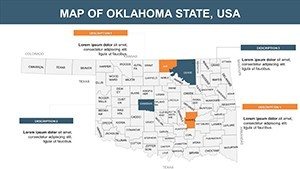
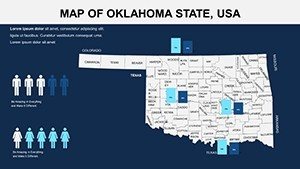
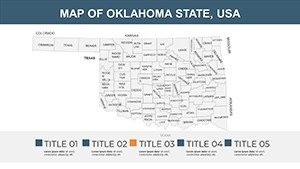
Dive into the heart of the Sooner State with our USA States PowerPoint Maps of Oklahoma template, designed for those who need to bring geographic stories to life. Whether you're a corporate strategist analyzing energy markets in Tulsa or an educator exploring Native American heritage sites, this 26-slide powerhouse equips you with tools to visualize rolling plains, bustling cities, and cultural landmarks. Forget generic maps; these are tailored for precision, allowing you to highlight economic trends like oil production or tourism draws such as Route 66. With full editability, adapt to your audience's needs - business leaders can map market expansions, while teachers illustrate historical events like the Land Run. This template bridges data and design, ensuring your presentations are not just informative but memorable, saving you time and elevating your professional edge in fields from energy to education.
Unmatched Customization for Your Oklahoma Narratives
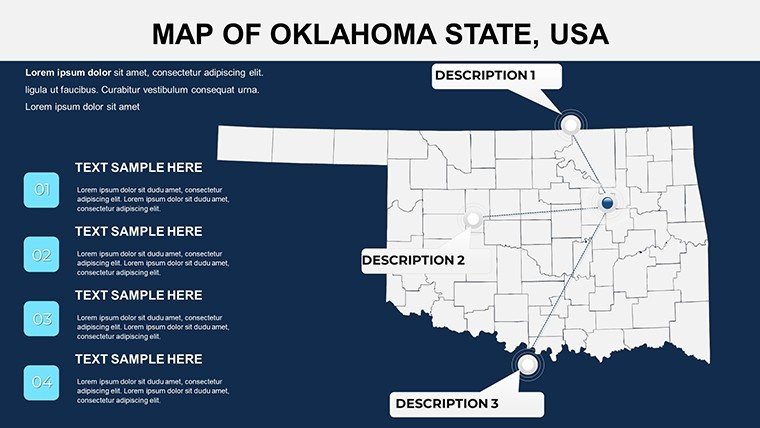
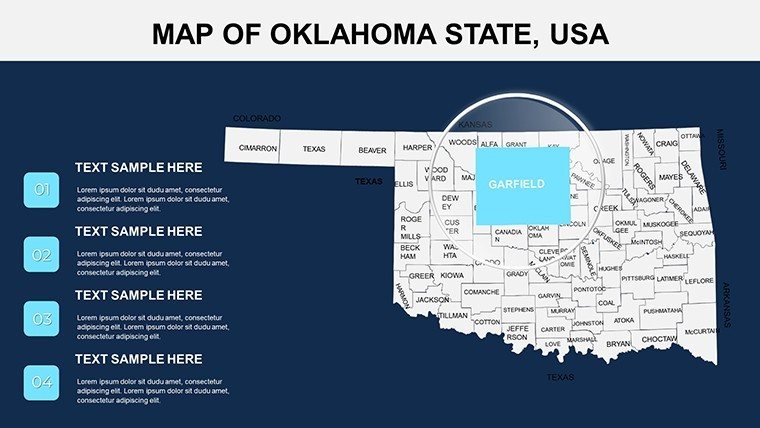
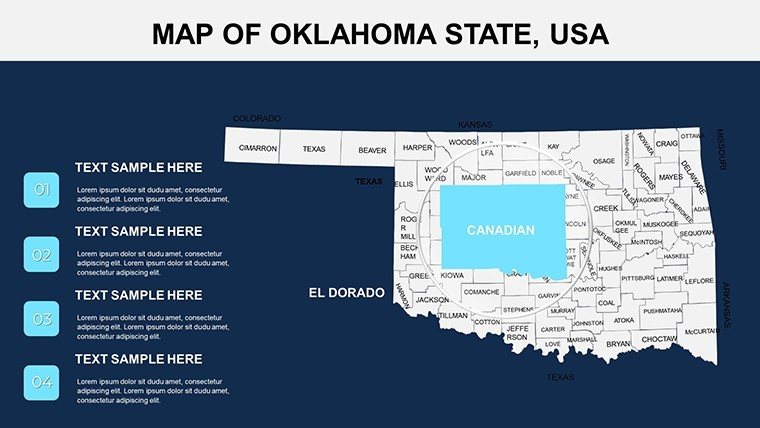
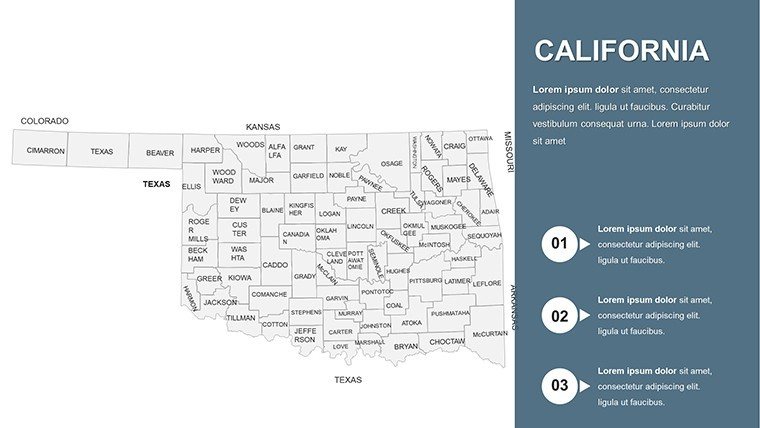
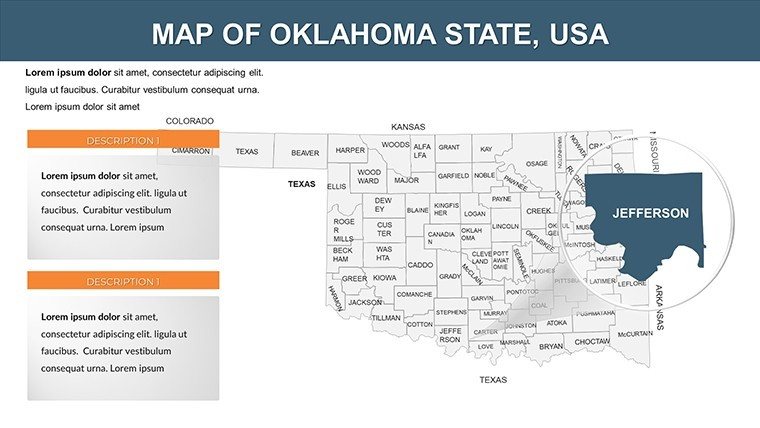
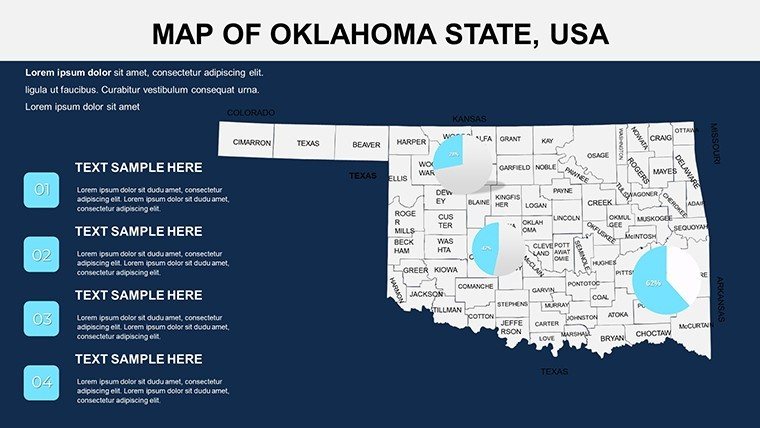
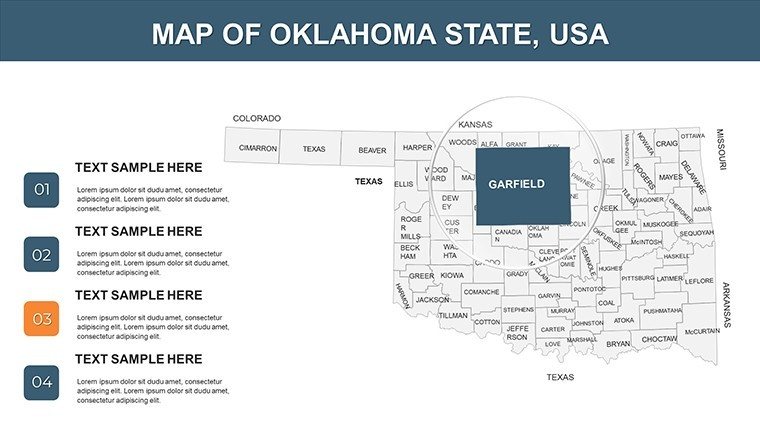
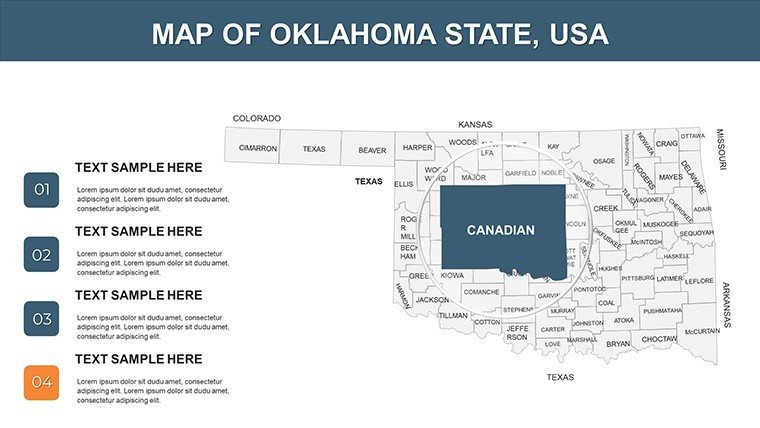
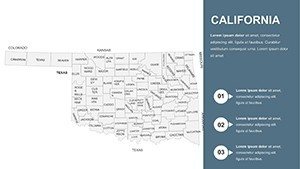
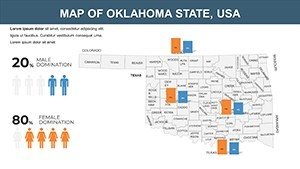
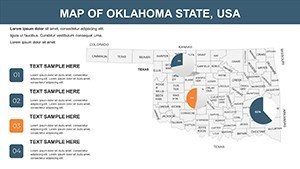
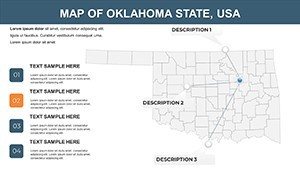
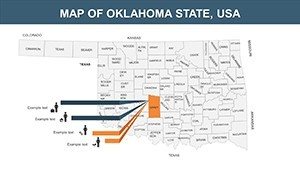
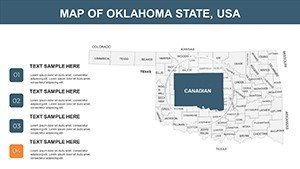
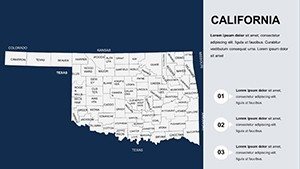
At the core of this template is unrivaled flexibility. Each of the 26 slides features high-quality, vector maps that scale perfectly for any screen size. Customize color schemes to evoke Oklahoma's red earth tones or vibrant festival vibes, and tweak fonts for emphasis on key areas like Oklahoma City's urban growth. Editable elements include labels for counties, rivers like the Arkansas, and icons for landmarks such as the Cherokee Nation headquarters. Compared to basic PowerPoint tools, our template offers pre-layered designs for quick data integration, such as embedding graphs on agricultural outputs or population shifts. No need for advanced skills; it's user-friendly for all levels, with .pptx compatibility ensuring seamless workflow integration.
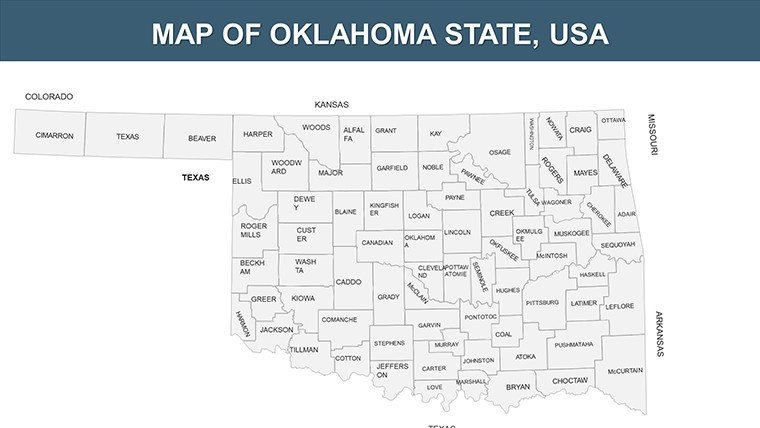
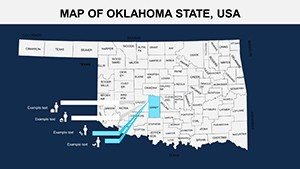
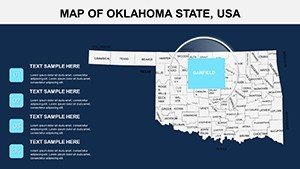
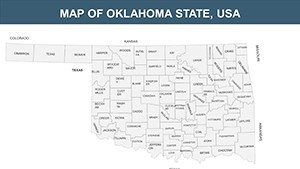
- Detailed State Coverage: Maps of major cities, counties, and natural features for in-depth analysis.
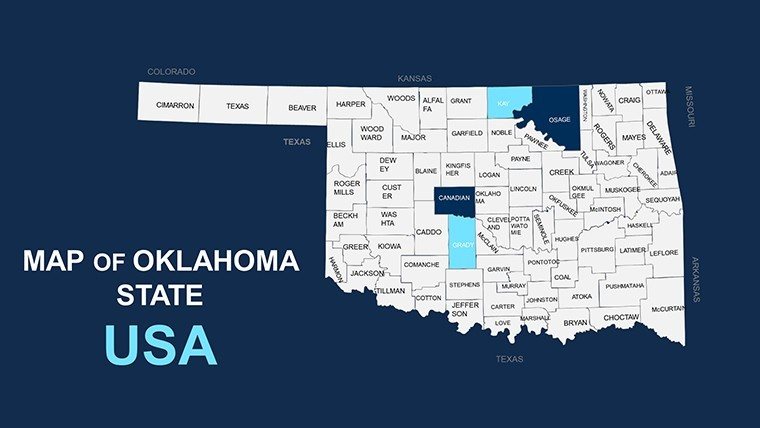
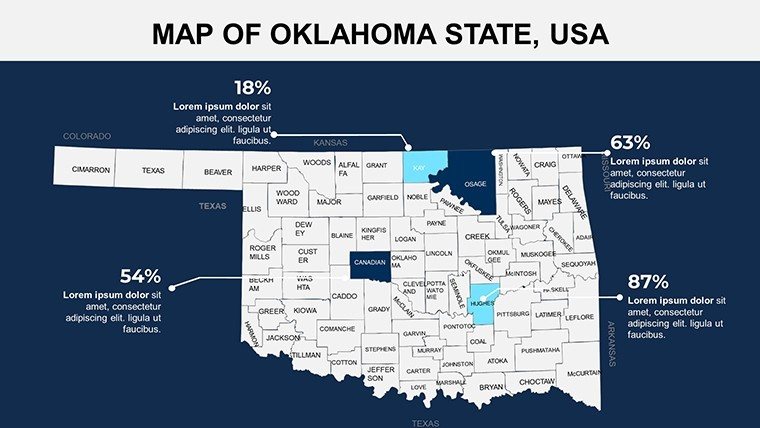
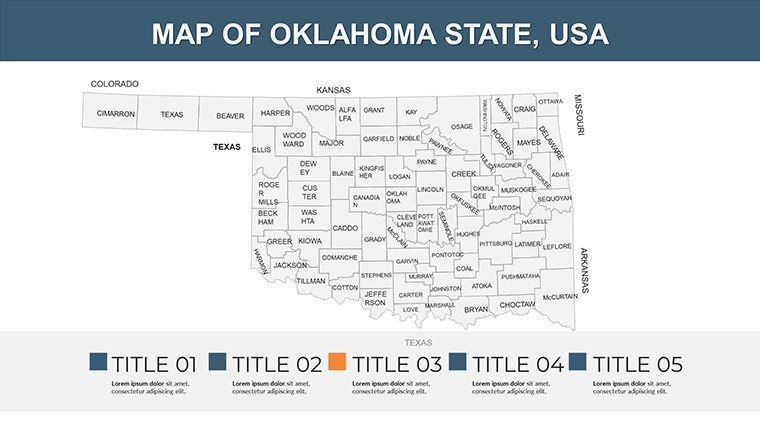
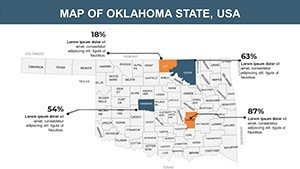
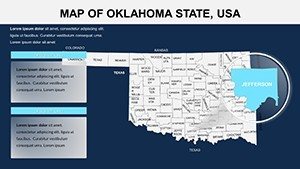
- Visual Enhancements: Options for thematic overlays, like economic zones or cultural districts.
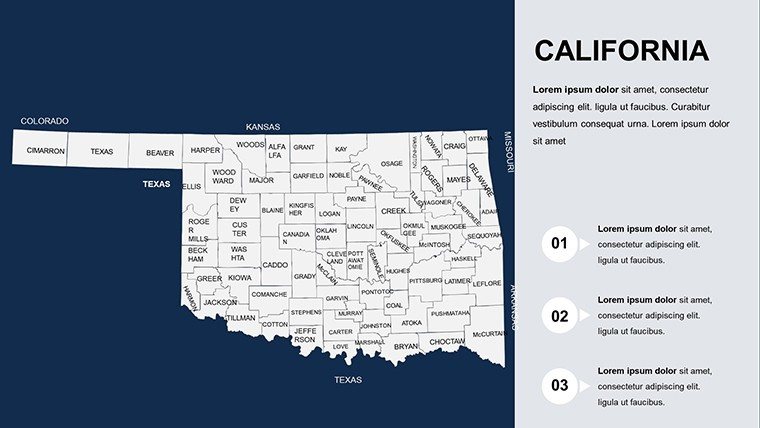
- Easy Edits: Change sizes, colors, and add animations without quality loss.
- Versatile Formats: Ready for presentations, reports, or digital sharing.
Industry-Specific Use Cases That Drive Results
Envision a energy executive using these maps to plot drilling sites in the Anadarko Basin, aligning with industry standards for clear stakeholder communication. Educators can create interactive lessons on Oklahoma's Dust Bowl history, overlaying timelines on affected regions. In tourism, agencies highlight attractions like the National Cowboy Museum, crafting compelling itineraries that boost visitor engagement. For market analysts, visualize consumer trends across the state, identifying opportunities in sectors like aerospace in Tinker Air Force Base areas. Unlike stock images, these customizable slides allow for real-time updates, such as incorporating recent census data for accurate demographic studies. This template excels in nonprofit settings too, mapping community initiatives for grant proposals. By focusing on user pain points like time-consuming design, it streamlines creation, letting you concentrate on content that resonates.
Workflow Integration: From Concept to Delivery
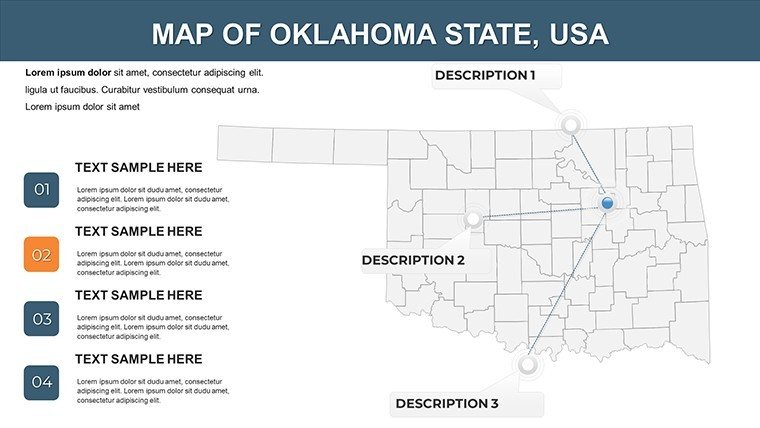
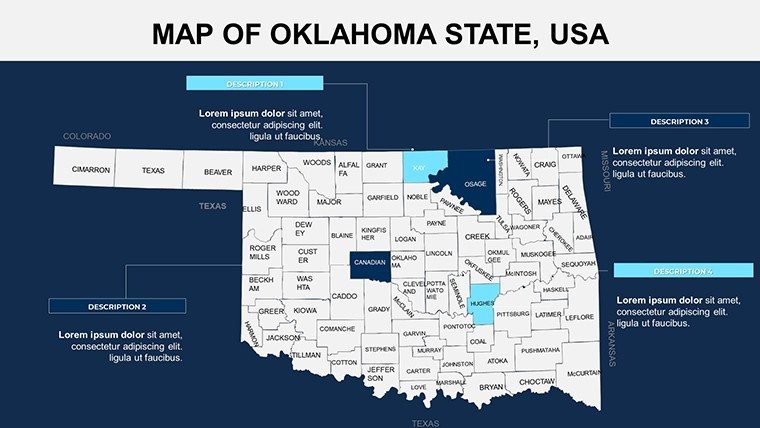
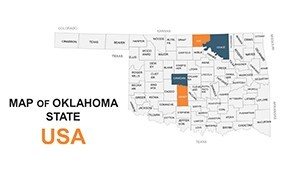
- Choose a slide template, such as a full-state view or zoomed county map.
- Customize visuals to match your theme, adding data points like GDP growth.
- Incorporate supporting elements, such as charts for comparative analysis.
- Test for flow, ensuring smooth transitions between slides.
- Export or present directly, confident in professional polish.
This efficient process, informed by marketing best practices, can cut prep time in half, making it ideal for tight deadlines in fast-moving industries.
Pro Tips from Design and SEO Experts
Drawing from experience in optimizing visual content, layer maps with subtle gradients for depth, enhancing readability for audiences. Reference real-world cases, like how Oklahoma's tourism board uses similar visuals for award-winning campaigns. Balance elements to avoid overload - aim for clean designs that highlight key insights, such as renewable energy shifts in western counties. For , cite reliable sources like USGS for geographic accuracy. These strategies not only improve presentation quality but also aid in search visibility with terms like "customizable Oklahoma maps."
Elevate your state-focused stories now - grab this Oklahoma template and inspire your audience.
Frequently Asked Questions
Are the slides fully customizable?
Yes, edit colors, texts, and layouts effortlessly in PowerPoint.
Does it work with Google Slides?
Upload to Google Slides for compatibility, though PowerPoint is recommended for full features.
What are common applications for this template?
Great for education on history, business market analysis, and tourism planning.
Is licensing included for professional use?
Absolutely, suitable for commercial presentations and reports.
How many slides are there?
26 editable slides covering various Oklahoma map views.