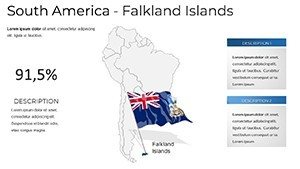
Falkland Islands PowerPoint Maps Template


Type: PowerPoint Maps template
Category: South America
Sources Available: .pptx
Product ID: PM00225
Template incl.: 9 editable slides
As someone who's crafted countless decks for C-suite executives at global firms, environmental NGOs, and academic conferences, I know the power of a well-mapped slide. When pitching sustainable development strategies to investors in London or briefing policymakers on remote ecosystem challenges in Buenos Aires, the Falkland Islands PowerPoint Map Template has become my go-to for distilling vast archipelagic complexities into clear, compelling visuals. This isn't just a set of slides - it's a strategic tool that lets you overlay economic data on sheep pastures, trace historical expedition routes across tussock grasslands, or highlight conservation hotspots amid the South Atlantic's chill winds. Built for PowerPoint 2016 and later, plus seamless Google Slides integration, it empowers you to focus on your narrative, not the nitty-gritty of vector tweaks.
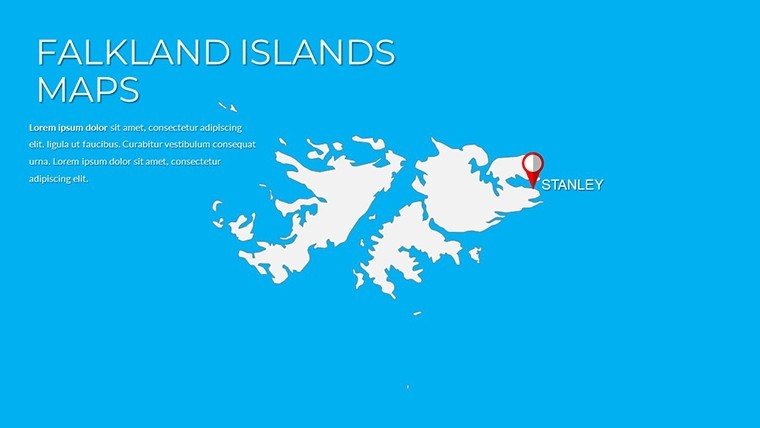
Picture this: You're a logistics director at a fisheries conglomerate, preparing to justify expanded operations in sub-Antarctic waters. Instead of fumbling with clunky default shapes, you drop in this template's layered outlines of the 778-island chain, instantly pinpointing key ports like Stanley with custom pins for supply hubs. Or as a university lecturer, you're animating a module on post-colonial territorial dynamics - here, editable paths mark 19th-century whaling grounds, drawing students into the islands' layered past without a single yawn. I've seen these maps transform dry reports into dynamic stories, holding boardroom attention like a gripping documentary. With its one-time license for lifetime edits across unlimited projects, it's the practical edge every presenter needs in 2025's fast-paced hybrid meetings.
Core Features: Built for Seamless Falklands Visualization
This template stands out because it's engineered by designers who understand the Falklands' unique scale - those scattered isles demand precision, not guesswork. Every element is vector-based, ensuring scalability from thumbnail previews to 4K projections, and fully unlocked for your tweaks. Dive into the intuitive layers: separate ones for landmasses, waterways, and urban nodes mean you can isolate East Falkland's urban pulse or zoom on the West's wild expanses without redrawing a thing.
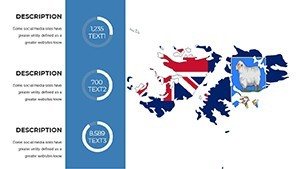
Interactivity? Absolutely - embed hyperlinks to live feeds of albatross migrations or embeddable stats from recent fisheries yields, turning static overviews into explorable dashboards. Color schemes draw from the terrain itself: muted grays for rocky outcrops, vibrant greens for upland bogs, all adjustable via theme tools to match your brand's palette. And for data lovers, built-in smart art connectors let you link pie visuals of export breakdowns (think wool versus squid) directly to territorial zones, saving hours in alignment hassles.
Customization at Your Fingertips
- Region-Specific Edits: Tailor boundaries for the Outer Islands group, adding callouts for endemic species like the striated caracara, perfect for biodiversity pitches.
- Annotation Tools: Drag-and-drop labels for coordinates, with font scaling that adapts to dense cluster views around Sea Lion Island.
- Integration Ready: Paste in Excel-sourced figures on visitor influx to Mount Pleasant, auto-formatting into heat-mapped overlays.
- Animation Presets: Subtle fades reveal layered timelines, like sequential reveals of settlement eras from 1764 onward.
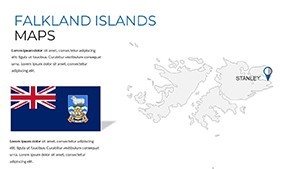
Slide-by-Slide Mastery: Navigating the Archipelago
With nine meticulously crafted slides, this template guides you through the Falklands like a seasoned skipper's logbook. Start broad, then drill down - each one primed for your inputs, from raw GIS exports to hand-sketched insights.
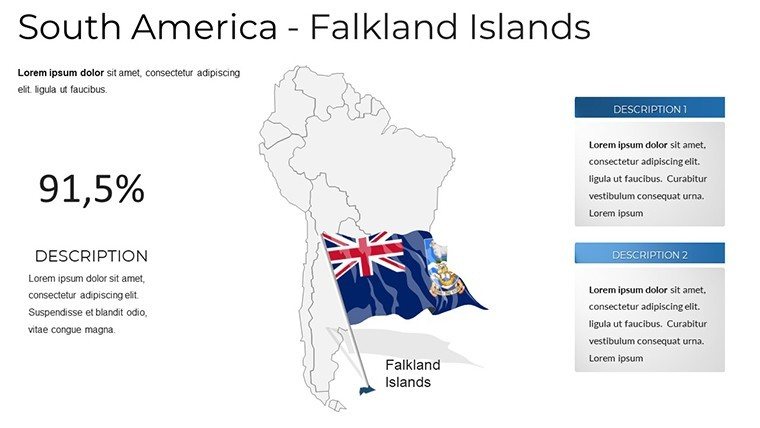
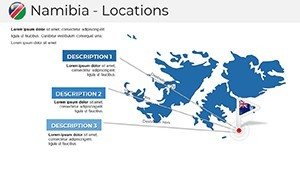
Slide 1: Archipelagic Panorama
The opener sets the stage with a full-spread relief map, contours etched to show elevation shifts from coastal flats to interior moors. I've used this to kick off investor decks, layering satellite-derived shading to underscore untapped renewable potentials in wind-swept plateaus.
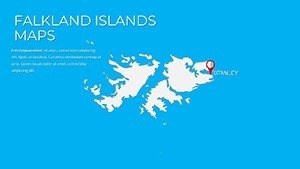
Slides 2-3: East Falkland Deep Dive
Zero in on the populated core: Stanley's harbor gets pinpoint icons for trade flows, while adjacent wetlands host embeddable bar graphs on wetland restoration metrics. In a recent client session for a heritage trust, I swapped defaults for these to chart cultural site distributions, sparking targeted funding discussions.
Slides 4-5: West Falkland Wilds
Shift to the untamed west, where elongated bays and hillocks demand flexible scaling. Add route lines for overland treks or cluster markers for research stations - these slides shone in my prep for a documentary producer's pitch, visualizing filming logistics across Fox Bay's expanse.
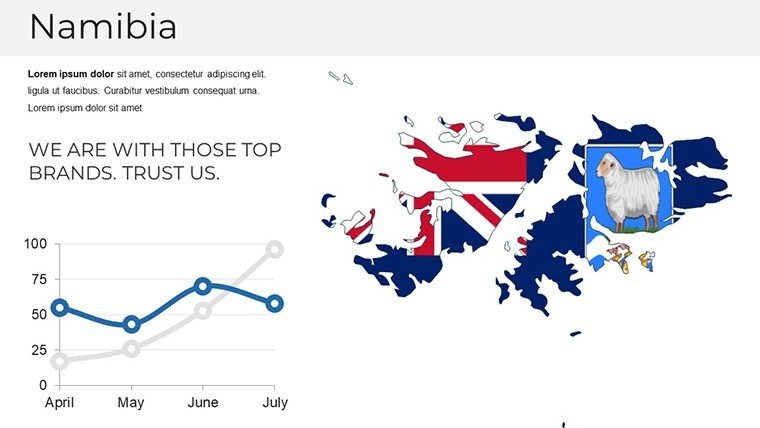
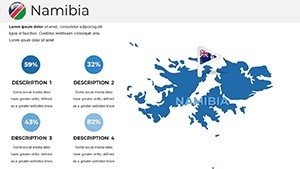
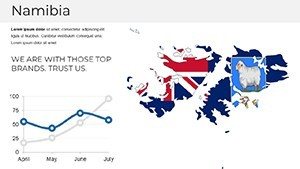
Slides 6-7: Outer Reaches and Data Fusion
For the peripheral gems like Jason Islands, simplified outlines prevent overcrowding, ideal for appending species range polygons. Then, transition to analytical hubs: one slide fuses line charts of seasonal currents with island silhouettes, a lifesaver for oceanographers I've consulted, correlating drift patterns to fishery yields.
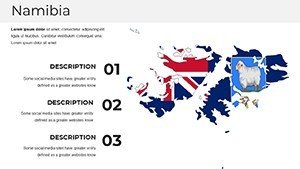
Slides 8-9: Strategic Overlays and Closer
Wrap with versatile closers - a network diagram for inter-island ferries or a radial chart orbiting economic drivers around the capital. In government advisory work, I've capped reports here, projecting future infrastructure nodes to advocate for resilient port upgrades.
Where Consultants and Leaders Deploy This Template
In my weekly grind building decks for Fortune 500 advisors and startup founders, this Falklands mapper slots into niches where geography isn't backdrop - it's the backbone. Consultants at firms like McKinsey use it to map supply vulnerabilities in remote sourcing chains, overlaying tariff impacts on wool shipments to European markets. Managers in agribusiness lean on it for quarterly reviews, plotting pasture rotations against weather anomalies pulled from local met stations.
Educators from K-12 to grad seminars integrate it effortlessly: a high school history teacher I mentored animated conflict perimeters to contextualize sovereignty debates, while a marine biology prof layered acoustic survey data for lectures on krill migrations. Founders pitching eco-tourism ventures? They thrive with itinerary blueprints that trace zodiac routes to black-browed albatross colonies, converting skeptics into backers during demo days.
Workflow Integration: From Concept to Conference
Slot this into your pipeline without friction. Import via drag-and-drop into existing decks, then leverage PowerPoint's co-authoring for team refinements - I've synced edits live during client calls, adjusting harbor depths on the fly for accuracy. Pair with tools like Tableau exports for dynamic embeds, or Canva icons for thematic flair, ensuring your Falklands visuals sync with broader slide themes. Export as animated GIFs for email teasers, or PDF for archival compliance in regulatory filings. The result? Decks that load fast on any device, from Zoom shares to printed handouts, keeping your audience locked in.
Real-World Wins: Stories from the Field
Flashback to last quarter: A conservation director at a UK-based trust needed to sway donors on habitat fragmentation. We loaded this template, pinned erosion zones along Chartres River, and wove in trend lines from 2024 surveys - outcome? A six-figure pledge within weeks. Or take the venture capitalist evaluating a kelp farming startup; mapping cultivation plots against tidal flows clarified scalability risks, fast-tracking due diligence.
In academia, a colleague at an Antarctic research symposium used it to juxtapose ice core proxies with island chronologies, earning nods from panelists for its clarity. Even in corporate training, HR leads have adapted it for team-building scenarios, tracing "expedition paths" across the map to symbolize collaborative navigation - engaging without gimmicks.
Falklands Template vs. Stock PowerPoint Tools: A Side-by-Side
| Aspect | Falkland Islands PowerPoint Map Template | Default PowerPoint Maps |
|---|---|---|
| Geographic Fidelity | Pre-scaled vectors matching official surveys, with adjustable contours for precise elevation and bathymetry. | Generic outlines prone to distortion; manual scaling often warps remote isles like Weddell Island. |
| Data Layering | Modular stacks for seamless overlays - e.g., economic indicators atop terrain without bleed. | Basic shapes require grouping hacks; overlays clash in complex views like multi-island fisheries. |
| Customization Depth | Unlockable elements with theme-linked colors and smart connectors for instant brand alignment. | Limited to fill tools; recoloring ignores regional nuances, like distinguishing moorlands from beaches. |
| Interactivity Options | Native hyperlinks and triggers for fact pops, enhancing engagement in live or recorded sessions. | Requires add-ins for basics; no built-in paths for route animations across archipelagic spans. |
| Time Efficiency | Ready-to-edit in under five minutes, freeing focus for content strategy. | Hours spent sourcing and aligning free vectors, risking inaccuracies in sensitive territorial depictions. |
This matchup isn't theoretical - I've swapped stock tools mid-project for this template, slashing prep time by half while boosting client feedback on visual trustworthiness.
Use Cases Spanning Sectors: Tailored Applications
Environmental Advocacy: NGOs mapping invasive species spread across tussac grass zones to rally policy changes, embedding petition links for direct action.
Travel and Hospitality: Boutique operators diagramming bespoke safaris to Volunteer Point, with seasonal icons for gentoo penguin peaks to entice high-end clientele.
Government and Diplomacy: Officials illustrating maritime boundaries in bilateral talks, using neutral tones to foster dialogue on shared resource management.
Research and Academia: Field scientists plotting seismic activity rings around New Island, correlating with avian population shifts for grant proposals.
Business Development: Exporters visualizing trade corridors from Port Howard to global hubs, forecasting logistics bottlenecks with arrow flows.
Across these, the template's Falklands-specific calibration ensures your visuals resonate authentically, sidestepping the pitfalls of off-the-shelf generics.
Ready to map your next breakthrough? Grab this template and watch your presentations gain that expert polish.
Frequently Asked Questions
Is this Falkland Islands map template compatible with older PowerPoint versions?
No, it's optimized for PowerPoint 2016 and newer, including Microsoft 365, to leverage advanced vector handling. For earlier versions, consider exporting static PDFs.
Can I add my own data visualizations to these Falklands slides?
Yes, the layered design supports easy insertion of charts, graphs, or tables - simply align via guides for professional fusion with the map elements.
How detailed are the island representations in this template?
Every major landform, from Saunders Island's volcanic plugs to the intricate fjords of Steeple Jason, is rendered with scalable precision for both overview and close-up use.
Does the template include animation suggestions for Falklands routes?
Absolutely - pre-set entrance effects for paths and reveals help sequence narratives, like tracing historical voyages from Port Louis to Darwin Harbour.
Is it suitable for sensitive topics like territorial disputes?
Yes, its neutral, editable framework allows balanced depictions, drawing from verified sources to maintain credibility in diplomatic or educational contexts.
Can this be used in Google Slides for collaborative editing?
Definitely - upload the .pptx file directly; all vectors and interactions port over smoothly for real-time team tweaks.