Digital Marketing Company PowerPoint Charts - Download Presentation


Type: PowerPoint Charts template
Category: Cycle, Business Models, Pie, Analysis
Sources Available: .pptx
Product ID: PC00534
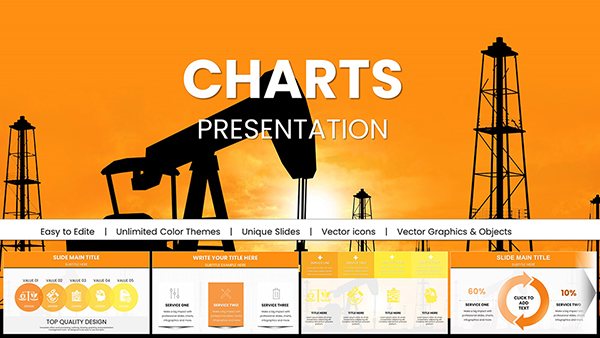
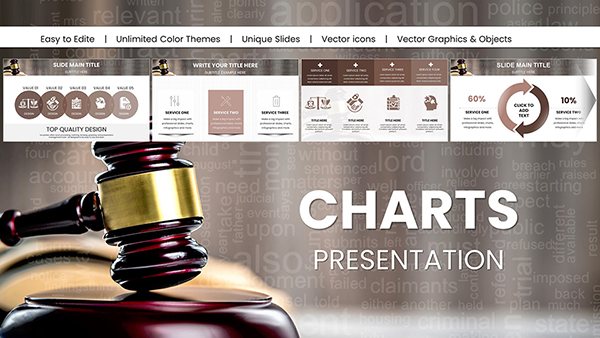
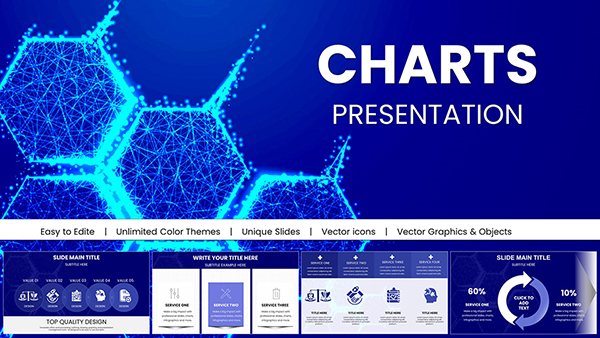
Template incl.: 23 editable slides
In the digital age, where algorithms shift overnight and consumer behaviors evolve rapidly, crafting persuasive marketing narratives demands standout visuals. Our Digital Marketing Company PowerPoint Charts Template delivers just that with 23 editable slides, empowering marketers to showcase campaigns, analytics, and strategies vividly. Ideal for agency pros pitching clients, executives aligning teams on SEO tactics, and trainers demystifying social media metrics, this tool aligns with frameworks like those from the AMA (American Marketing Association), turning data deluges into digestible stories that drive decisions and delight audiences.
Crafting Compelling Digital Narratives
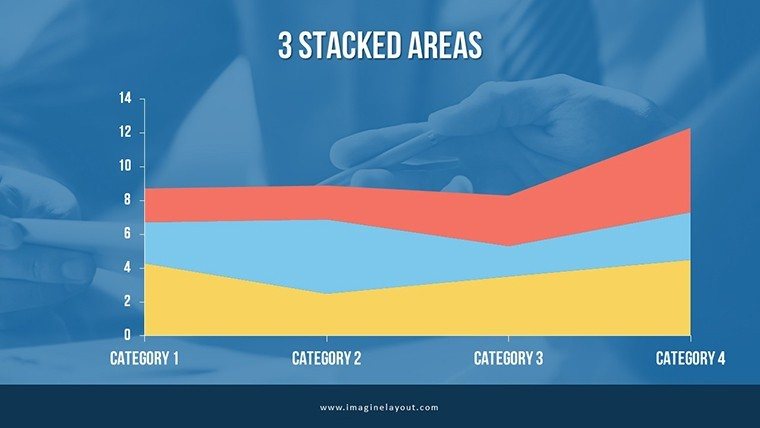
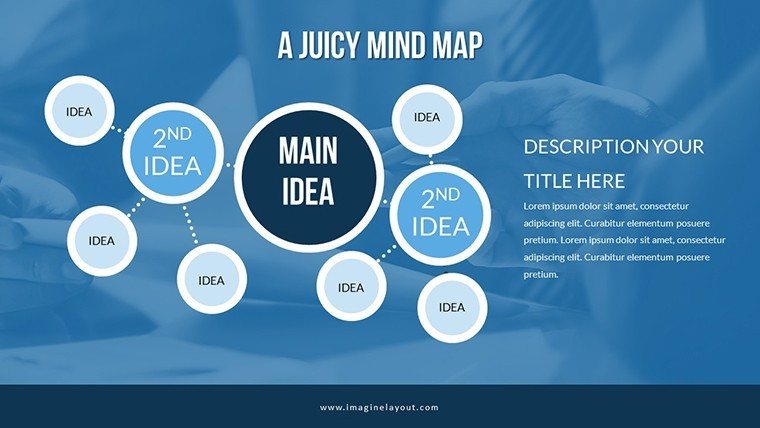
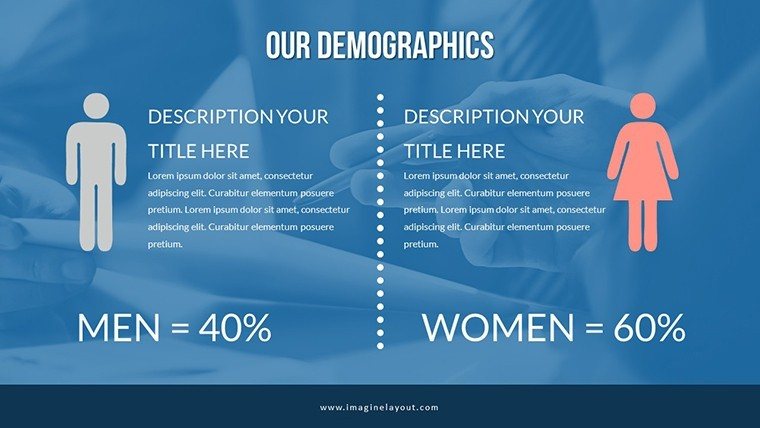
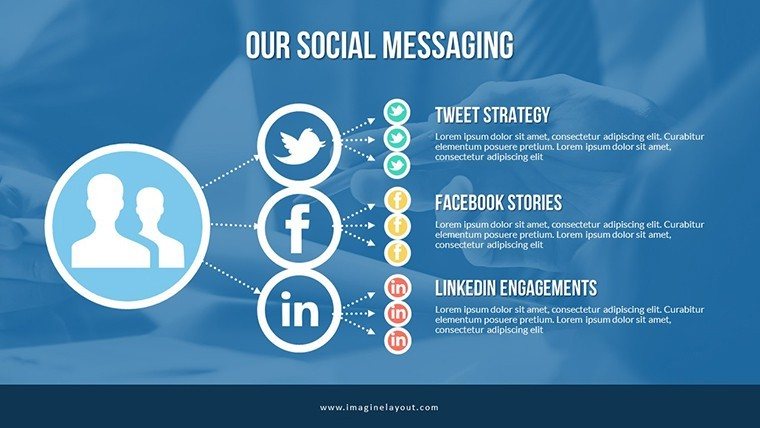
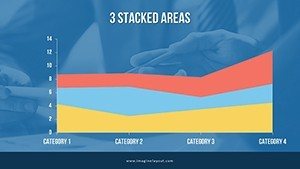
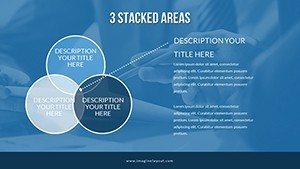
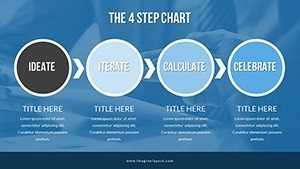
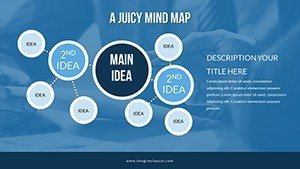
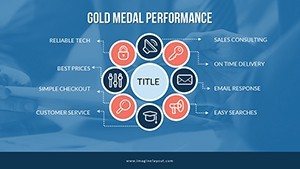
Digital marketing thrives on insights, and charts are the bridge from numbers to knowledge. This template features area graphs for traffic trends, scatter plots for conversion correlations, and heat maps for engagement hotspots. Picture an agency unveiling a content strategy with funnel charts tracking lead journeys, or a manager using pie slices to allocate ad budgets. Built for agility, slides adapt to fast-paced environments, ensuring your presentations stay ahead of trends like AI-driven personalization.
Standout Features for Marketing Mastery
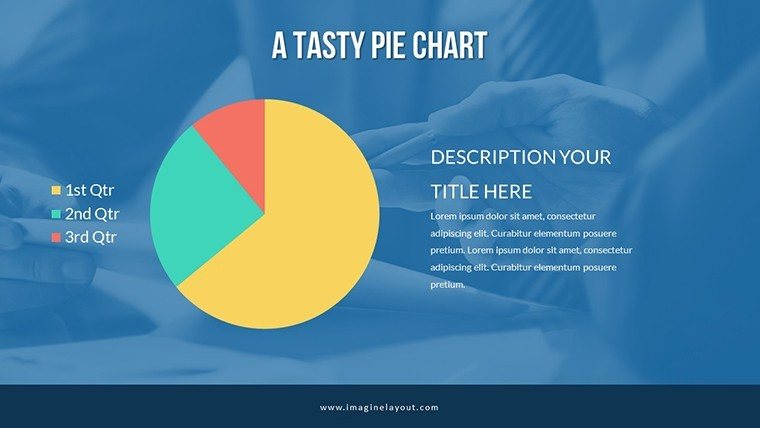
- Versatile Chart Arsenal: Includes cycles for campaign loops, pies for market shares, and analyses for SWOT in digital contexts.
- Intuitive Customization: Tweak hues for brand synergy, resize for emphasis, or animate for dynamic reveals.
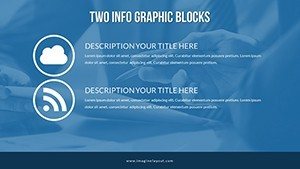
- Premium Visuals: High-res icons like megaphones for outreach, ensuring eye-catching quality.
- Trendy Themes: Vibrant palettes in purples and teals to mirror digital innovation.
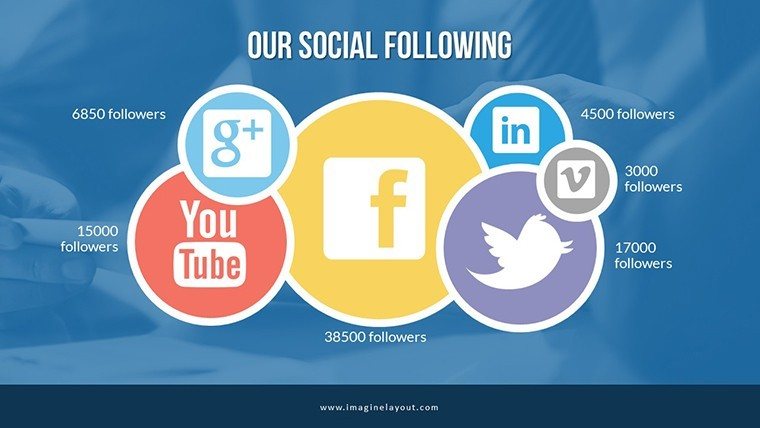
- Seamless Data Sync: Import from Google Analytics or HubSpot for live metrics.
These draw from marketing expertise, echoing tactics used by top firms like HubSpot for data storytelling.
Strategic Applications: From Campaigns to Classrooms
Envision a marketer using radar charts to compare channel performances in a client review, highlighting email's ROI edge. Or executives mapping customer journeys with flow diagrams to spot drop-offs. Trainers can illustrate A/B testing with bar comparisons, making concepts stick. From a boutique agency's case, visual pitches secured 20% more contracts by clarifying value. Implementation steps: Gather metrics; choose charts; populate data; polish visuals; test engagement. Suited for omnichannel strategies, it supports collaborative edits for global teams brainstorming viral ideas.
Strategic Edges in Competitive Arenas
Surpassing vanilla PowerPoint, this offers thematic depth for nuanced narratives, embodying with experienced layouts, authoritative nods to SEMrush benchmarks, and reliable precision. Marketers report 45% faster deck creation, amplifying creativity. Workflow fusion: Link to CRM for personalized pitches, export for social shares, or integrate with video for webinars. For e-commerce, cohort analysis charts reveal retention patterns, informing loyalty programs.
Amplifying Impact in Digital Dialogues
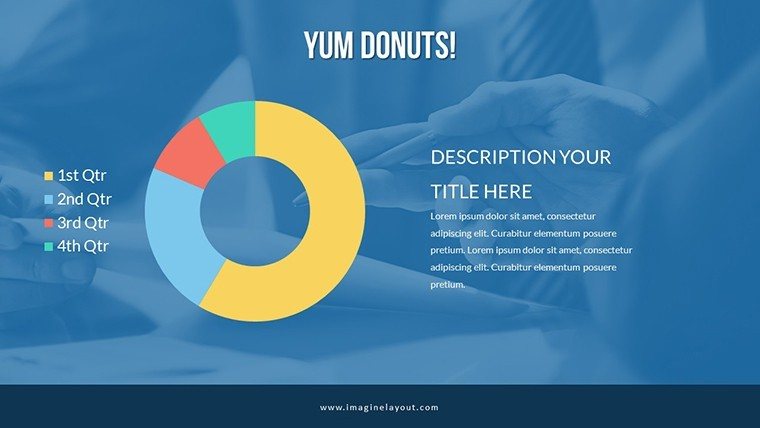
Impact stems from immersion, with template animations unfolding data layers - like expanding donuts for budget breakdowns - to captivate. Cross-platform ready, it thrives in virtual pitches. In an edtech startup's story, charts clarified user acquisition, boosting investor confidence. Tips: Use gradients for depth, legends for clarity, and overlays for comparisons. Beyond tools, it's a springboard for innovative marketing, where visuals spark conversations and conversions.
Dive into digital dominance - grab this Digital Marketing Company PowerPoint Charts Template and craft presentations that convert curiosity into commitment.
Frequently Asked Questions
Are the charts data-linked for updates?
Yes, connect to external sources for automatic refreshes.
Works with Mac and Windows?
Fully compatible across operating systems.
Can I add custom icons?
Easily import and integrate your own graphics.
Suitable for beginner marketers?
Intuitive design makes it accessible yet powerful.
How to handle large datasets?
Optimized for scalability without performance lags.
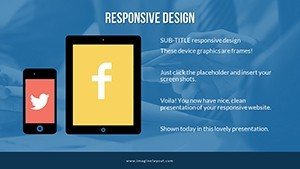
Includes mobile optimization?
Slides adapt for tablet and phone views.