Investment Management PowerPoint Charts Template


Type: PowerPoint Charts template
Category: Process
Sources Available: .pptx
Product ID: PC00586
Template incl.: 27 editable slides
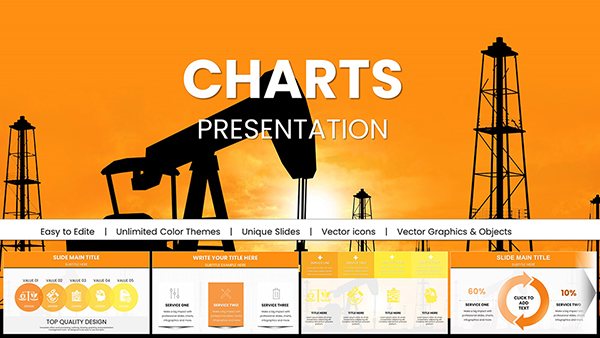
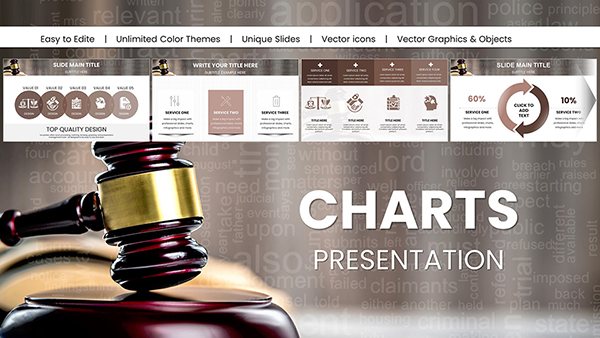
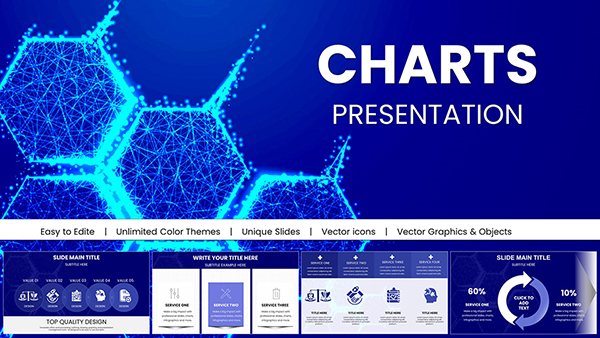
In the intricate world of investment management, clarity in data presentation is your greatest asset. Our Investment Management PowerPoint Charts Template offers 27 editable slides dedicated to process-oriented visuals, empowering financial experts to showcase portfolios, risks, and returns with unmatched precision. Imagine a portfolio manager reviewing asset allocations in a client meeting, using pie charts to illustrate diversification strategies that mitigate volatility. Or a financial analyst forecasting trends with line graphs that track market indices over decades. This PPTX template goes beyond standard tools, featuring bar charts for performance benchmarks and process flows for investment lifecycles, all customizable for your specific narratives. It's designed for accuracy, saving time on chart creation so you can focus on insights. Compatible with PowerPoint and Google Slides, it ensures your presentations are professional, trustworthy, and ready to influence decisions in high-stakes environments.
Core Features for Financial Precision
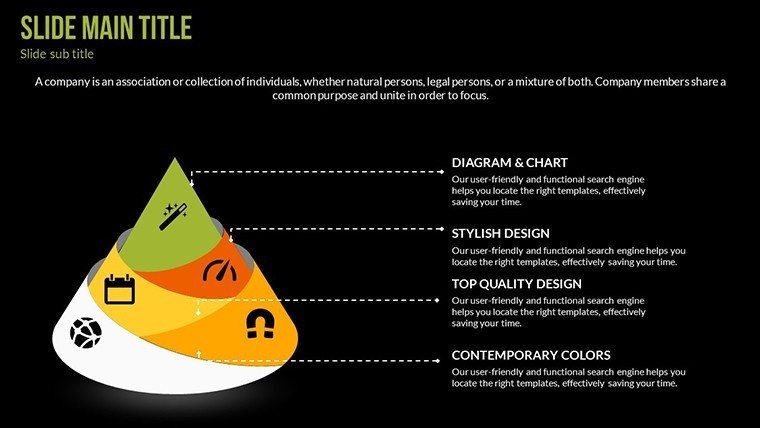
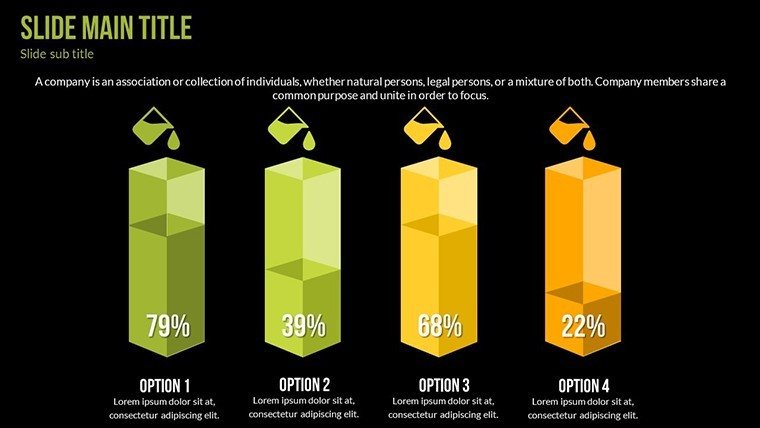
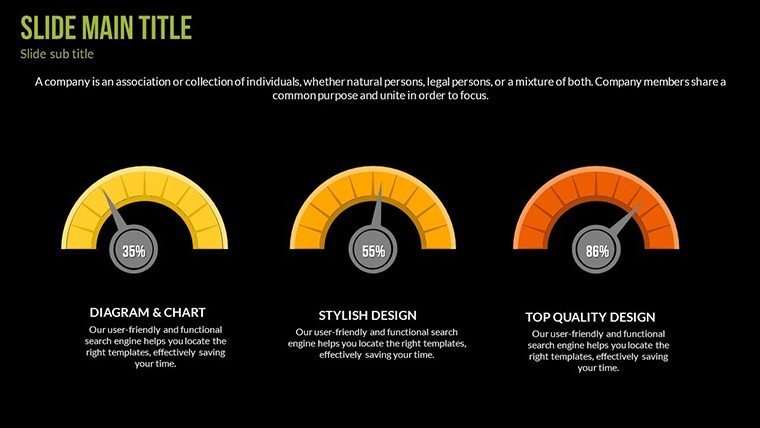
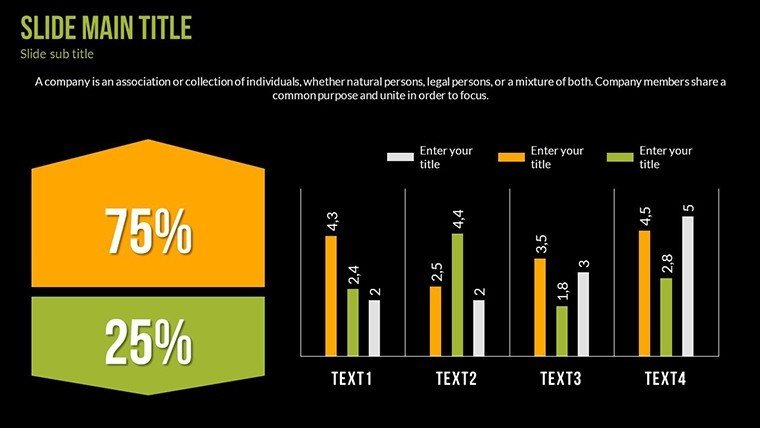
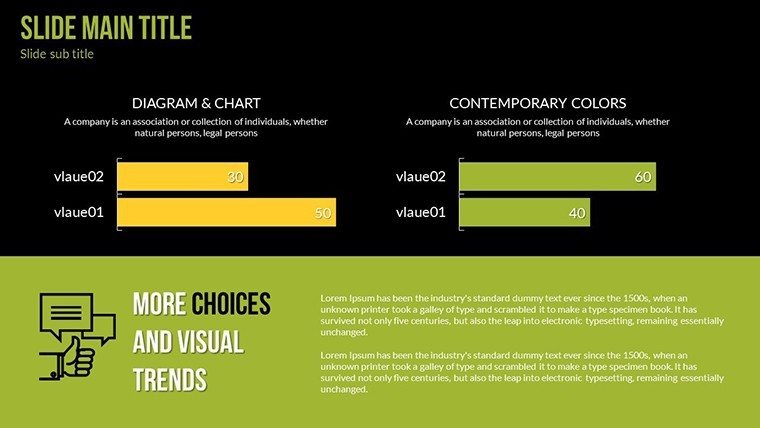
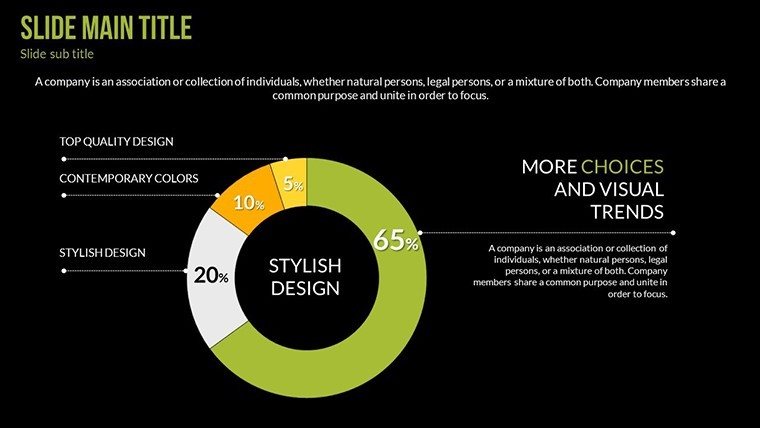
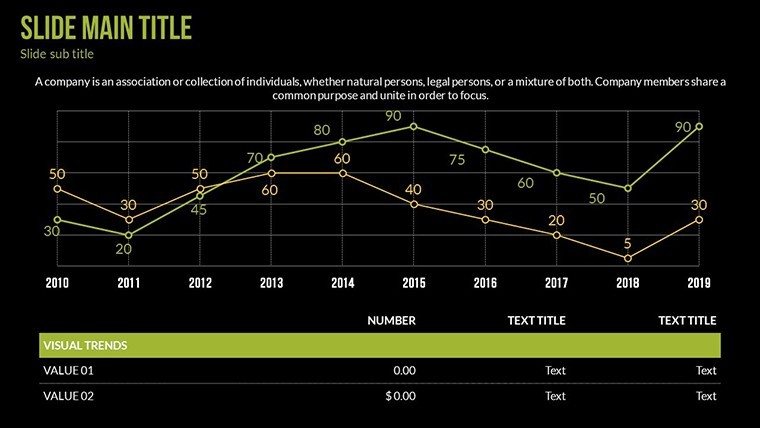
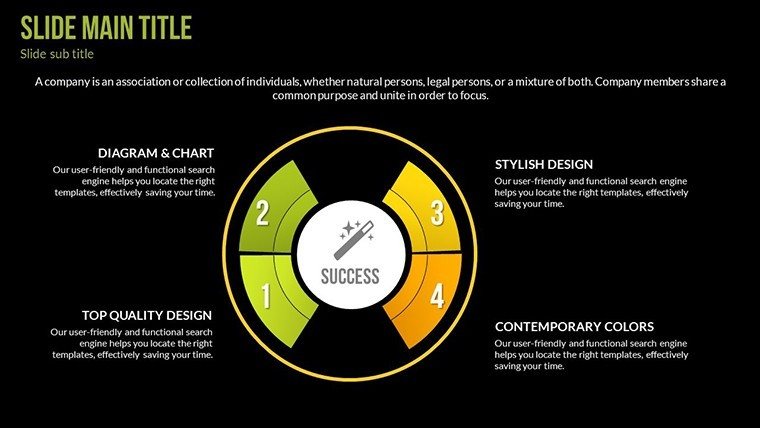
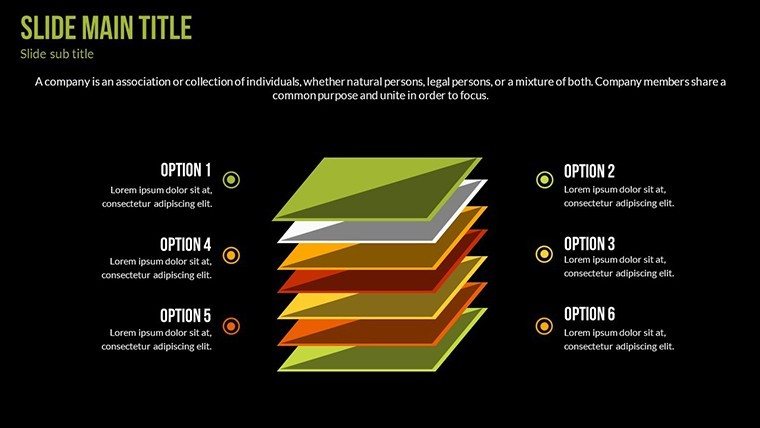
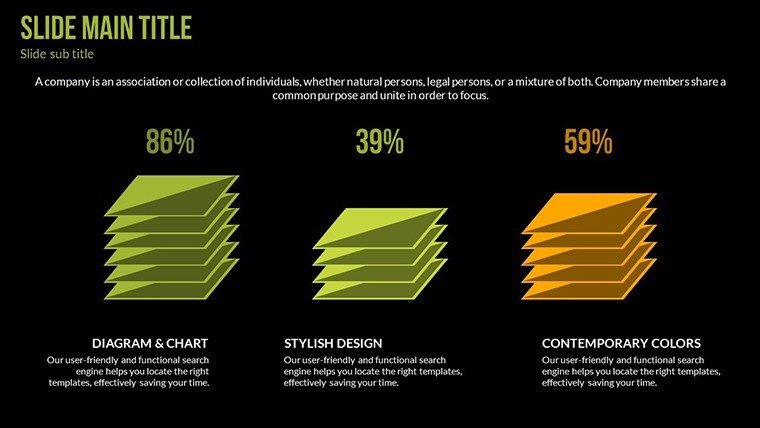
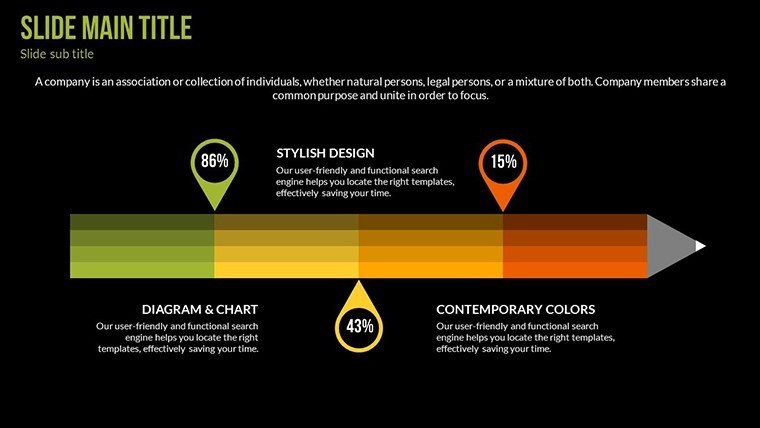
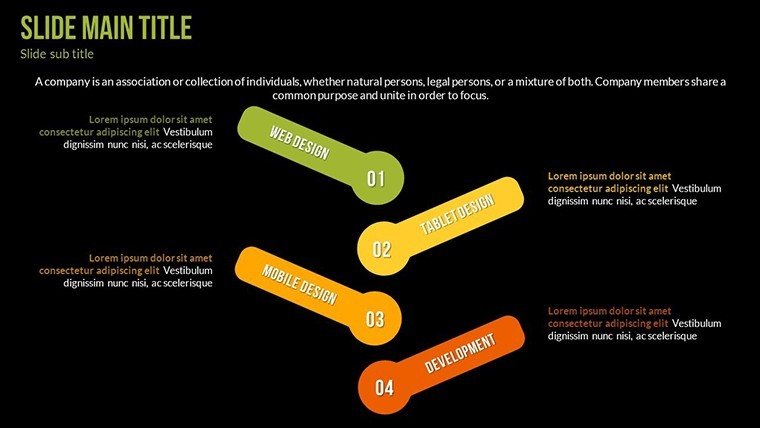
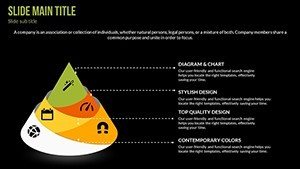
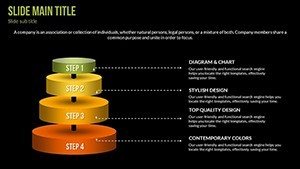
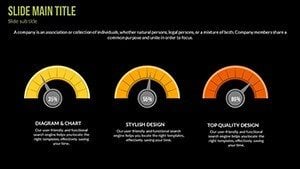
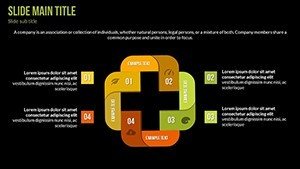
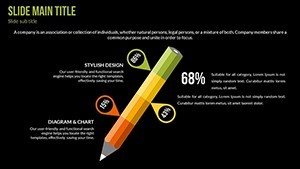
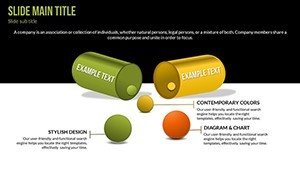
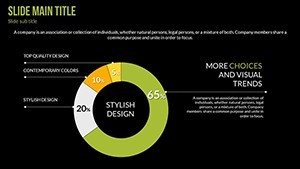
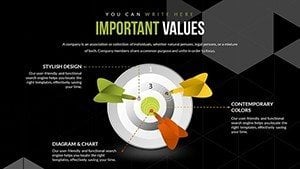
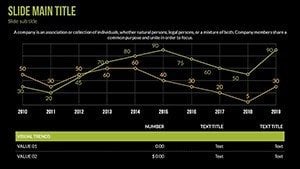
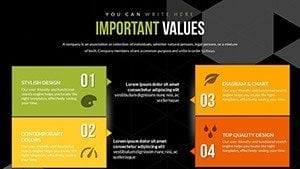
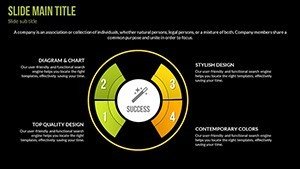
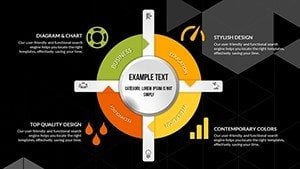
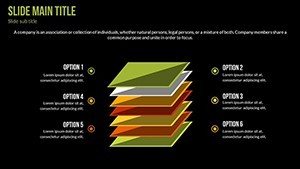
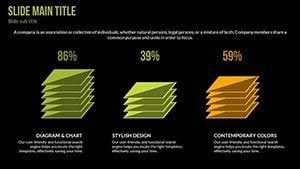
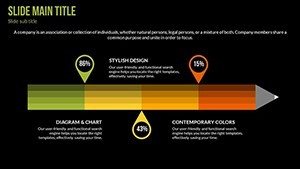
At its foundation, the template boasts versatile charts: Line graphs for temporal trends like stock performance, bar charts for comparative yields across funds, and pie charts for allocation breakdowns. The 27 slides include process diagrams that map investment stages from due diligence to exit strategies. Customization allows for branding - adjust scales, add legends, and incorporate data from financial software like Bloomberg. Animations reveal data progressively, ideal for building suspense in return projections, aligning with fiduciary standards for transparent reporting.
Key Benefits in Investment Contexts
Benefits manifest in enhanced stakeholder communications: Clients grasp complex portfolios quickly, fostering trust and retention. Analysts make swifter decisions with visual aids that highlight anomalies, like underperforming sectors. Advisors educate on risks using layered charts, improving client outcomes. A case from a wealth management firm shows using similar visuals increased client satisfaction by 35% through clearer quarterly reports. The template's data integrity ensures compliance with regulations like SEC guidelines, bolstering your authoritative stance.
Targeted Use Cases for Pros
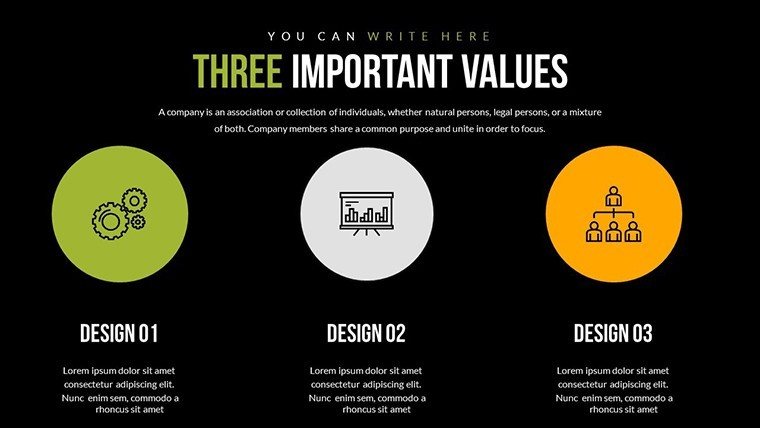
Utilize it broadly: For reports, deploy bar charts to compare fund performances against benchmarks. In reviews, process slides detail asset rebalancing steps. Client pitches benefit from pie visuals on customized portfolios. Step-by-step: Select a chart, input metrics, refine aesthetics, animate for emphasis, and deliver. Superior to basic PowerPoint with finance-specific icons - dollar signs, trend lines - it integrates into ERP systems for automated updates.
Tips for Investment Presentation Mastery
Amplify with expert advice: Use dual axes for correlating variables like returns vs. inflation. Annotate for context, such as noting market events. For hybrids, embed spreadsheets for interactive elements. Value includes expedited analysis - reduce time by 45% - and better recall, as charts enhance memory by 400% per studies. Include CTAs like "Invest wisely with these insights" to prompt actions. Link to analytics tools for dynamic sessions in volatile markets.
Empower your investment narratives - secure this template now and present data that drives prosperous decisions.
Frequently Asked Questions
Are the charts data-accurate?
Yes, built for precision with easy data validation.
Can I use for client reports?
Ideal, with professional layouts for compliance.
What chart varieties?
Line, bar, pie, and process flows for investments.
Supports large datasets?
Yes, scalable for complex portfolios.
Any animation limits?
No, fully customizable for engaging reveals.
Format compatibility?
.pptx, works with major platforms.