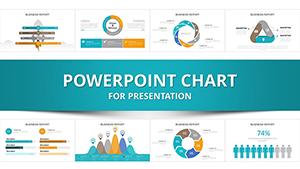
Commerce Data Charts - Editable PPTX | ImagineLayout


Type: PowerPoint Charts template
Category: 3D, Illustrations
Sources Available: .pptx
Product ID: PC00512
Template incl.: 14 editable slides
Files and Formats Included
14 slides come included in the PPTX download.
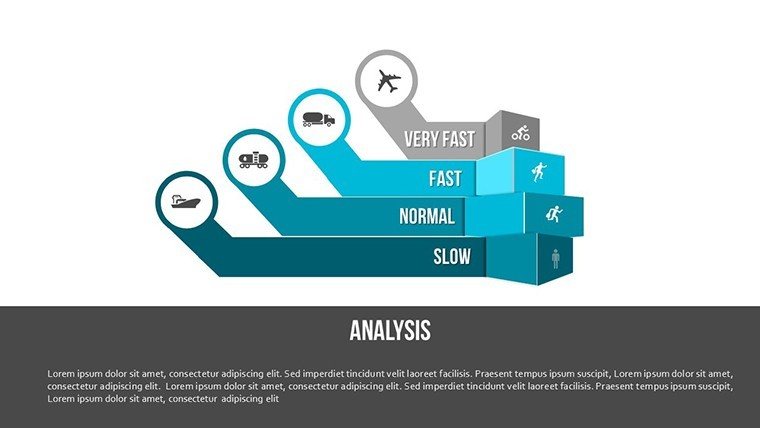
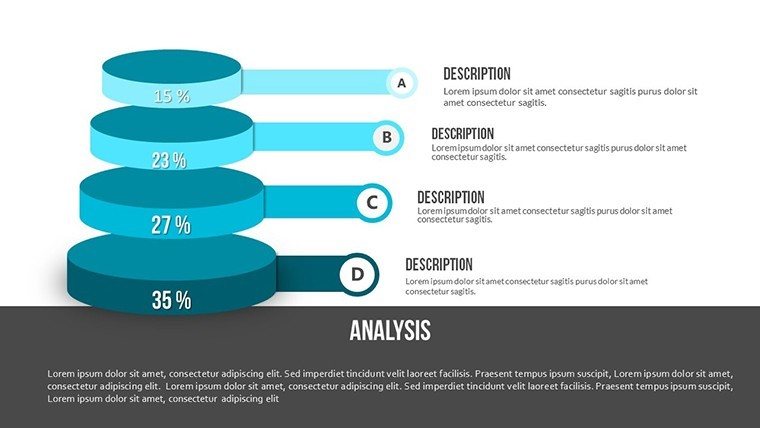
Vectors support trend and forecast visuals.
Charts align for fiscal reporting tasks.
Color palettes allow quick theme swaps.
Compatibility covers standard PowerPoint releases.
Slides combine for sales presentations where data drives decisions.
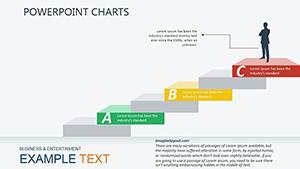
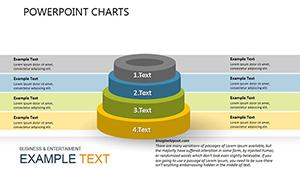
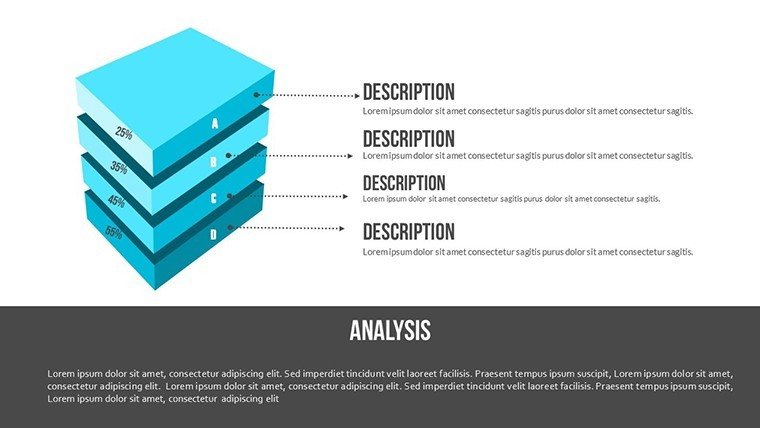
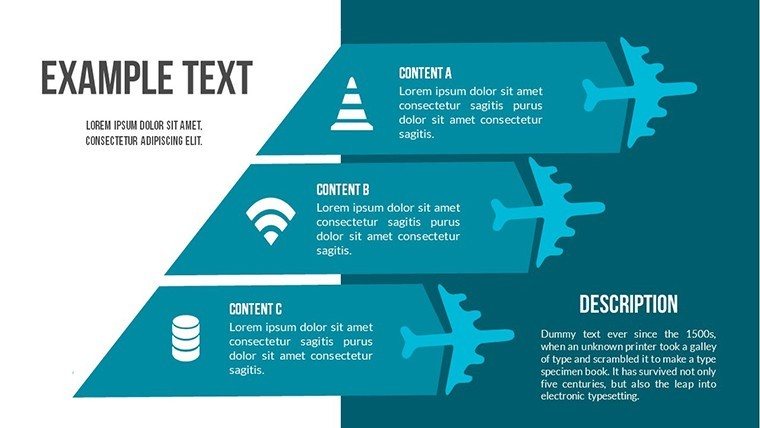
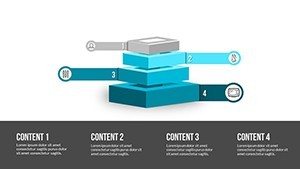
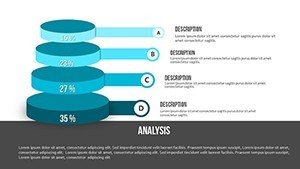
Diagram structure emphasizes key metrics.
Layout composition separates zones for clarity.
Color contrast segments opportunity phases.
This setup enables clear communication in strategy meetings.
This set integrates full commerce metrics unlike the isolated chart collections elsewhere.
Its vector style uses precise line weight for data emphasis rather than decorative fills.
It suits fiscal reports best because the chart type improves pattern recognition over similar options.
The single purchase covers all 14 editable slides with no separate free tier listed on page.
Key Specifications
Editing behaviors shape how commerce visuals respond.
Vectors scale without quality loss.
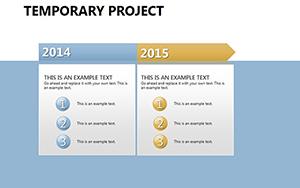
Text placeholders update across metrics.
Connectors follow data direction changes.
Exports cover editing and sharing needs.
| Feature | Details |
|---|---|
| Editable shapes | vector segments resize independently |
| Text placeholders | labels update without ungrouping |
| Color theme adjustments | slide master palette handles changes |
| Diagram connectors | adjustable in direction and weight |
| Icon layers | replaceable without layout impact |
| Export options | .pptx PDF supported |
These traits speed revisions.
Aspect ratio remains 16:9.
No animation support is noted.
Three Situations Where This Pays Off
Finance analysts in banking prepare fiscal reports by adjusting vector charts to new data sets.
Preparation time drops from 3 hours to 45 minutes.
Marketing teams in retail reuse the file for sales presentations.
Color schemes adapt across three campaigns.
Executives in commerce adapt diagrams for board briefings.
Project managers in logistics modify metrics for performance reviews.
The same slides support five quarterly updates.
Download the template and prepare your commerce analysis now.
From Download to Final Deck
Customization follows five steps for PPTX files.
Editing difficulty sits at moderate level.
- Open the .pptx file in PowerPoint (1 minute)
- Replace placeholder text (3 minutes)
- Adjust brand colors via slide master (2 minutes)
- Edit chart data and connectors (4 minutes)
- Export as PPTX or PDF (1 minute)
Total time stays under 20 minutes.
Vectors maintain quality during scaling.
Color theme adjustments propagate instantly.
The Cost of Not Using a Template
Manual creation demands two hours for moderate skill.
Vectors often lose alignment on projection.
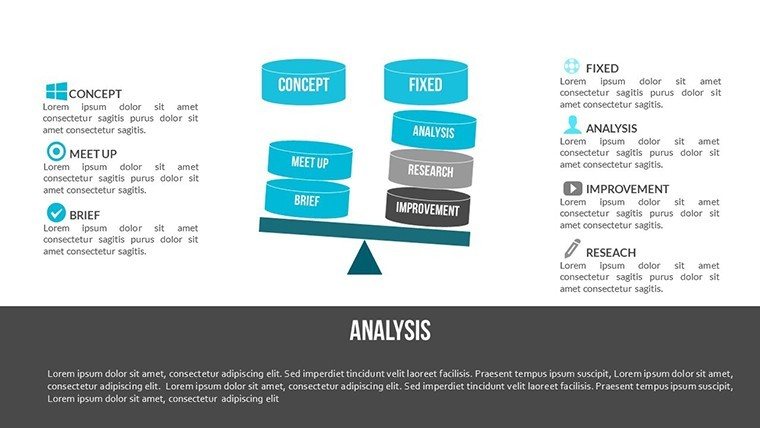
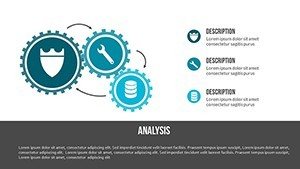
This design keeps elements layered for clarity.
Decision support improves without extra steps.
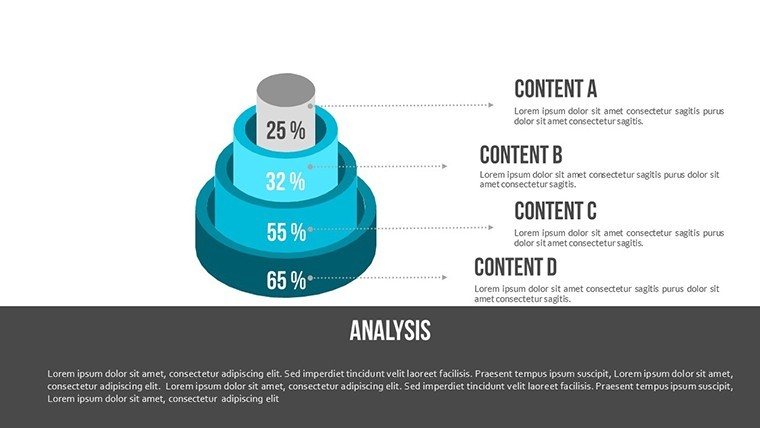
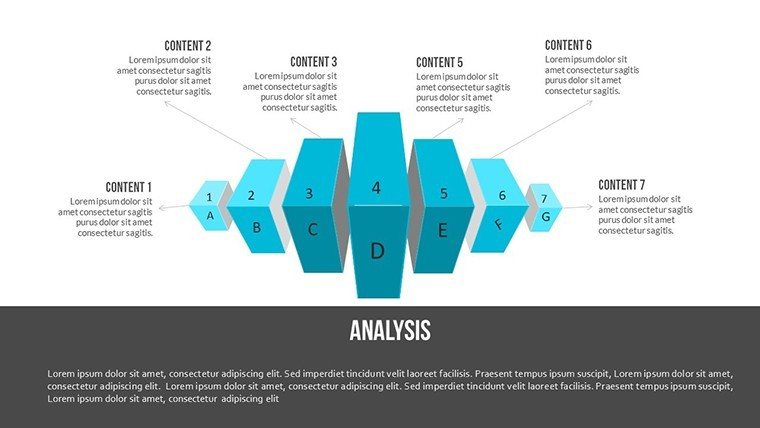
Visual hierarchy guides focus on trends.
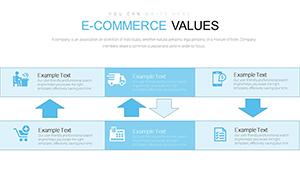
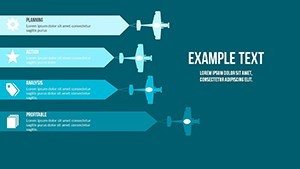
Zone segmentation clarifies opportunities.
Flow direction supports forecast narratives.
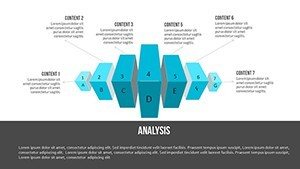
Teams avoid common data clutter issues.
Information spacing enhances readability.
Layout composition fits commerce standards.
Get the template and clarify your next report.
Which PowerPoint versions support this file?
The PPTX opens fully in PowerPoint 2016 2019 and Microsoft 365 on Windows and Mac.
Earlier versions may need conversion through online tools.
Slide master adjustments remain available in current releases.
Testing confirms no layout shifts across these editions.
How do I change the color scheme?
Open the slide master view in PowerPoint.
Select the color palette and update theme colors.
Changes apply to all vectors and text placeholders automatically.
Save the file and the new scheme appears on every slide.
What does the license allow for client work?
Use in internal company presentations and paid client projects is permitted.
Resale or sublicensing of the file itself is not allowed.
Modified versions may appear in client deliverables.
Keep the original file for your own records only.
What file formats are provided?
The download contains a single PPTX file.
No KEY or other formats appear listed.
Export to PDF happens directly from PowerPoint.
Editing stays within the native PPTX environment.
What is the refund policy?
Refunds are available within 14 days if the file fails to open in supported PowerPoint versions.
Contact support with details of the issue.
No refund applies after successful download and use.
The policy covers technical compatibility problems only.