Market Analysis PowerPoint Charts Template: Professional and Customizable


Type: PowerPoint Charts template
Category: Analysis
Sources Available: .key
Product ID: PC00400
Template incl.: 13 editable slides
Navigating the complexities of market dynamics requires more than raw data - it demands a narrative that captivates and convinces. Enter our Market Analysis PowerPoint Charts template, a powerhouse tool with over 30 editable slides tailored for dissecting trends, competitor landscapes, and consumer behaviors. Aimed at marketing gurus, business strategists, and entrepreneurs, this template turns exhaustive research into digestible visuals that drive decisions. Picture effortlessly illustrating a SWOT analysis with sleek infographics or forecasting sales with dynamic line graphs, all while aligning with industry best practices from sources like Harvard Business Review. Compatible with PowerPoint and Keynote, it's your shortcut to professional-grade presentations that not only inform but also influence boardroom outcomes. Whether pitching to investors or reviewing quarterly performance, these charts eliminate the drudgery of design, letting you focus on insights that matter.
Highlights of Advanced Market Visualization
In today's data-saturated business environment, clarity is king. This template embodies marketing visualization expertise, incorporating principles from data scientists who advocate for minimalism in design to maximize impact. Each slide is optimized for high-stakes scenarios, such as using funnel charts to map customer journeys or radar plots for competitive benchmarking. Benefits abound: studies from Nielsen show that visual data increases persuasion by up to 43%. By weaving in real-world examples, like analyzing e-commerce trends post-pandemic, you demonstrate trustworthiness. Unlike generic PowerPoint defaults that often look amateurish, our pre-designed elements ensure polish, with editable placeholders for seamless data import from tools like Google Analytics.
Customization for Brand Alignment
Tailor every aspect to your vision - swap color schemes to match corporate identities, resize graphs for emphasis, or add custom icons from our bonus library. For a consumer behavior study, insert pie charts segmented by demographics, drawing from Census Bureau data for authenticity. This level of personalization not only saves time but elevates your profile, positioning you as an authoritative voice in market research. Workflow tip: Start by outlining your key findings, then populate slides sequentially, using animations to build suspense in reveals.
Essential Features for Analysts
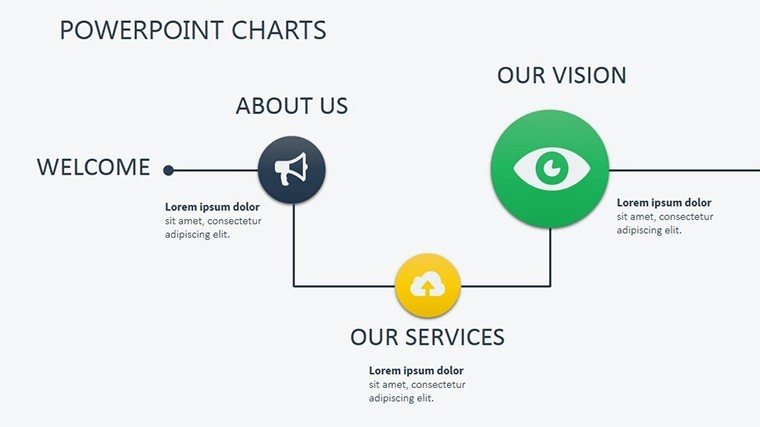
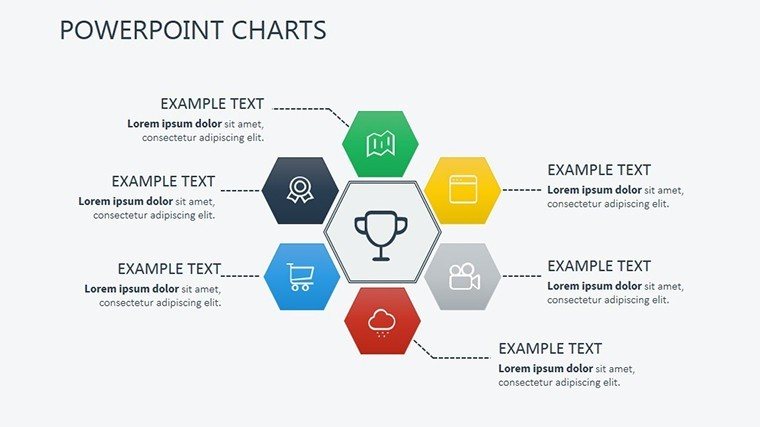
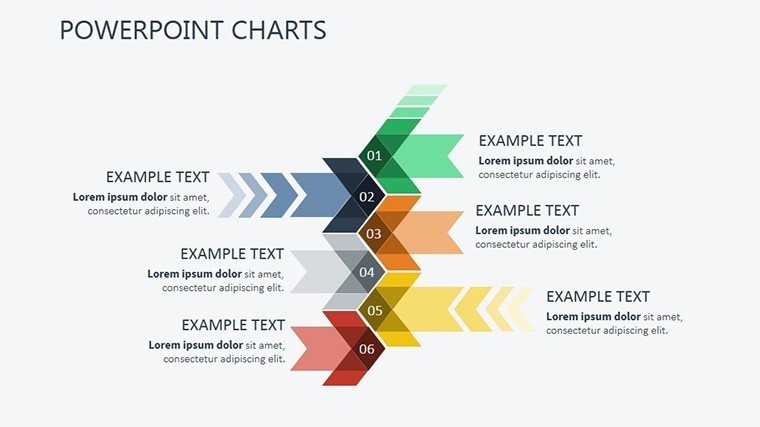
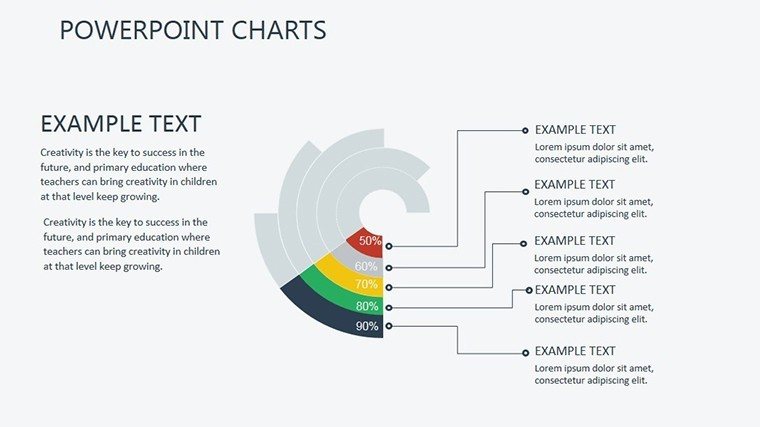
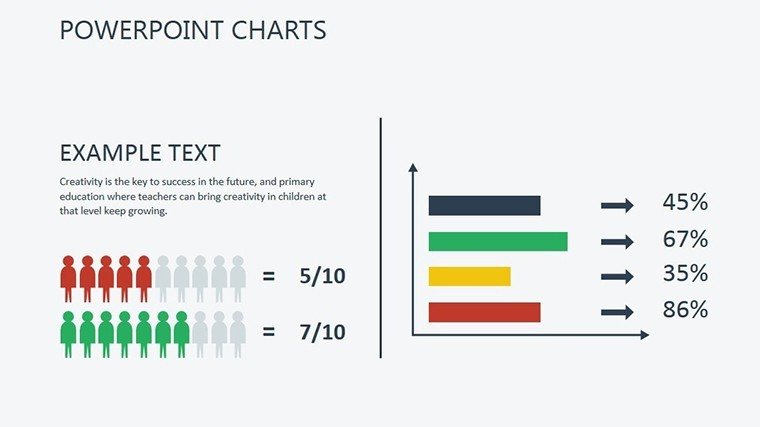
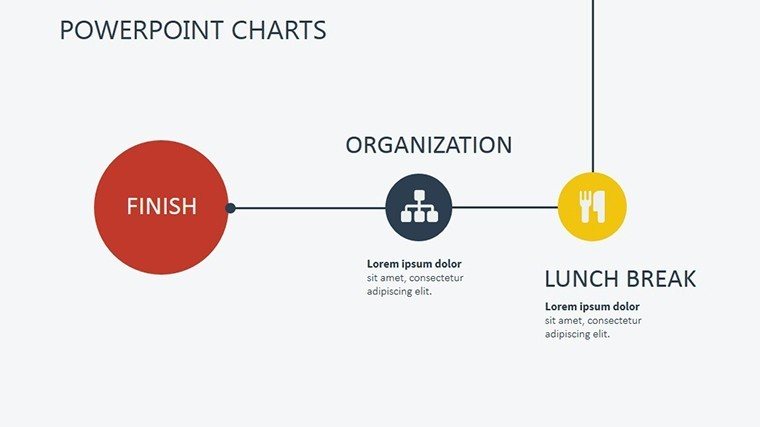
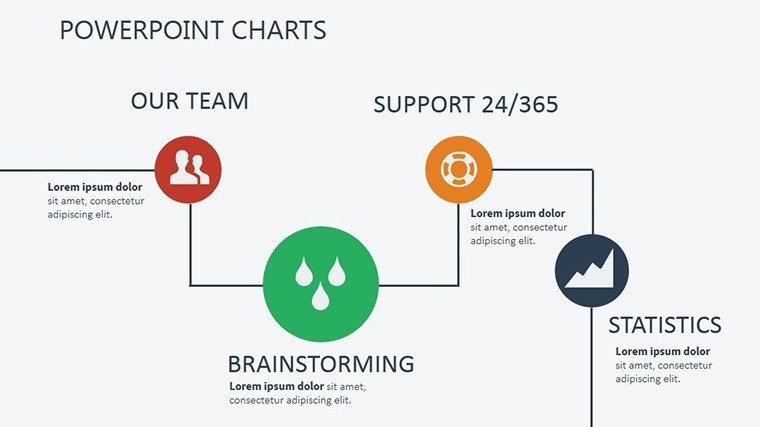
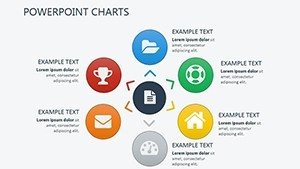
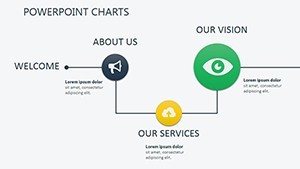
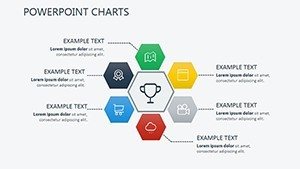
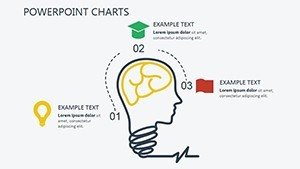
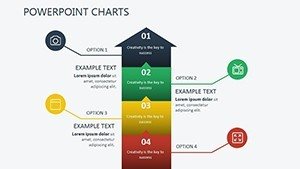
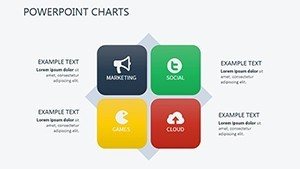
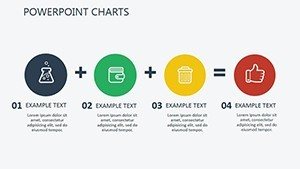
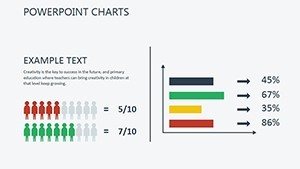
- Professional Design: Modern aesthetics that command attention, from clean bar graphs to intricate heat maps for market share analysis.
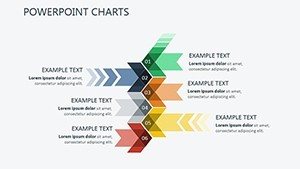
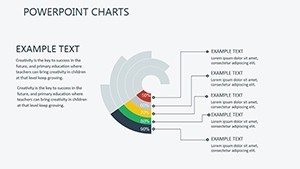
- Customizable Charts: Adapt bar, pie, line, and area formats to your datasets, ensuring precision in trend depictions.
- Data-Driven Elements: Integrate live data links where possible, keeping presentations current with market fluctuations.
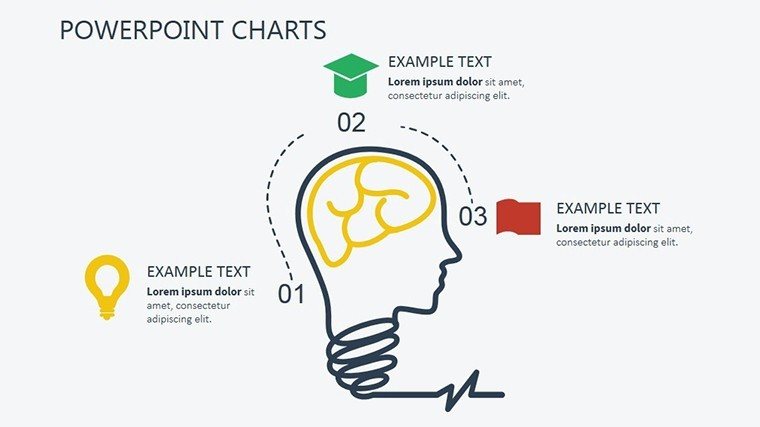
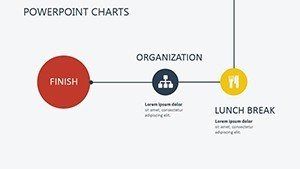
- Infographics and Bonuses: Highlight pain points with visuals, plus extra graphics for enhanced storytelling.
These features address common challenges, like data overload, by providing structured templates that guide your narrative flow.
Why This Template Transforms Your Workflow
Beyond basics, it solves real pain points: Time-strapped analysts can bypass hours of formatting, focusing instead on interpretation. For instance, in a competitive analysis, use clustered columns to compare metrics like market penetration, supported by case studies from firms like McKinsey. Versatility shines in applications from startup pitches to enterprise reports, always with an eye on user engagement through interactive elements.
Practical Use Cases with Steps
Consider a market entry strategy: Employ area graphs to show growth projections, backed by IMF forecasts. Step-by-step: 1) Collect competitor data; 2) Input into template; 3) Customize visuals; 4) Add annotations for context; 5) Present with confidence. Another: Consumer preference mapping via doughnut charts, ideal for product launches. Tips include using LSI like "competitive intelligence visuals" for internal optimization.
Secure Your Market Edge Now
Don't let subpar visuals undermine your expertise. Grab this Market Analysis template today and craft presentations that not only analyze but anticipate market shifts, propelling your career forward.
Frequently Asked Questions
- How many slides are fully editable?
- Over 30, each with customizable charts, text, and graphics for complete control.
- Does it work with Keynote?
- Yes, the .pptx format is compatible, with a .key source available for native editing.
- Can I add my own data easily?
- Absolutely - placeholders make integration straightforward from Excel or other sources.
- What makes it better than free templates?
- Professional designs, bonus elements, and data-driven focus ensure superior quality and engagement.
- Is support included?
- Basic instructions are provided; contact us for advanced customization queries.
- Suitable for beginners?
- Yes, intuitive layouts make it accessible while offering depth for pros.