Streamline Accounting PowerPoint Chart Template - 21 Slides


Type: PowerPoint Charts template
Category: Pie, Illustrations
Sources Available: .pptx
Product ID: PC00570
Template incl.: 21 editable slides
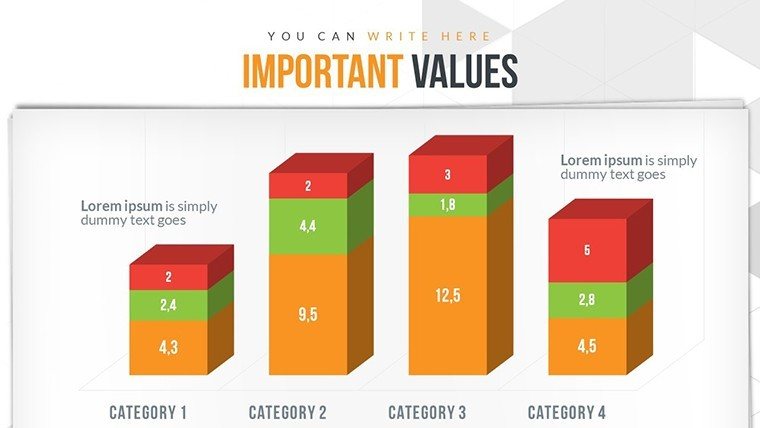
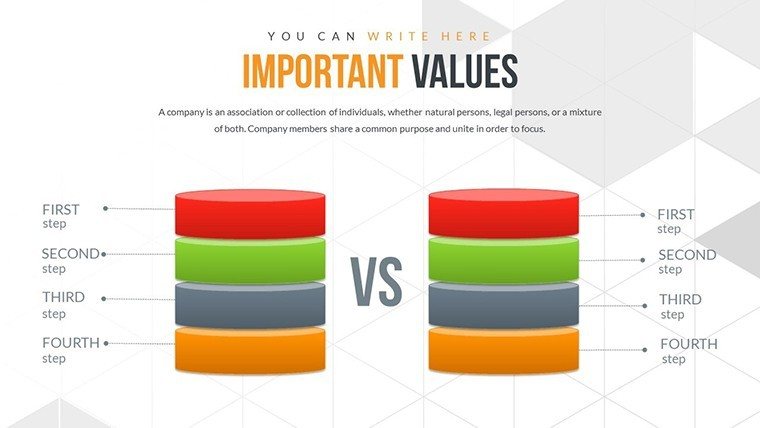
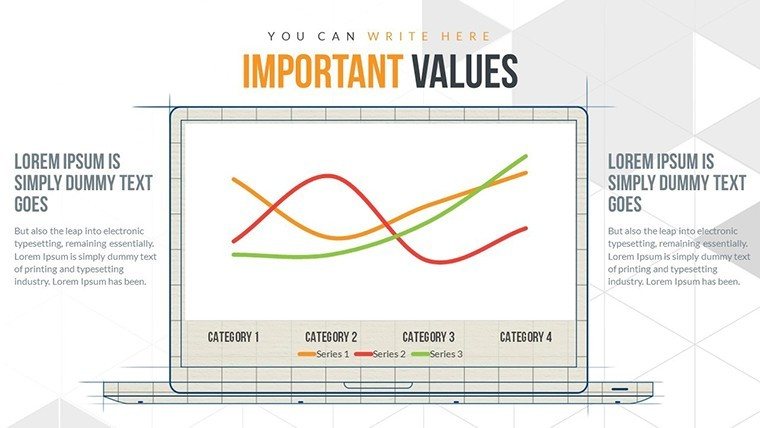
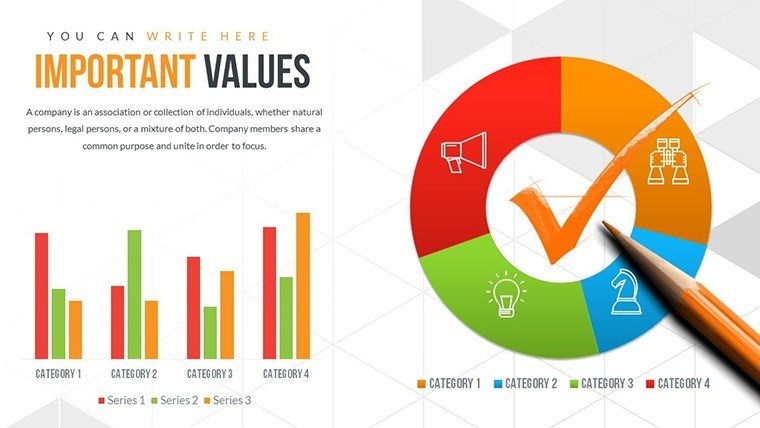
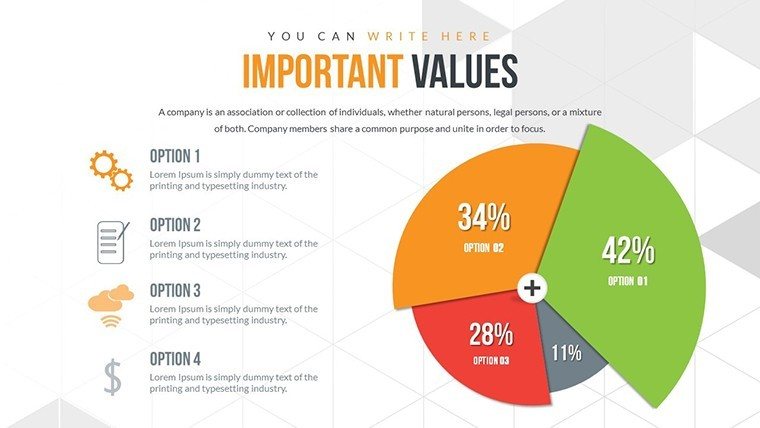
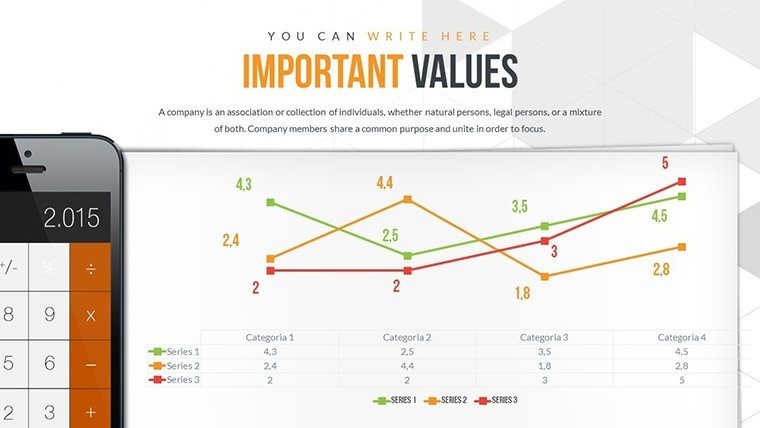
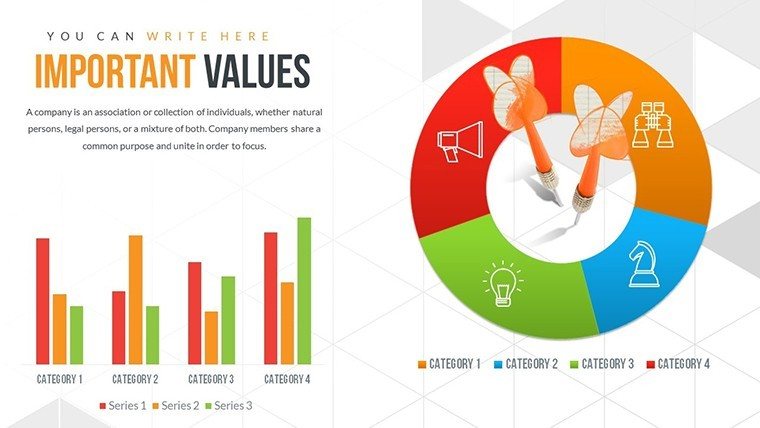
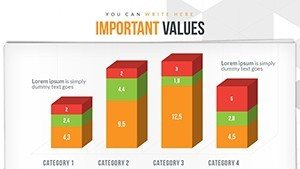
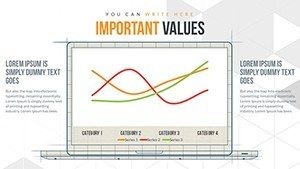
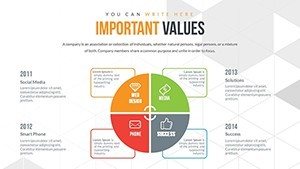
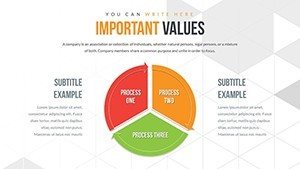
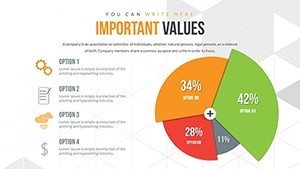
Financial management doesn't have to be a labyrinth of numbers; it can be a clear path illuminated by smart visuals. Our Streamline Accounting PowerPoint chart template delivers exactly that with 21 editable slides emphasizing pie charts and illustrative designs. Geared toward accountants, CFOs, and small business owners, it simplifies conveying budget allocations or revenue streams. Envision an architectural practice using pie charts to allocate project costs, aligning with precise reporting standards. This template's interactive elements and easy updates make it a game-changer, ensuring your audience grasps key insights without the fog of complexity, far surpassing traditional spreadsheets in engagement and clarity.
Revolutionize Financial Communication with Visual Precision
Drawing from accounting best practices, like those in GAAP, this template uses illustrations to make data relatable. Pie charts segment expenses intuitively, while interactive features allow for on-the-spot explorations, fostering better stakeholder dialogues.
Core Features for Efficient Accounting Visuals
- Interactive Data Points: Hover for details, enhancing understanding during reviews.
- Brand-Aligned Customization: Match colors and fonts to your firm's identity.
- Quick Update Mechanisms: Refresh data seamlessly for real-time accuracy.
- PowerPoint/Google Slides Compatibility: Versatile for any setup.
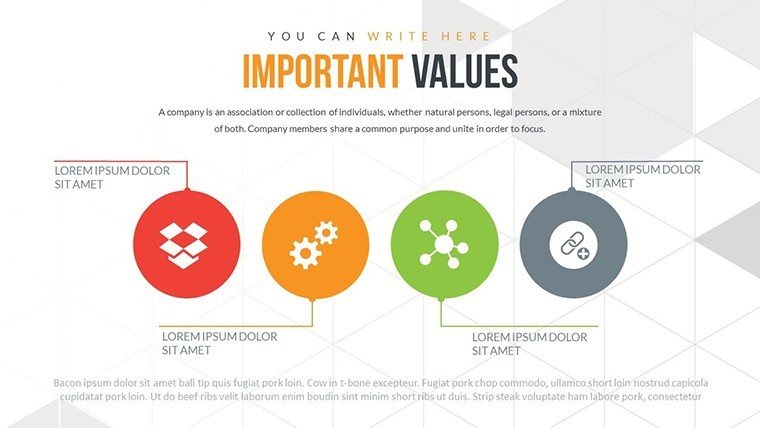
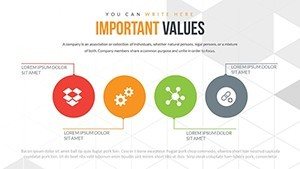
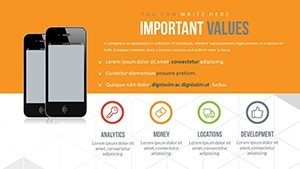
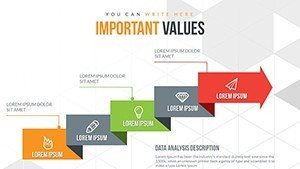
- Illustrative Enhancements: Visual metaphors that clarify financial narratives.
For large corporations, this means streamlined quarterly reports, as seen in cases where visual aids cut meeting times by 30%.
Diverse Use Cases in Financial Scenarios
From budget planning to audit preparations, this template fits. Small businesses can illustrate cash flows, while architects track design budgets via pies showing material vs. labor splits.
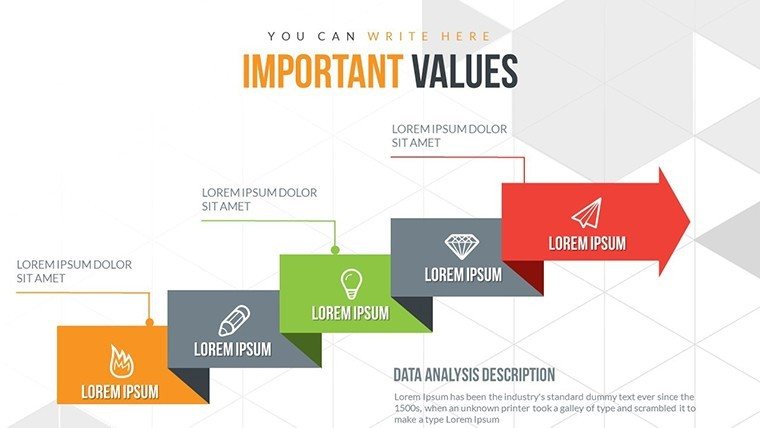
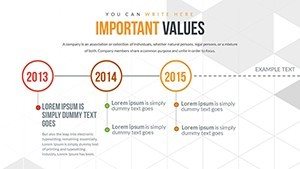
Step-by-step: Use initial slides (#1-5) for overview pies. Customize mid-slides (#10-15) with real data. End with interactive summaries (#16-21). This process aids decision-making, backed by studies showing visuals improve retention.
Actionable Tips for Financial Mastery
- Select relevant templates: Start with pre-built for consistency.
- Ensure data integrity: Update regularly for trustworthiness.
- Add annotations: Highlight anomalies for focus.
- Promote interactivity: Engage audiences actively.
- Include CTAs: Guide next steps clearly.
Unlike basic pies, these include illustrations for narrative depth, elevating from informative to influential.
Enhance Your Financial Narratives Today
Take control of your accounting visuals. Download this template to make finances accessible and actionable.
Frequently Asked Questions
How interactive are the charts?
They support hover details and manipulations for engaging presentations.
Easy to update with new data?
Yes, simple refreshes keep everything current.
Suitable for non-accountants?
Absolutely, simplifies complex info for all.
What illustrations are included?
Metaphorical visuals to enhance pie chart stories.
Can it handle large datasets?
Yes, scalable for corporate needs.