 Click to zoom
Technical Analysis PowerPoint Charts Template - Fully Editable & Instant Download
| Format | .pptx |
| Slides | 18 unique layouts |
| Aspect ratio | 16:9 |
| Compatibility | PowerPoint |
| Animated | No |
| Language | English |
| License | Commercial |
| File size | — |
| Version | v1.0 |
| Last updated | February 2026 |
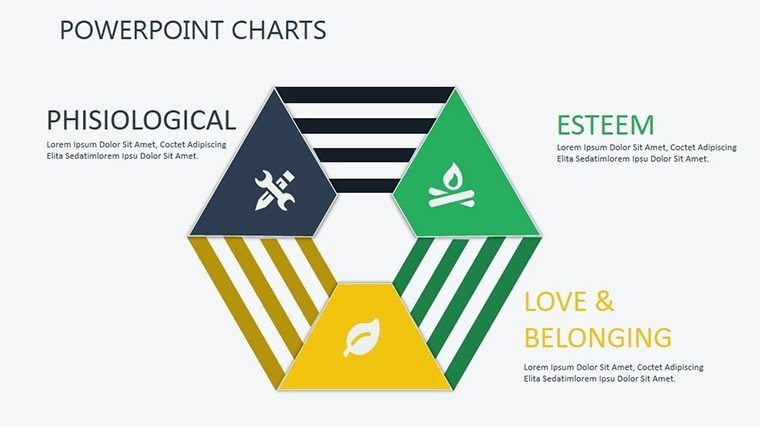
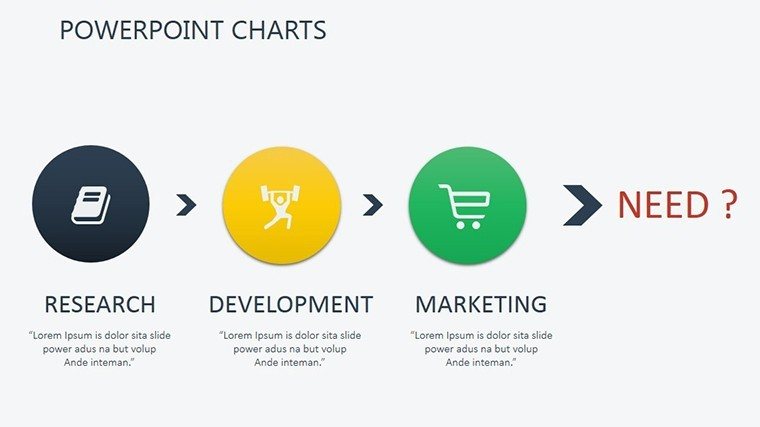
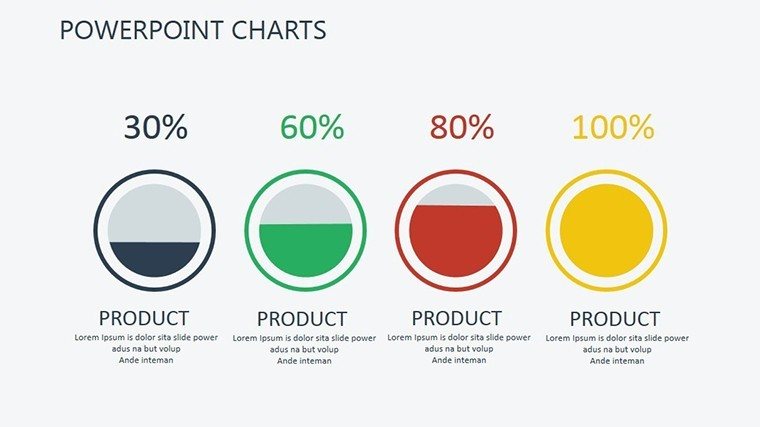
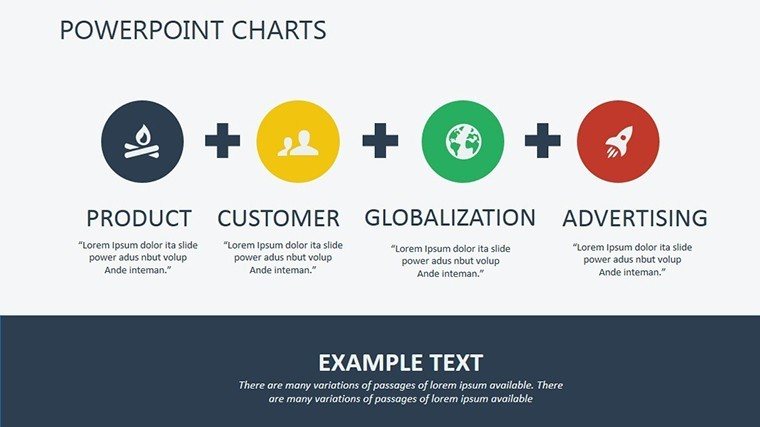
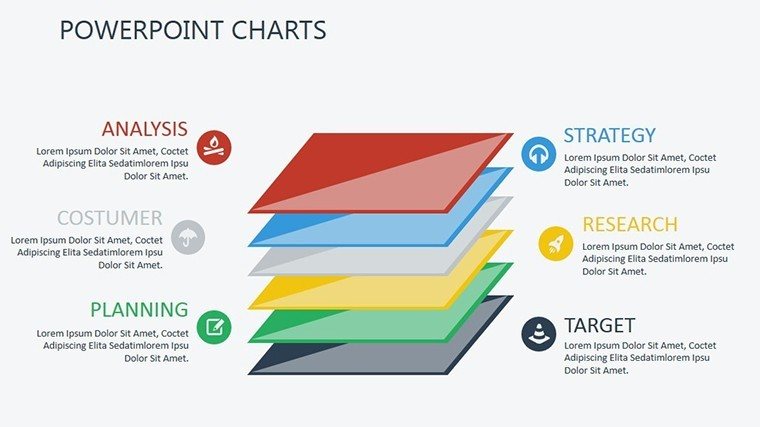
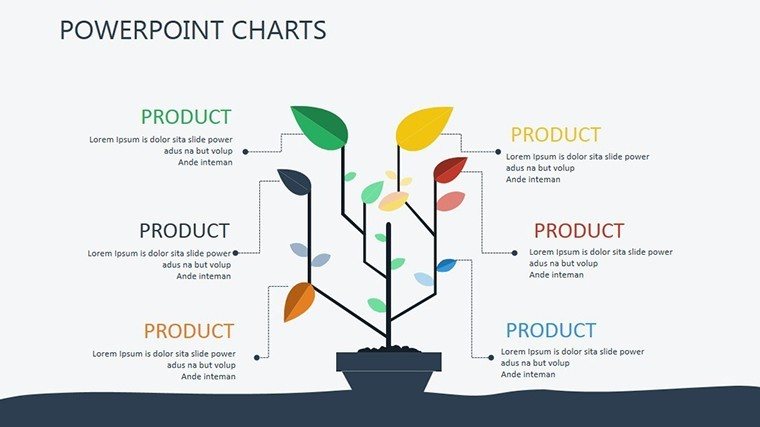
What's inside
In finance, presenting complex market data clearly can significantly influence decisions and outcomes. This Technical Analysis PowerPoint Charts Template offers ready-to-use slides specifically designed to visualize technical indicators and patterns with precision. Professionals rely on it to communicate insights effectively during high-stakes meetings or educational sessions.
Key Features
- 18 fully editable slides focused on technical analysis
- Professional layouts for candlestick charts, moving averages, and crossovers
- Easy customization of data, colors, and text
- Compatible with Microsoft PowerPoint
- Multiple aspect ratios supported
Why Choose This Template
Technical analysis requires visuals that highlight patterns without distraction. This template eliminates hours of design work, allowing focus on analysis and strategy. It ensures presentations remain professional and impactful in competitive environments.
Clear charts help stakeholders quickly understand trends and signals, leading to better-informed discussions. The editable nature means it adapts to various market contexts or branding needs.
How to Use the Template
After download, open the PPTX file in PowerPoint and replace placeholder data with your own figures. Adjust chart elements, colors, and labels to fit specific indicators. Add or remove slides as needed for your presentation flow. No advanced design skills are required.
Professional Scenarios
Traders use these charts to pitch trade ideas to clients or teams with visual support for entry and exit points.
Financial analysts incorporate them into market review reports for corporate leadership.
Educators leverage the slides to teach technical analysis concepts in workshops or courses.
Investment consultants present portfolio performance and market outlooks to advisory clients.
Ready to elevate your financial presentations? Download this template today and deliver clearer insights.
What types of technical charts are included?The template includes professional layouts for candlestick patterns, moving average crossovers, and other common technical indicators used in market analysis.
Is the template fully editable?Yes, all elements - including charts, text, colors, and data - are fully editable in Microsoft PowerPoint.
What file format will I receive?The template is delivered as a PPTX file, compatible with recent versions of Microsoft PowerPoint.
Can I use this for commercial presentations?Yes, the template is licensed for both personal and commercial use, including client pitches and internal reports.
How quickly can I start using it?After purchase, you receive an instant download link to access and edit the template immediately.
Good for
- Project roadmaps and sprint plans
- Product launch timelines
- Quarterly or annual review decks
- Company history and milestone summaries
Licence
reviews
I downloaded this for a startup pitch deck.
The comparison charts saved me a lot of formatting time.
A couple slides had too much going on visually.
The layouts were still practical though.
Worked well during screen sharing.
FAQ
Will it work in Google Slides?
Are fonts embedded?
Can I use this for client work?
What's the refund policy?
Do you update the template after purchase?
Similar templates
See all PowerPoint Charts →
All 18 slides