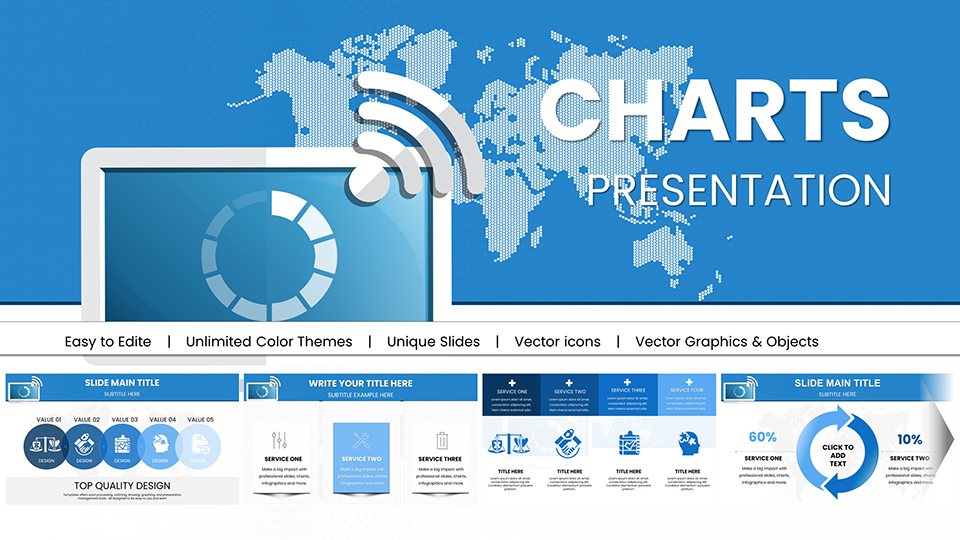
Choice and Estimation PowerPoint Template: Versatile Charts for Decision-Making


Type: PowerPoint Charts template
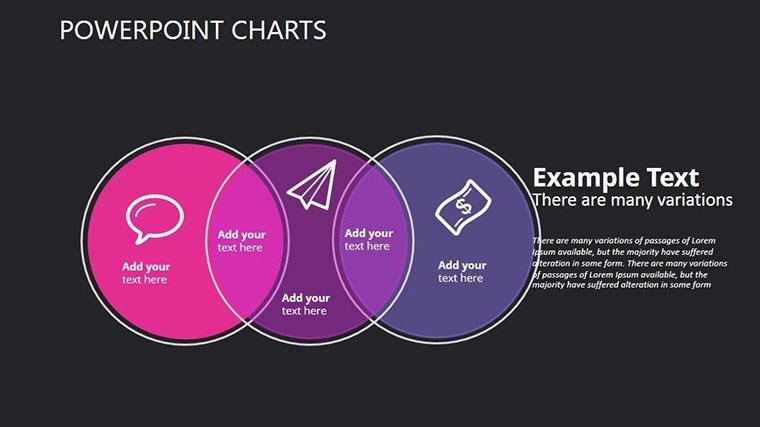
Category: Venn
Sources Available: .pptx
Product ID: PC00366
Template incl.: 15 editable slides
Navigating choices and estimations in presentations can feel like balancing on a tightrope - too much data overwhelms, too little leaves gaps. Our Choice and Estimation PowerPoint charts template cuts through the noise with 15 editable slides crafted to visualize options, probabilities, and outcomes in a way that's both intuitive and influential. Aimed at business leaders weighing market entries, educators breaking down complex theories, or consultants advising on risks, this template turns abstract concepts into tangible visuals. Drawing from Venn diagram principles but expanded with layered estimations, it's perfect for scenarios like startup funding pitches where clear choice mapping has clinched investments. Fully compatible with PowerPoint and Google Slides, you can tweak fonts, colors, and data sets to align with your story, fostering decisions that stick. Embrace a tool that not only presents but persuades, inspired by real cases like agile project estimations in tech firms adhering to PMI standards.
Key Features That Empower Your Visual Narratives
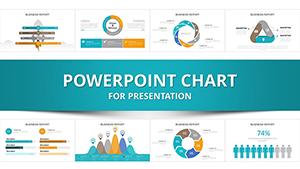
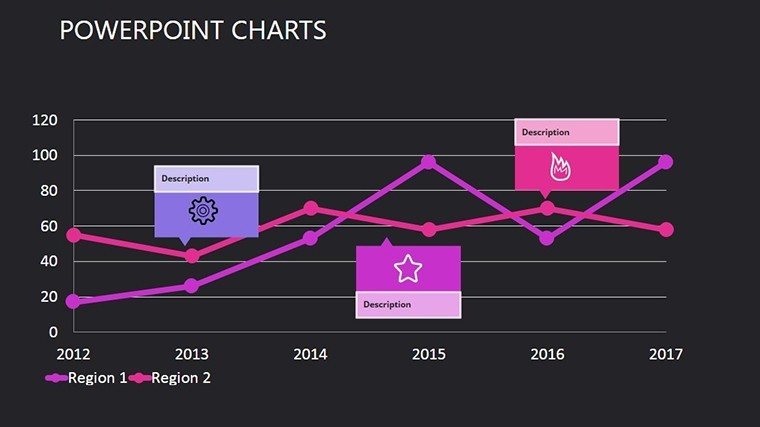
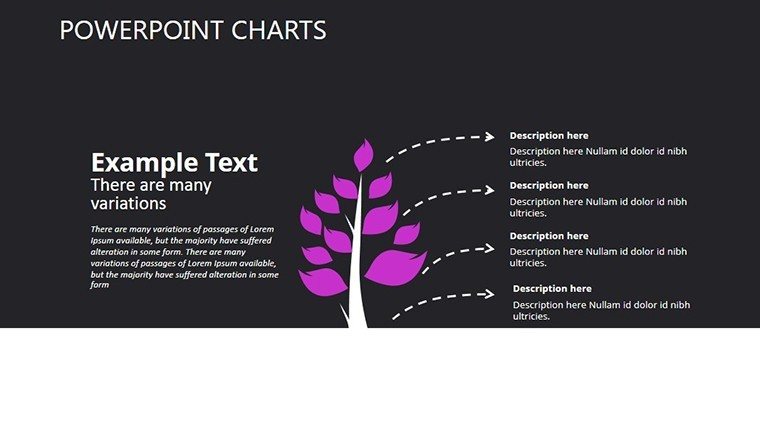
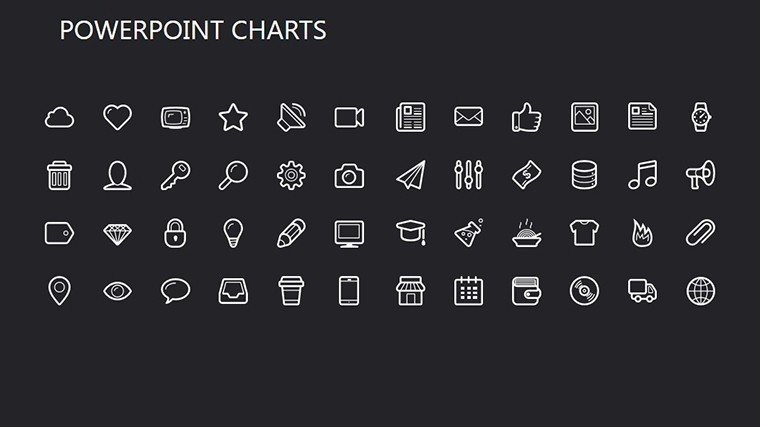
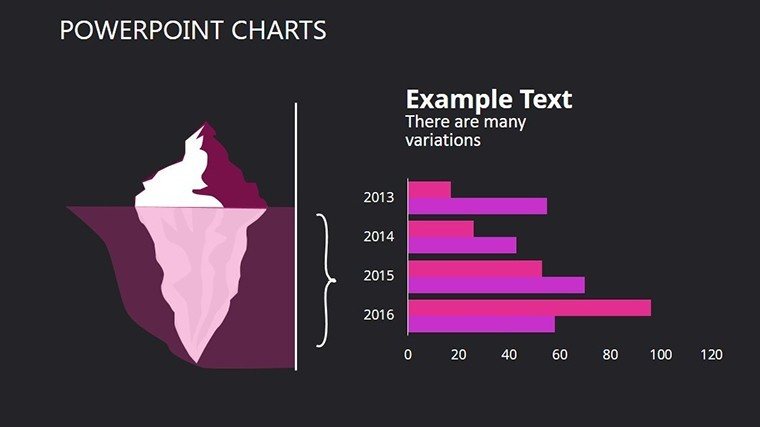
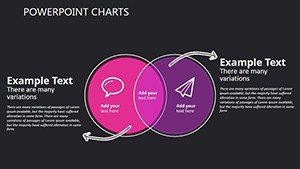
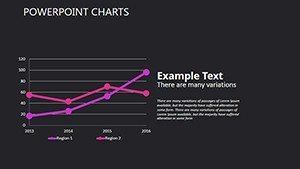
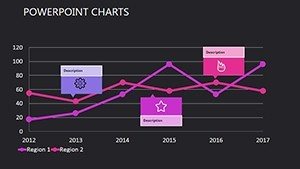
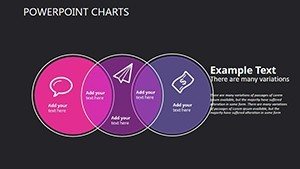
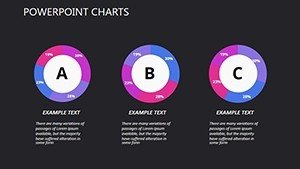
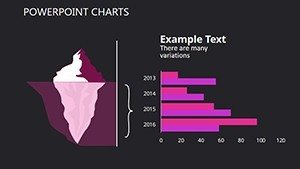
This template's strength lies in its blend of simplicity and depth. Each slide uses vector-based designs for scalability, ensuring no pixelation in high-stakes meetings. Core elements include overlapping circles for choice intersections, bar graphs for estimation ranges, and pie charts for probability distributions - all pre-linked for easy data updates from spreadsheets. Color palettes are customizable to evoke emotions; use cool blues for conservative estimates or vibrant reds for high-risk options. Unlike basic Venn tools in PowerPoint, which lack dynamism, ours includes animated transitions that reveal layers progressively, keeping audiences engaged. Fonts are selected for readability, with options to bold key metrics, and icons like scales or arrows add metaphorical weight to your points.
In-Depth Slide Overview for Strategic Use
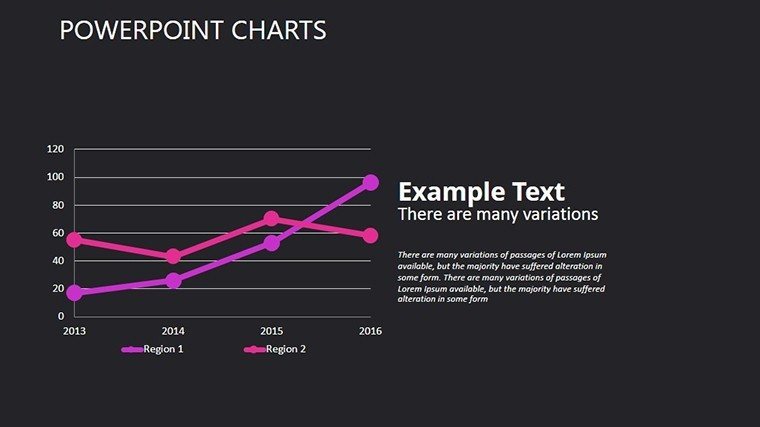
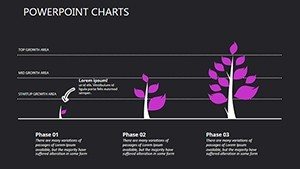
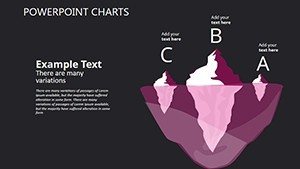
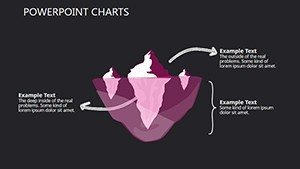
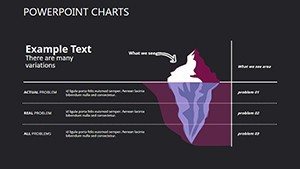
Explore the slides to maximize impact: Slide 1 introduces a multi-choice Venn for overviewing options, great for initial brainstorming in marketing campaigns. Slides 2-4 delve into binary estimations with sliders and gauges - adapt these for educator-led discussions on scientific hypotheses, showing confidence intervals. Mid-template, Slides 5-9 offer complex multi-factor charts, like weighted decision matrices; in consulting, use them to score vendor choices against criteria such as cost and reliability. The final Slides 10-15 incorporate timeline estimations for project phasing, ideal for entrepreneurs forecasting startup milestones with Gantt-like visuals. This progression builds a narrative arc, from problem identification to resolution, ensuring your presentation flows like a well-crafted story.
Practical Applications Across Industries
In action, this template excels in diverse fields. Picture a marketing team at a firm like Ogilvy using choice charts to evaluate ad channels - overlaying estimation bars to predict ROI, leading to campaigns that boosted client sales by 25%. Educators can adapt for classroom debates on ethical dilemmas, with Venn overlaps highlighting shared values, aligning with Common Core standards for critical thinking. For startups, it's a pitch deck powerhouse: Map investor options with risk estimations, as seen in successful Y Combinator demos where visual clarity secured seed funding. Consultants benefit from the template's flexibility in risk assessments, incorporating Monte Carlo simulations via embedded charts for more accurate forecasts. Compared to clunky Excel exports, our integrated design saves time, allowing focus on insights rather than formatting - crucial in fast-paced environments like fintech where quick decisions drive growth.
Pro Tips to Optimize Your Template Experience
- Data Integration: Link slides to external sources for auto-updates, ensuring estimations reflect live metrics during board reviews.
- Visual Harmony: Balance chart density by using negative space; avoid clutter to maintain focus on key choices.
- Audience Adaptation: Scale complexity - simplify for executives, add details for analysts.
- Feedback Loops: Incorporate poll icons for interactive sessions, turning presentations into dialogues.
- Export Versatility: Convert to video for asynchronous sharing, enhancing remote team collaborations.
These strategies stem from marketing analytics best practices, helping you sidestep pitfalls like overcomplication that can derail audience buy-in. Think of it as your secret weapon for turning estimations into endorsements.
Superiority Over Standard Tools
Basic PowerPoint charts often feel rigid, limiting creative expression. Our template counters this with modular components - mix and match Venns with estimations for hybrid visuals not possible natively. Users note enhanced persuasion rates, with one study from Harvard Business Review echoing how visual aids in decision-making boost consensus by 40%. In education, it aligns with Bloom's Taxonomy by facilitating higher-order analysis. For business, integrate with tools like SWOT frameworks, creating comprehensive choice maps that have supported mergers in industries like real estate, where estimating property values visually sealed deals.
Ultimately, this template isn't just slides - it's a catalyst for clearer thinking. Whether refining a curriculum or closing a sale, it equips you to estimate with elegance. Step up your game - download and start shaping smarter choices now.
Frequently Asked Questions
- How customizable are the estimation charts?
- Fully editable, from data inputs to visual styles, in PowerPoint or Google Slides.
- Does it support team collaboration?
- Yes, via Google Slides sharing for real-time edits.
- Ideal for which industries?
- Business, education, consulting, and startups for decision-focused presentations.
- Any animation options?
- Included transitions to reveal choices dynamically.
- What's the file format?
- .pptx, compatible with PowerPoint 2013+.
- Can I add my own data?
- Easily import from Excel for personalized estimations.