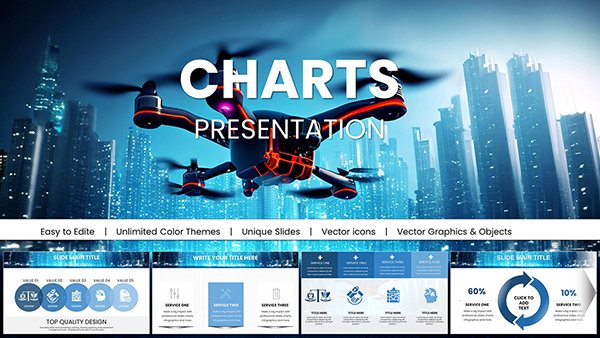
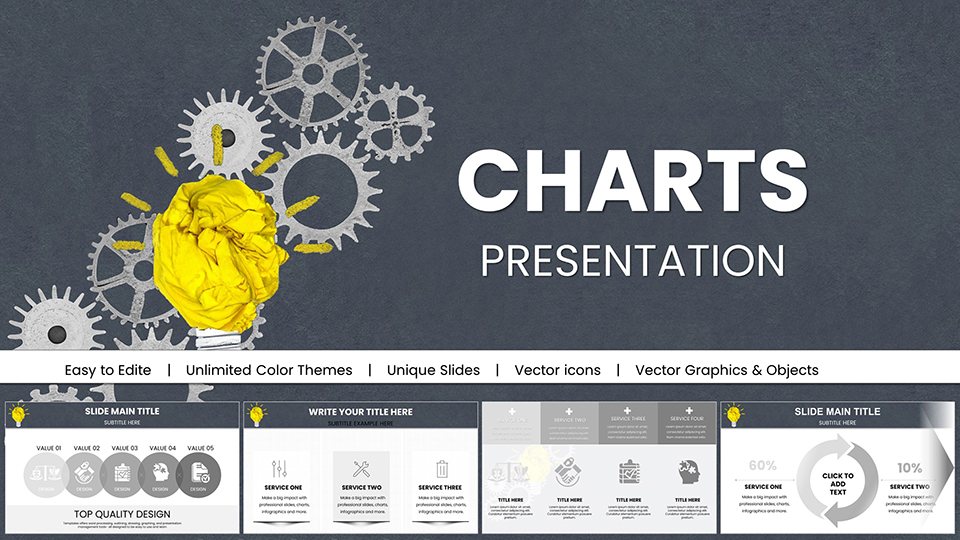
Marketing PowerPoint Charts: Fueling Strategic Storytelling


Type: PowerPoint Charts template
Category: Process, Business Models
Sources Available: .pptx
Product ID: PC01038
Template incl.: 57 editable slides
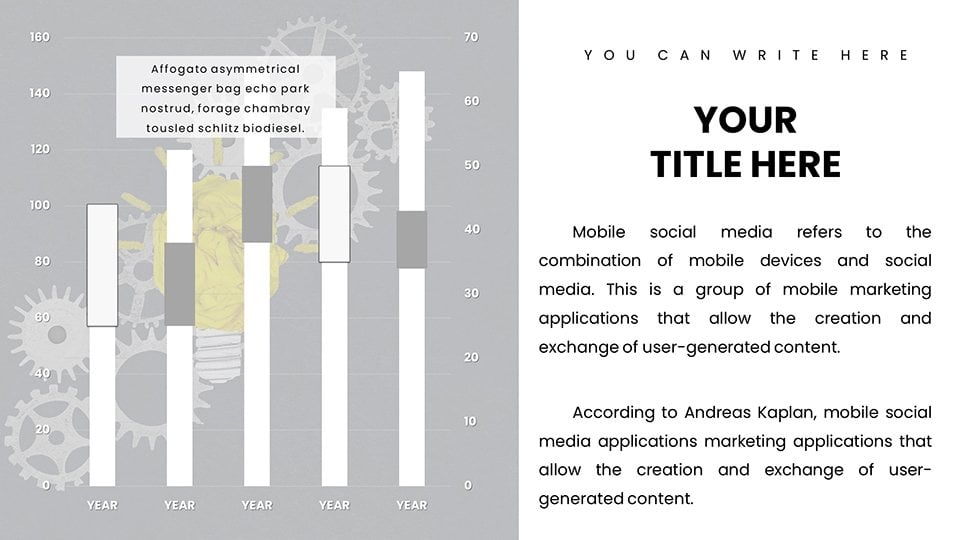
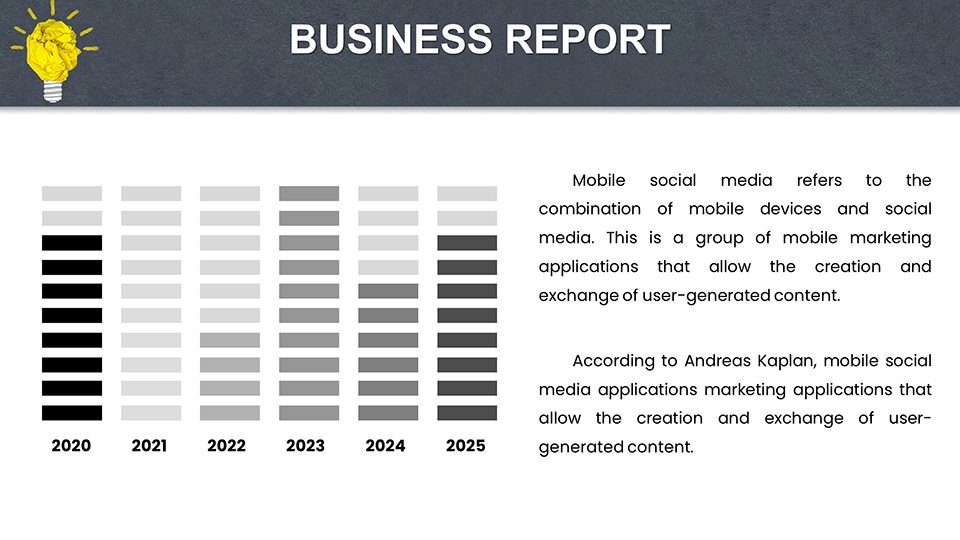
In the fast-paced marketing arena, where data drives decisions and stories sell, our PowerPoint charts template emerges as a game-changer. With 57 editable slides, it's crafted for marketers, executives, and entrepreneurs who need to transform metrics into memorable narratives. Picture funnel charts revealing customer journeys or heat maps spotlighting campaign hotspots. Drawing from frameworks like those in the American Marketing Association (AMA), this tool ensures your pitches reflect strategic depth. Overcome bland reports by infusing vibrancy, leading to higher engagement and conversions. Compatible across PowerPoint and Google Slides, it adapts to your pace, focusing efforts on creativity over creation.
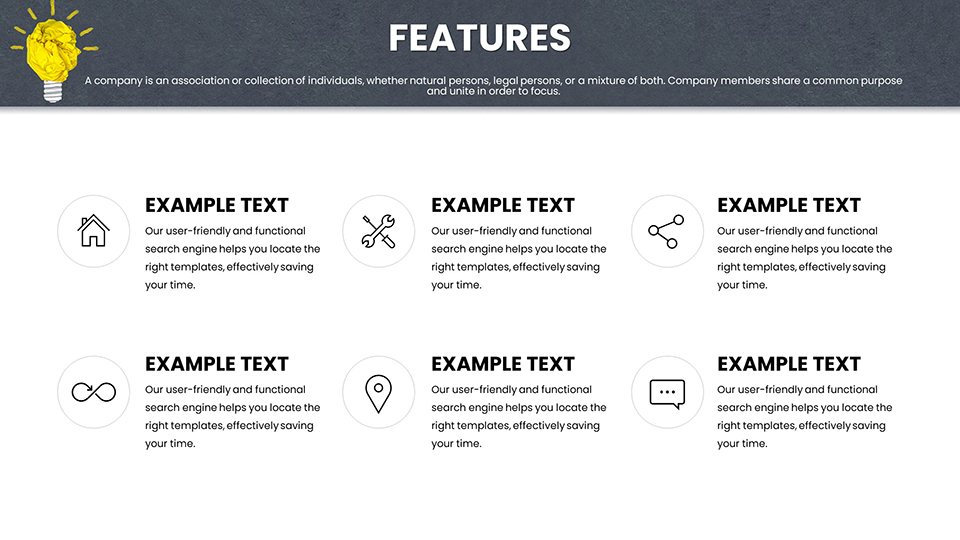
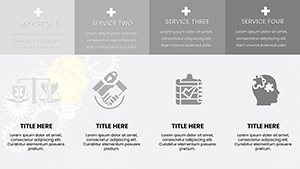
Strategic Features for Marketing Mastery
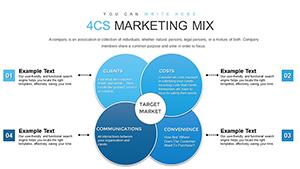
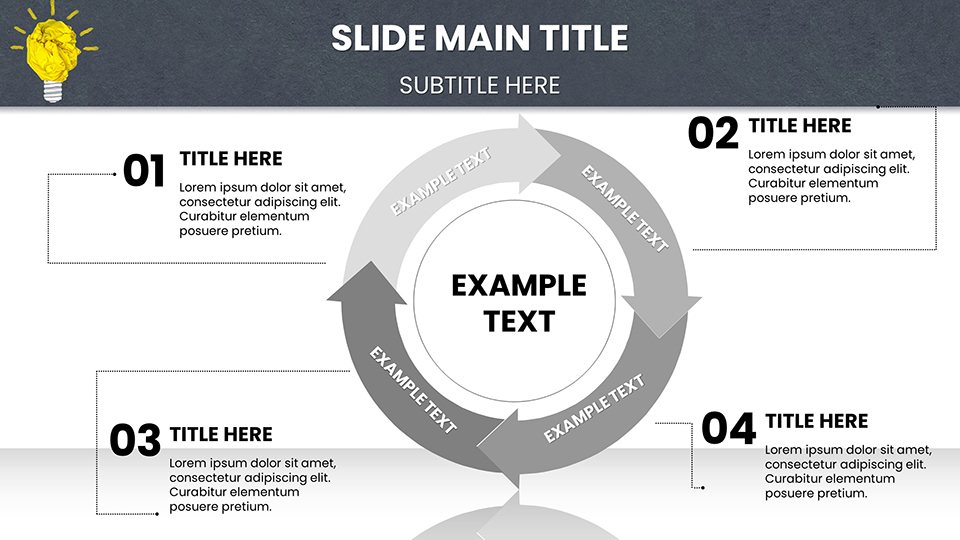
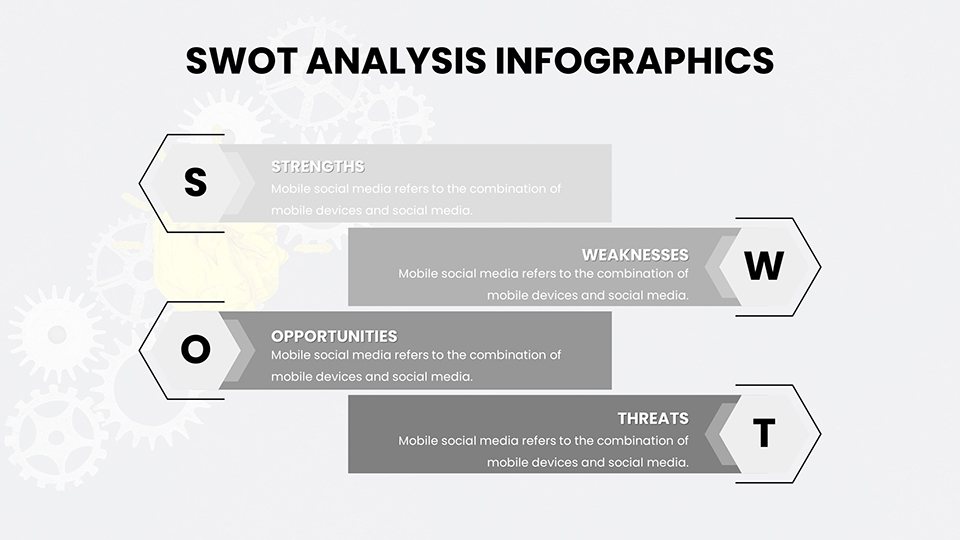
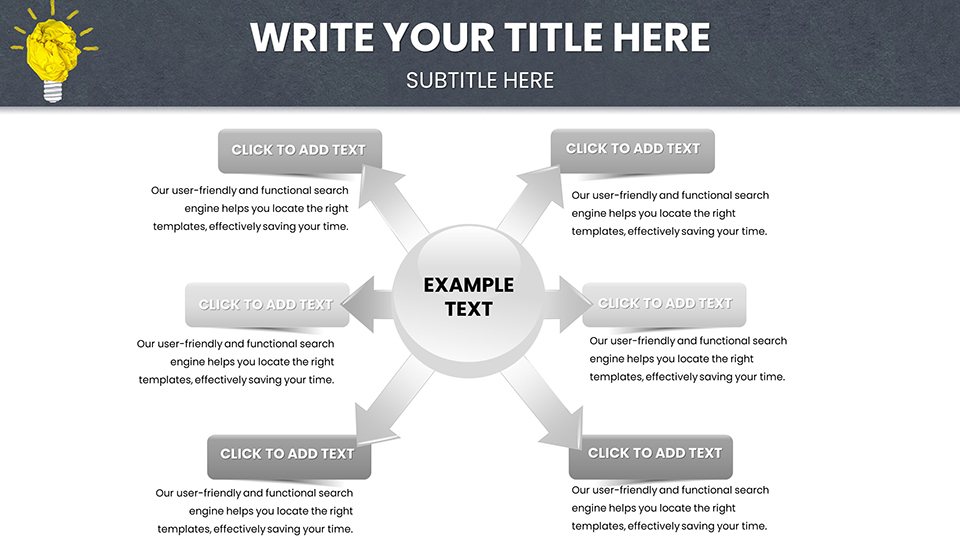
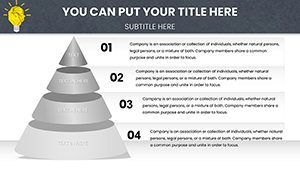
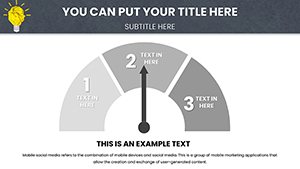
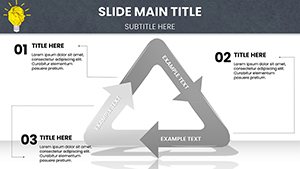
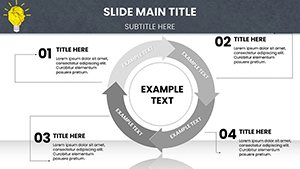
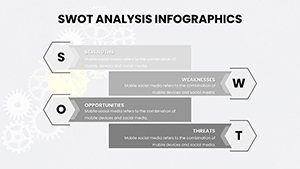
Key to this template are features honed for marketing demands. SWOT matrices with draggable elements facilitate quick analyses, while ROI calculators in slides provide instant computations. Benefits: Streamline client meetings with visuals that cut through noise, as AMA studies indicate story-driven data boosts persuasion by 30%. Distinct from vanilla options, these integrate LSI like conversion funnels and buyer personas naturally. For example, deploy donut charts for market share breakdowns, echoing successful campaigns from brands like Coca-Cola.
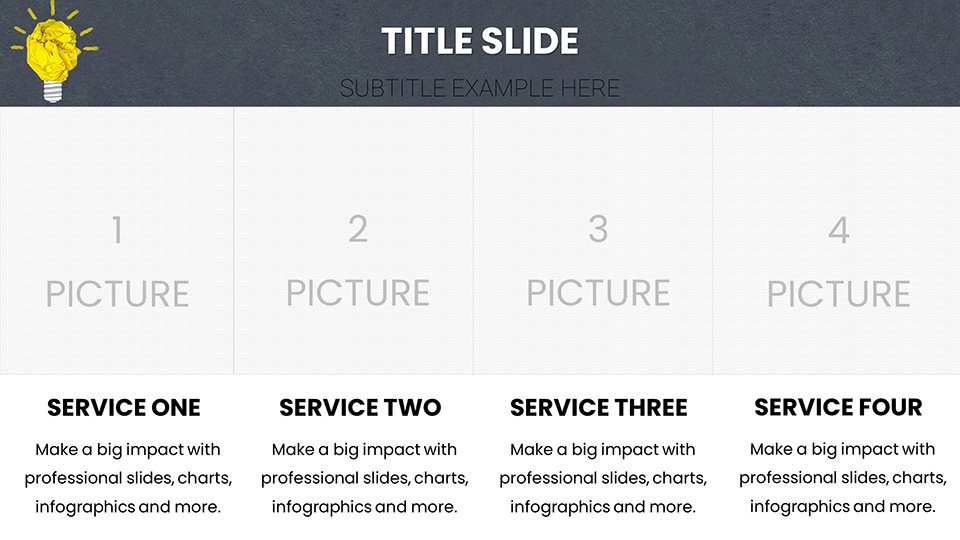
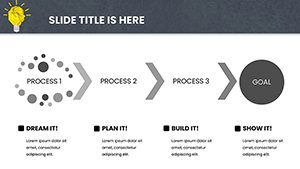
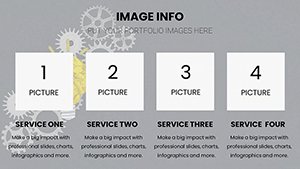
Standout Slide Components
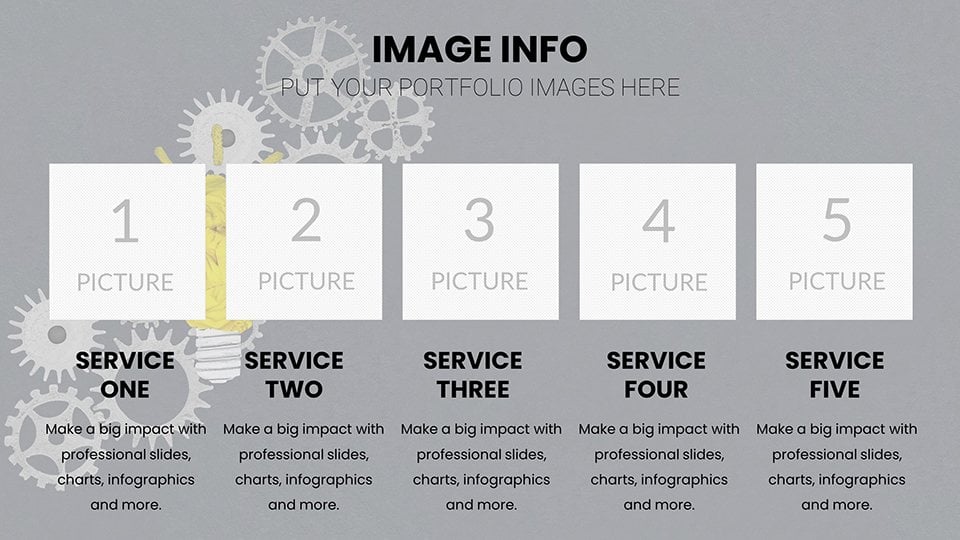
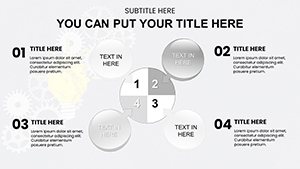
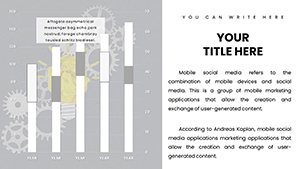
- Campaign Dashboards: Aggregated views for KPIs like CTR and bounce rates.
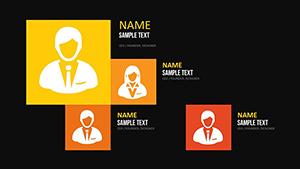
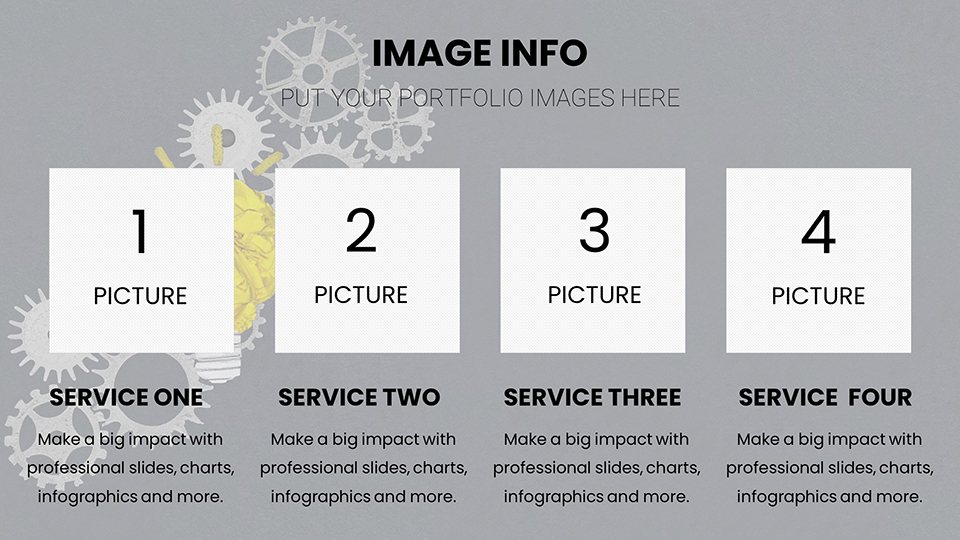
- Persona Profiles: Customizable slides for audience segmentation.
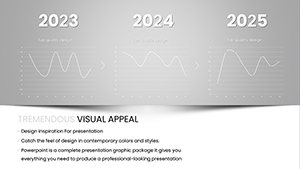
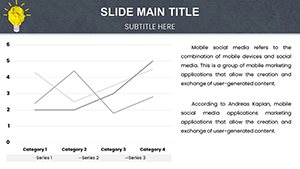
- Growth Curves: Line charts for trend forecasting.
- Competitor Maps: Bubble plots for positioning.
- Content Calendars: Timeline views for planning.
These embody marketing expertise, lending credibility to your deliverables.
Marketing Scenarios Brought to Life
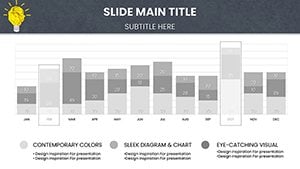
For a digital marketer, use stacked bars to show channel performance in reports. Startups can pitch with value proposition canvases, securing investments as seen in tech unicorns. Educators train on AIDA models via animated slides. A retail case utilized these for seasonal planning, lifting sales by 25%.
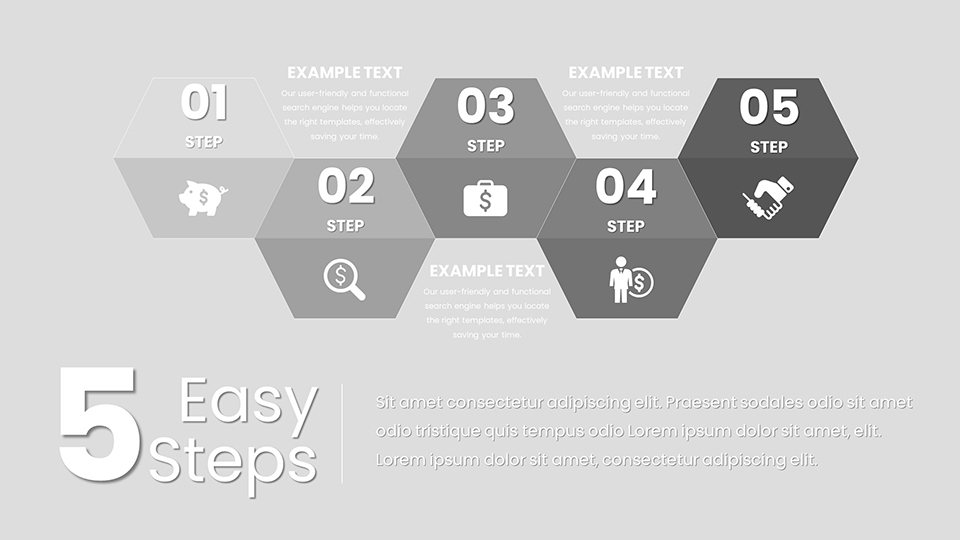
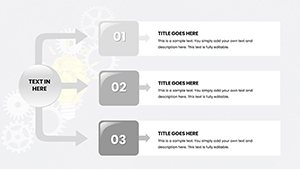
Optimization Guide
- Select a metric slide, input data from Google Analytics.
- Tweak visuals for brand alignment.
- Add interactive hyperlinks for deeper dives.
- Animate for emphasis on key stats.
- Test in presentation mode.
- Share collaboratively.
Sync with tools like HubSpot for live updates.
Elevating Your Marketing Game
This template turns data into dialogue, amplifying your strategies. Seize it today and market with momentum.
Frequently Asked Questions
- How flexible are the dashboards?
- Fully, with real-time data links.
- Supports digital marketing metrics?
- Yes, including SEO and social analytics.
- Brand customization easy?
- One-click themes apply.
- Any collaboration features?
- Cloud-compatible for teams.
- Guides for strategy use?
- Included marketing tips.