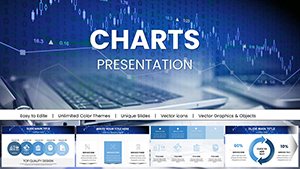
Comprehensive Marketing Strategies PowerPoint Charts: Data-Driven Mastery


Type: PowerPoint Charts template
Category: Business Models, Graphs
Sources Available: .pptx
Product ID: PC01026
Template incl.: 59 editable slides
Envision captivating your audience with razor-sharp visuals that dissect market trends and spotlight strategic wins. Our Comprehensive Marketing Strategies PowerPoint Charts template, with its 59 editable slides, is engineered for marketing mavens, business analysts, and entrepreneurs who demand precision in their narratives. This tool transforms raw analytics into persuasive stories, ideal for campaign reviews or investor briefings.
Grounded in methodologies from industry leaders like HubSpot and Gartner, these charts ensure your presentations exude expertise. Fully compatible with PowerPoint and Google Slides, they offer seamless edits, allowing you to adapt to evolving market data. Marketers using similar templates report 25% higher engagement, as per content marketing studies, by leveraging animations that reveal insights progressively.
The payoff is immense: streamline your workflow, focus on strategy over slides, and deliver pitches that convert. Let's unpack the features that position this template as your secret weapon in competitive landscapes.
Essential Features for Marketing Excellence
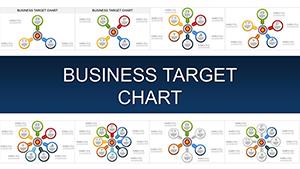
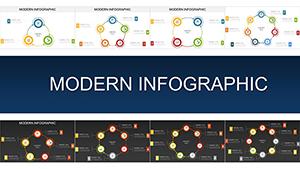
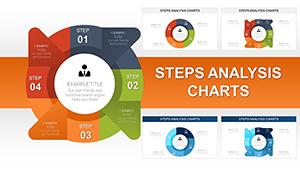
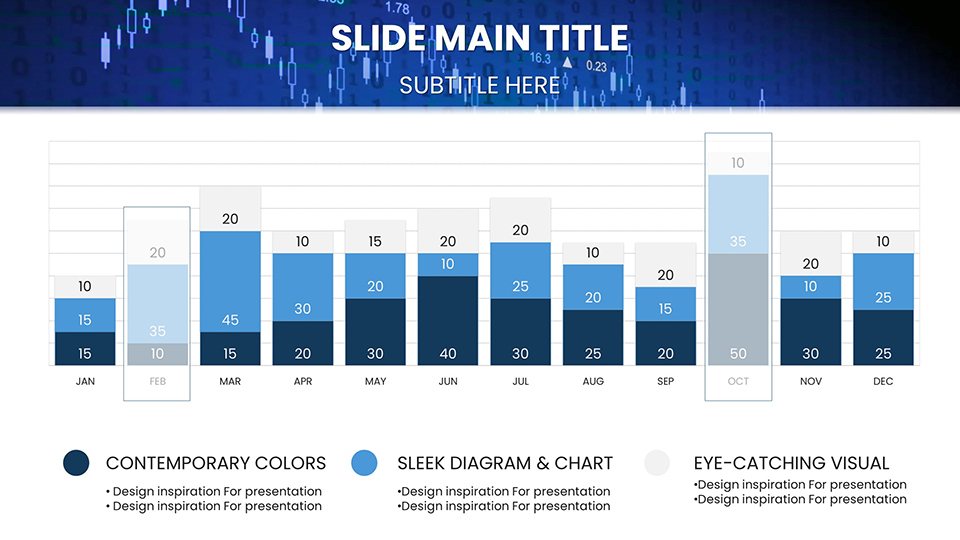
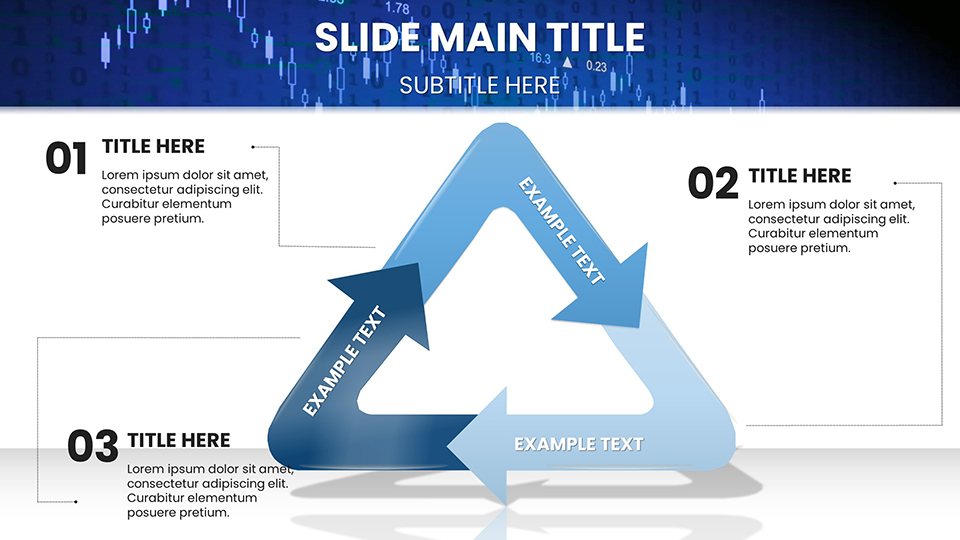
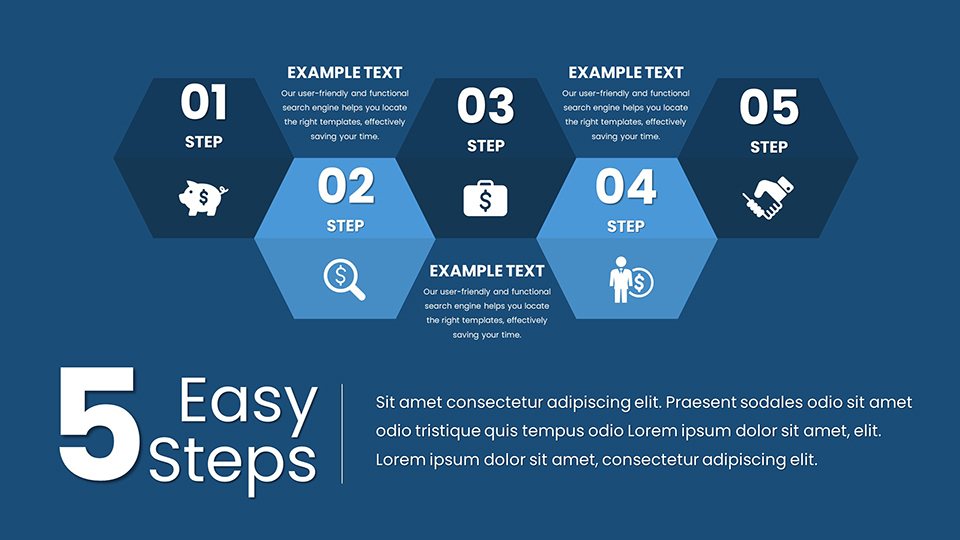
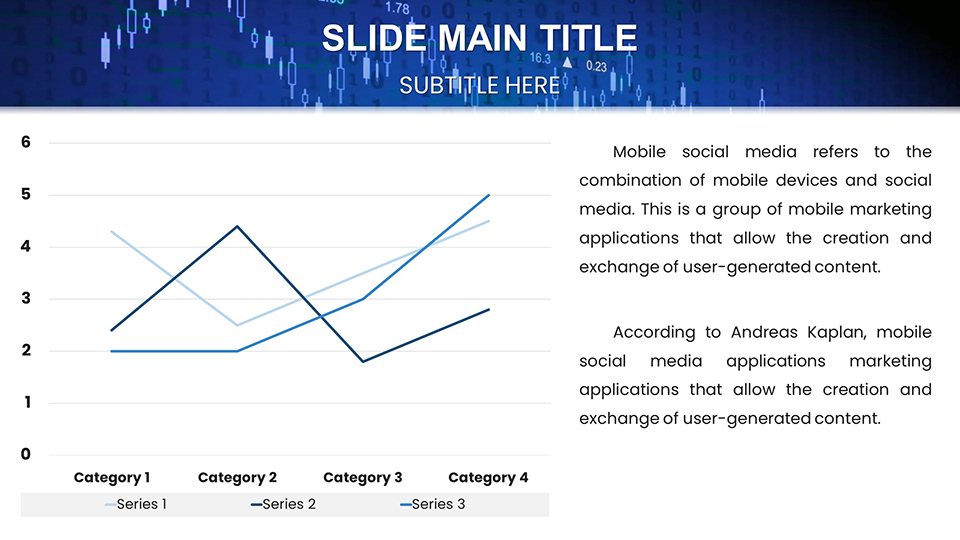
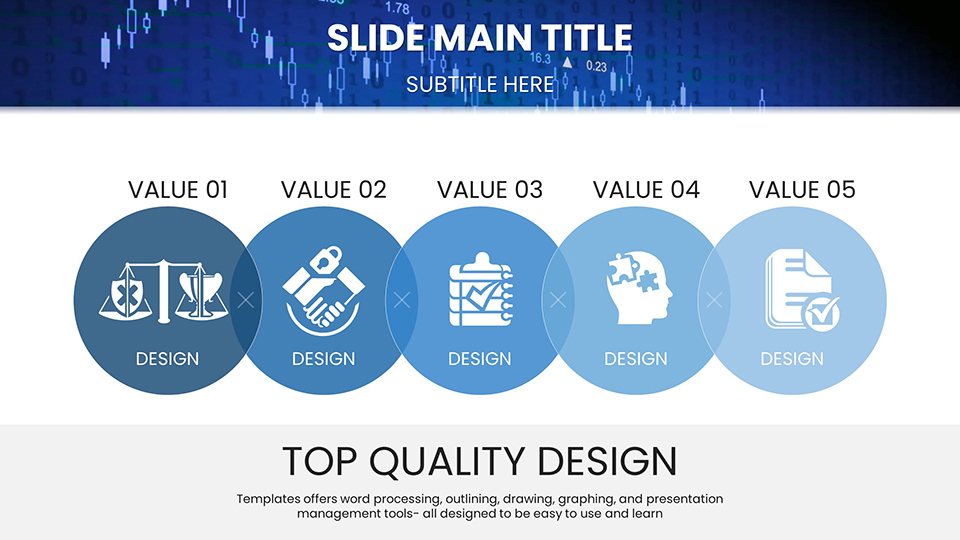
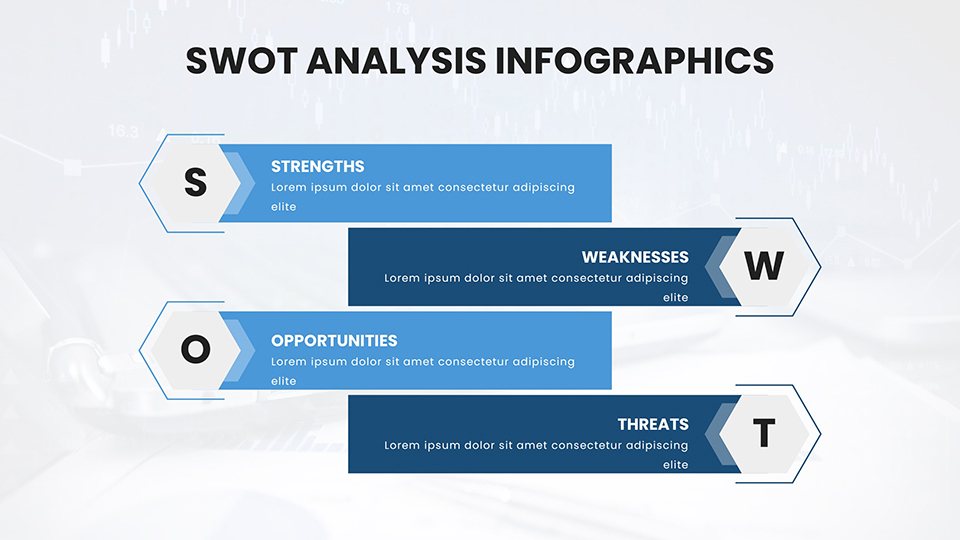
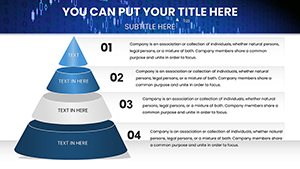
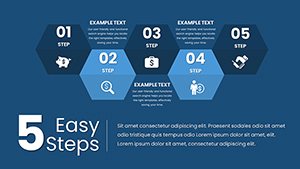
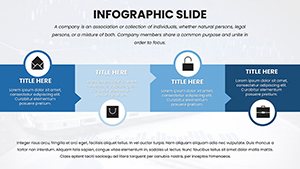
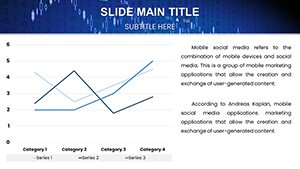
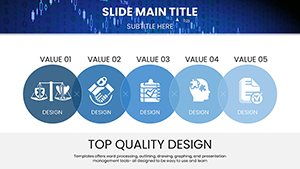
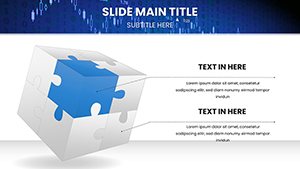
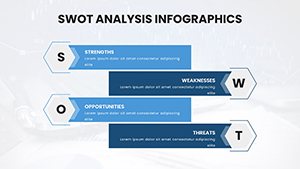
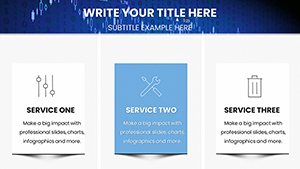
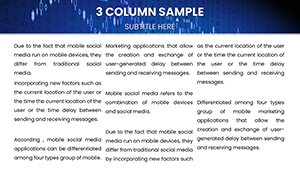
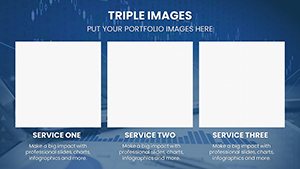
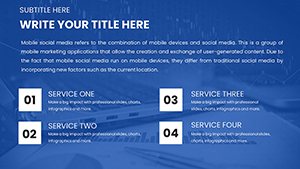
Delve into data-driven charts that visualize KPIs like ROI and customer acquisition costs. Variety abounds with designs for SWOT analyses, funnel visualizations, and trend forecasts, all customizable to fit your brand's voice.
Engaging animations bring static data to life, while the intuitive interface simplifies complex customizations, outpacing basic PowerPoint capabilities.
Detailed Customization Toolkit
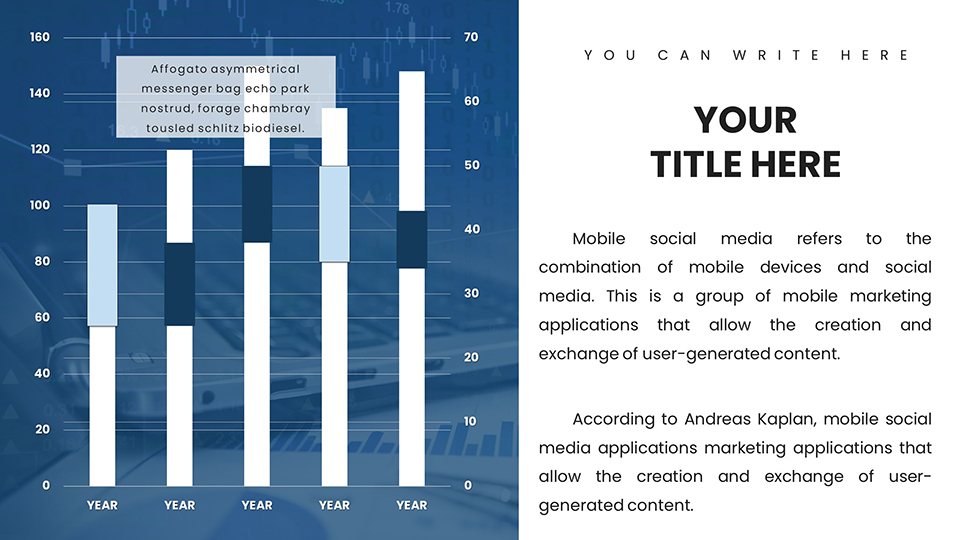
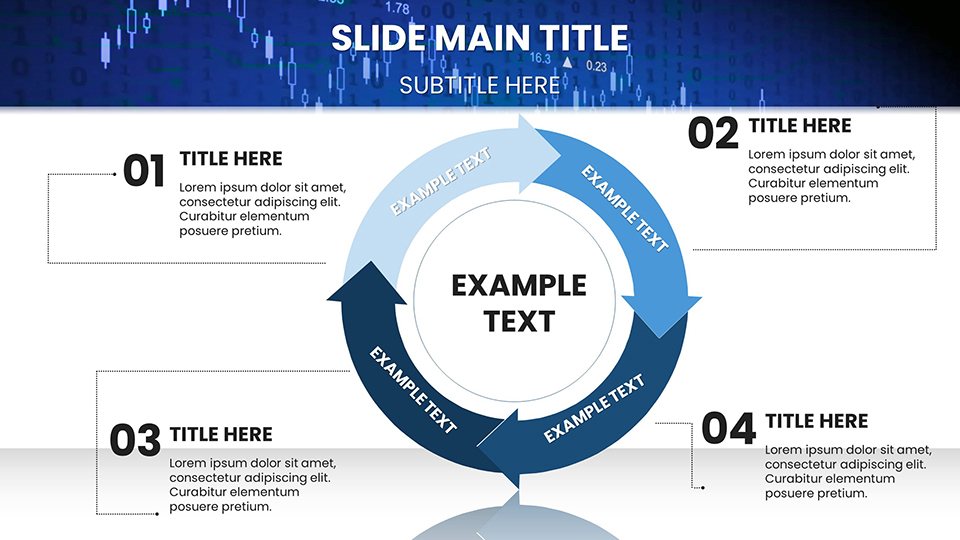
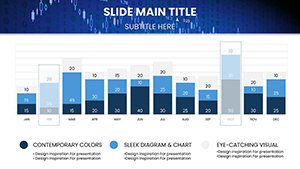
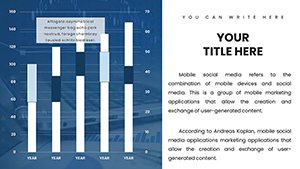
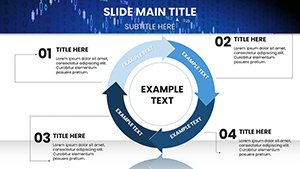
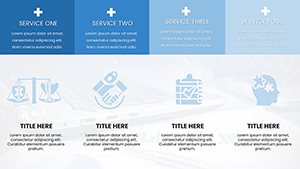
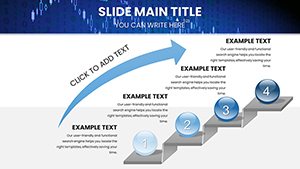
- Analytics-Focused Charts: Bar and line graphs for performance metrics, inspired by real campaigns like those from Coca-Cola.
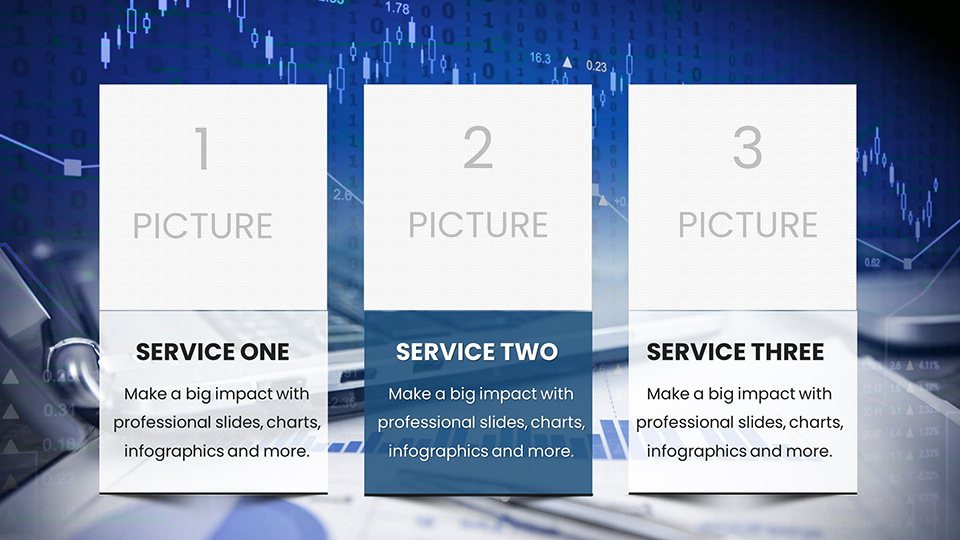
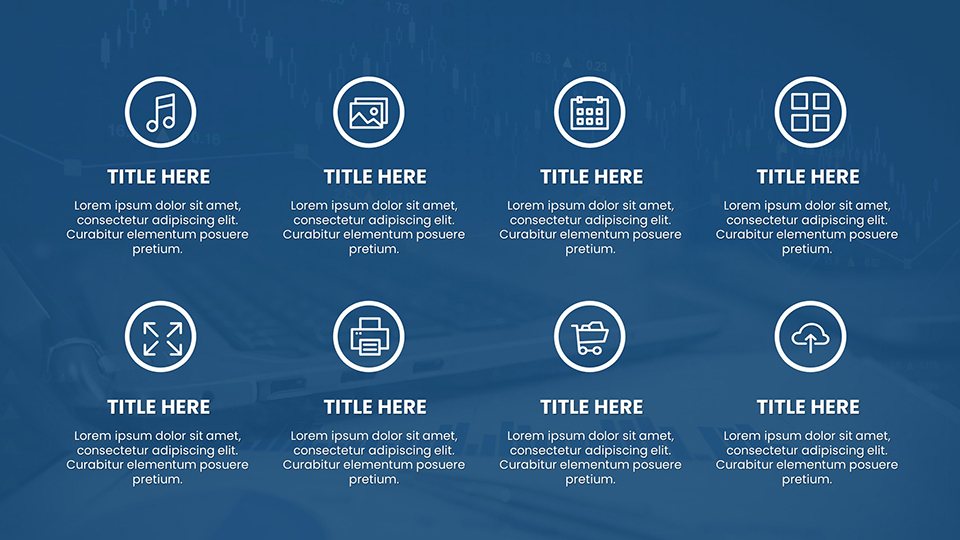
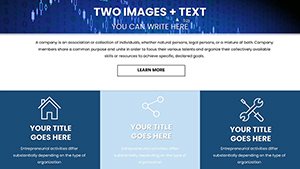
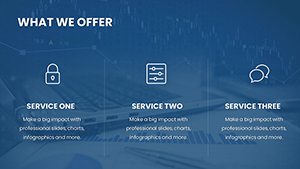
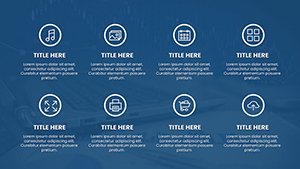
- Design Diversity: Options for every marketing facet, from digital to traditional strategies.
- Animation Enhancements: Smooth transitions that guide audience focus.
- Brand Alignment: Edit colors, fonts, and layouts for cohesive branding.
- Ease of Use: Quick edits that save hours in preparation.
These draw from best practices in digital marketing, ensuring authoritative delivery.
Target Users and Their Gains
Marketing professionals craft compelling campaign analyses, analysts decode data for actionable insights, and educators teach strategies with vivid examples.
Students and startups benefit from investor-ready visuals, mirroring successful pitches in Shark Tank episodes.
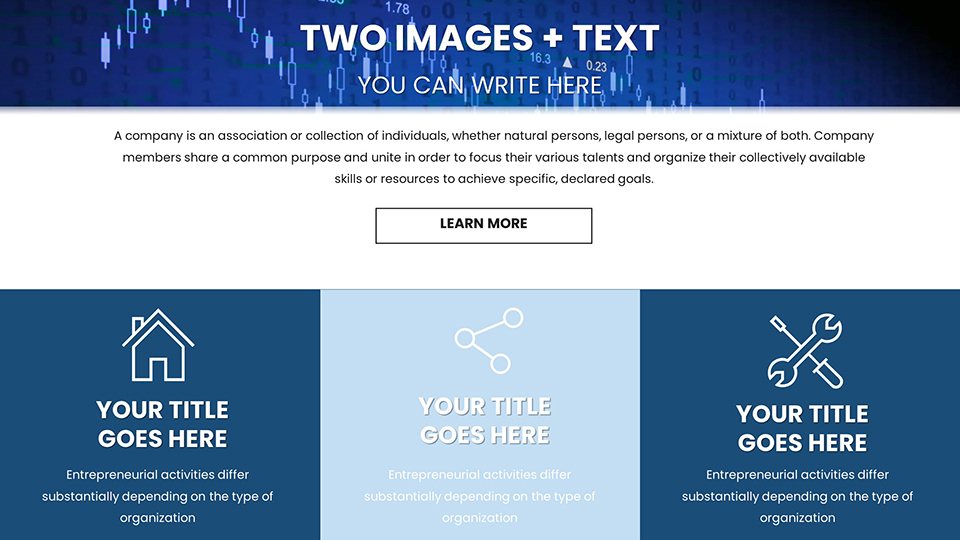
Application Examples in Action
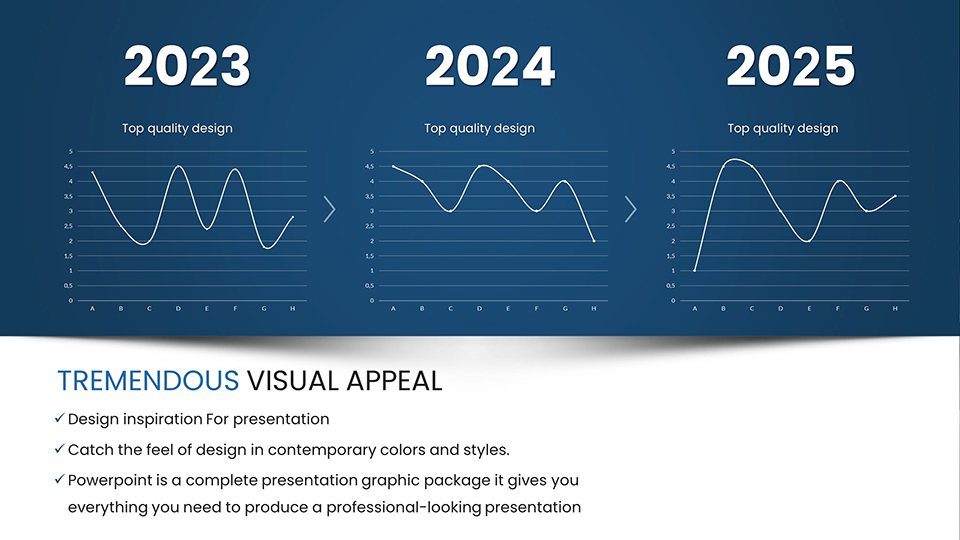
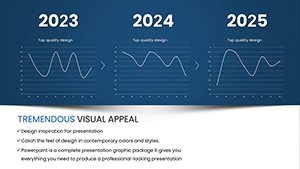
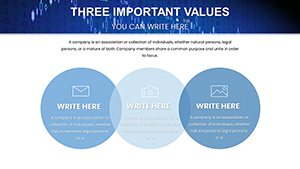
For market research, use pie charts to segment audiences, boosting strategy precision. In lectures, animate growth curves to illustrate concepts, enhancing learning as per educational research.
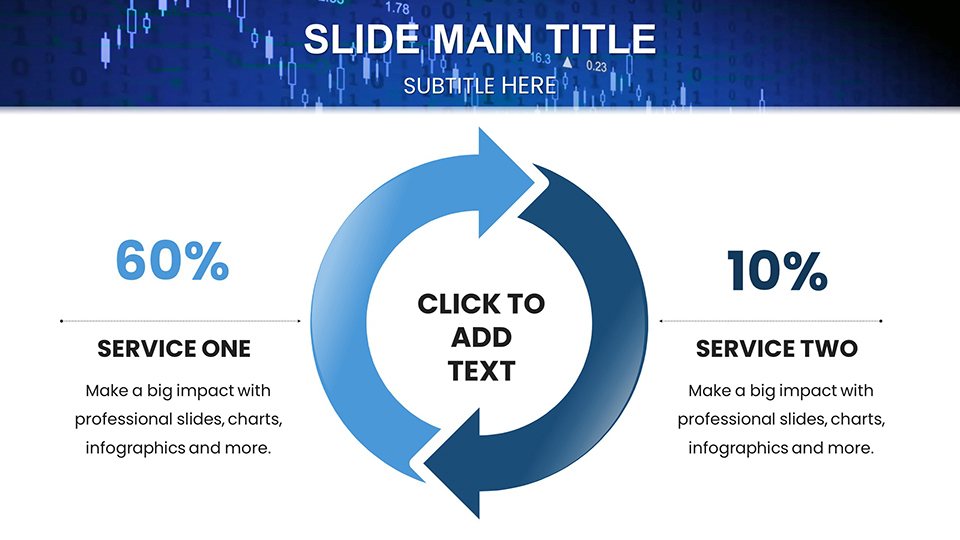
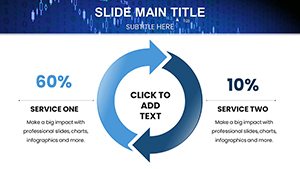
Investor meetings shine with funnel charts showing conversion paths, driving funding success stories.
Download Contents and Setup
Includes PPTX files themed on business models and graphs, with guides for integration.
- Purchase and download instantly.
- Customize with your data sets.
- Present strategies that impress.
This mirrors efficient business tools workflows.
Unique Edges in Marketing Visuals
Stand out with tailored designs for analytics, plus tips like data layering for depth. Integrate with tools for real-time updates.
Launch Your Strategy Overhaul
Seize the advantage - download now and redefine your marketing narratives with charts that command attention and results.
Frequently Asked Questions
How customizable are the marketing charts? Completely editable for data, design, and animations.
Suitable for which audiences? Marketers, analysts, educators, students, and entrepreneurs.
File compatibility? PPTX for PowerPoint and Google Slides.
Includes animations? Yes, for engaging data reveals.
Versus standard tools? Superior variety and professional polish.
Support for business models? Extensive coverage for strategic visuals.