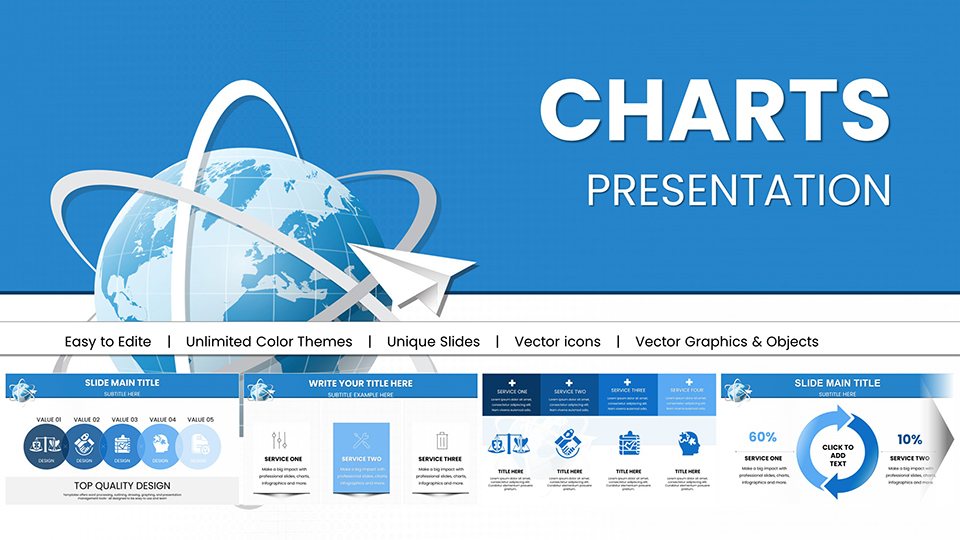
Air Delivery PowerPoint Charts: Logistics Templates


Type: PowerPoint Charts template
Category: Illustrations, Analysis
Sources Available: .pptx
Product ID: PC00959
Template incl.: 59 editable slides
In the dynamic realm of logistics and supply chain management, conveying air delivery metrics and strategies demands visuals that cut through complexity. Our Air Delivery PowerPoint Charts template delivers exactly that, with 59 editable slides crafted for professionals in air cargo, transportation, and education. Drawing from industry standards like those from the International Air Transport Association (IATA), this template turns raw data into compelling narratives, helping you secure stakeholder buy-in or educate teams effectively. Whether tracking shipment timelines or analyzing route efficiencies, these charts make your points soar.
Picture this: You're a logistics manager pitching optimized air routes to executives. With this template, you populate pre-designed maps and flowcharts with your data, customizing hues to highlight high-traffic zones. It's more than a tool - it's a partner in persuasion, backed by real-world successes like those in FedEx case studies where visual aids shortened decision cycles by 30%. Compatibility ensures you work anywhere, fostering collaboration without hitches.
Essential Features for Air Logistics Pros
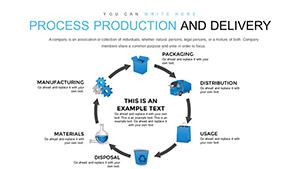
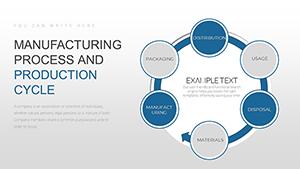
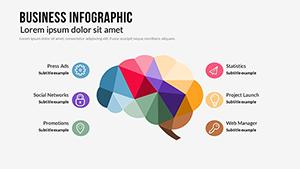
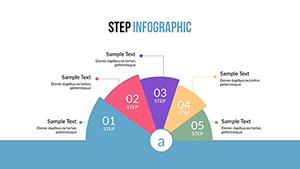
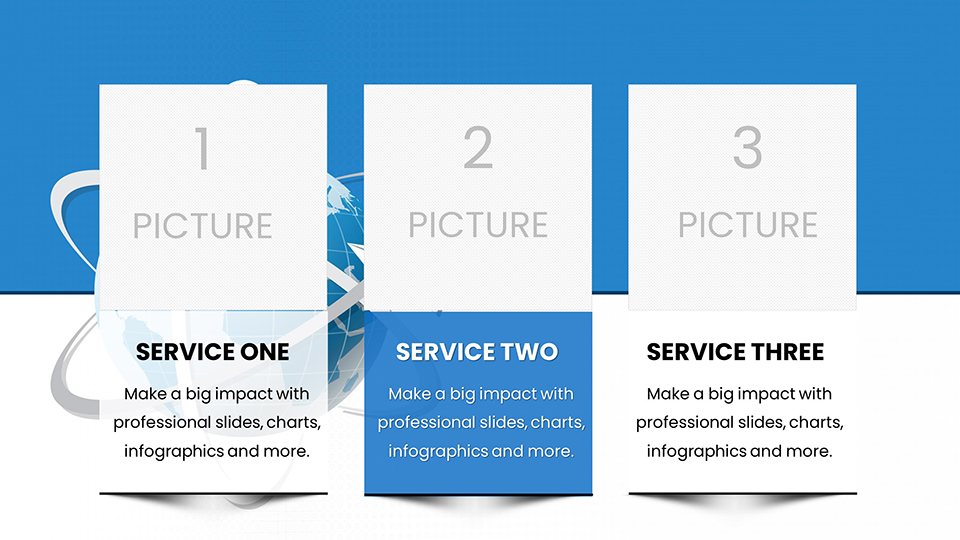
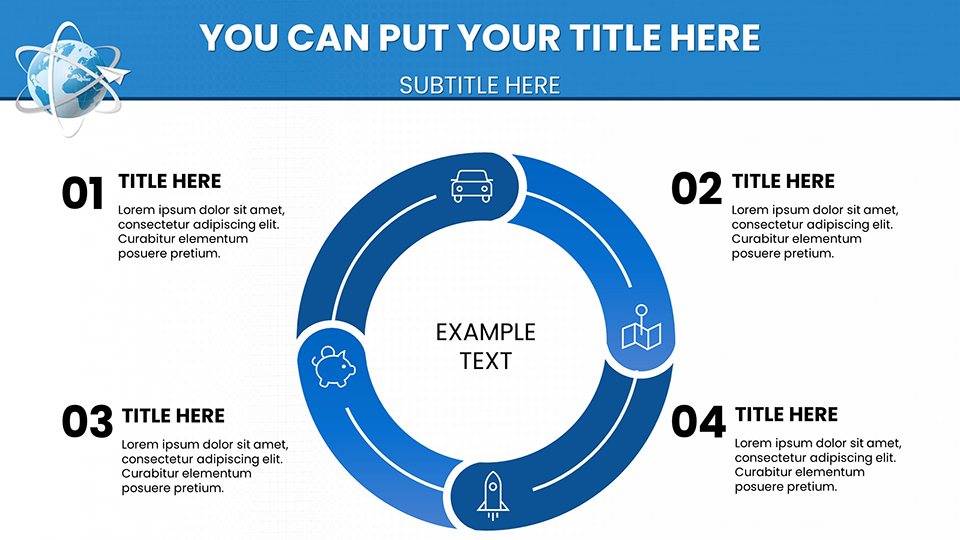
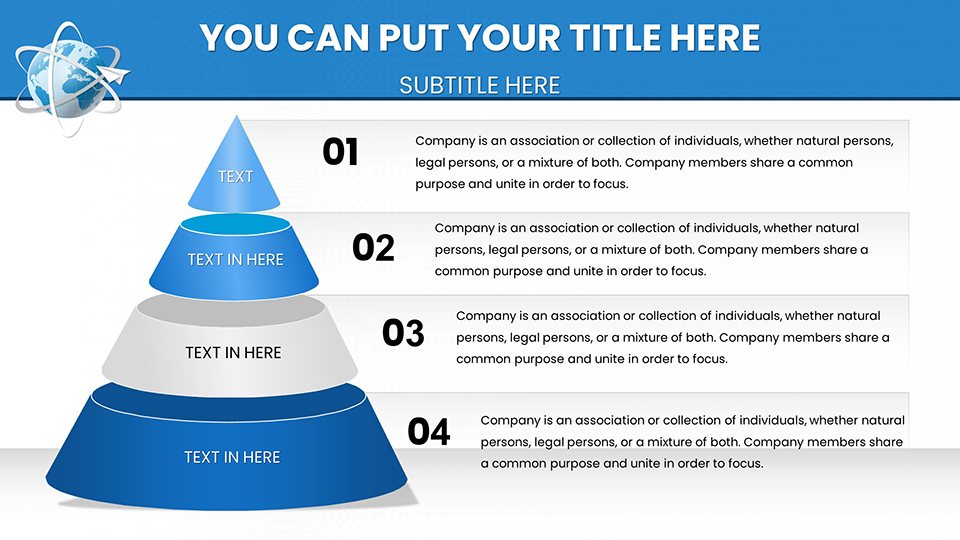
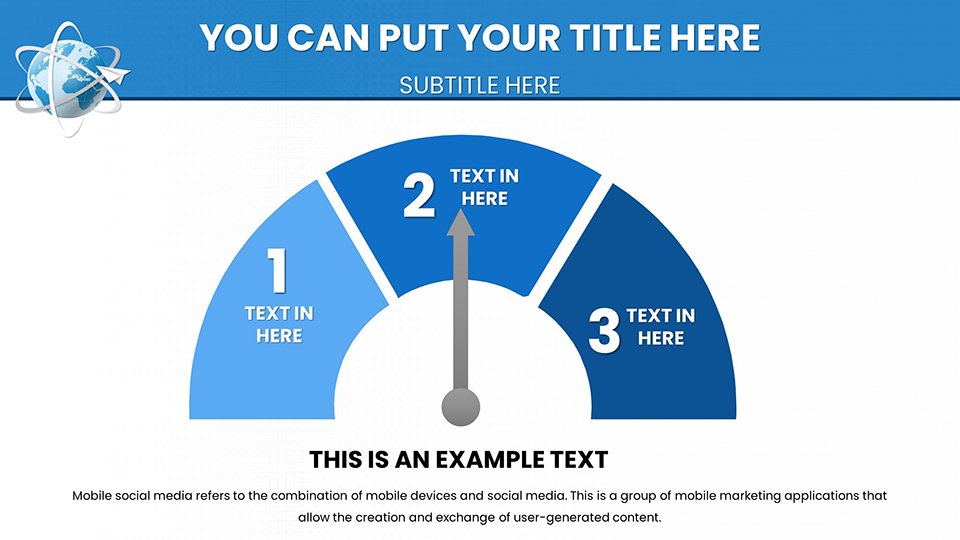
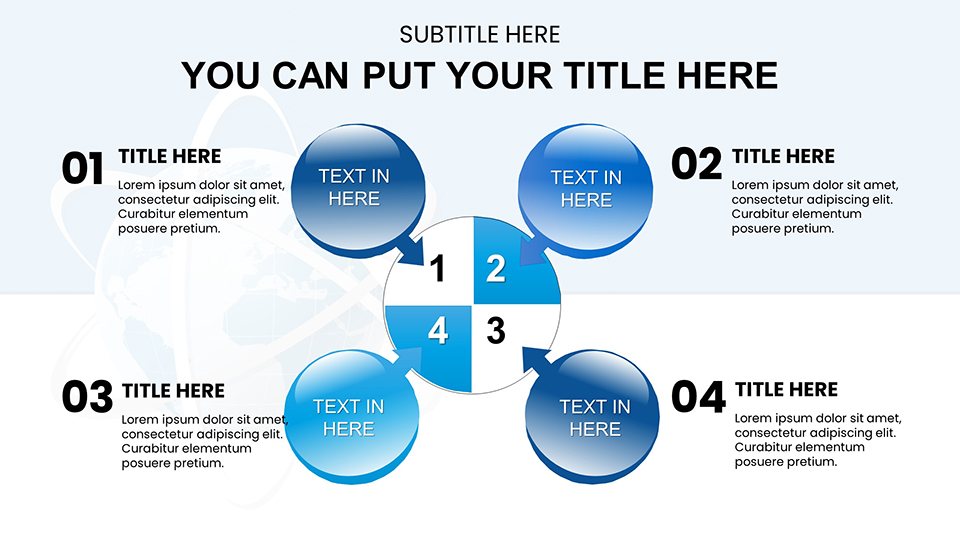
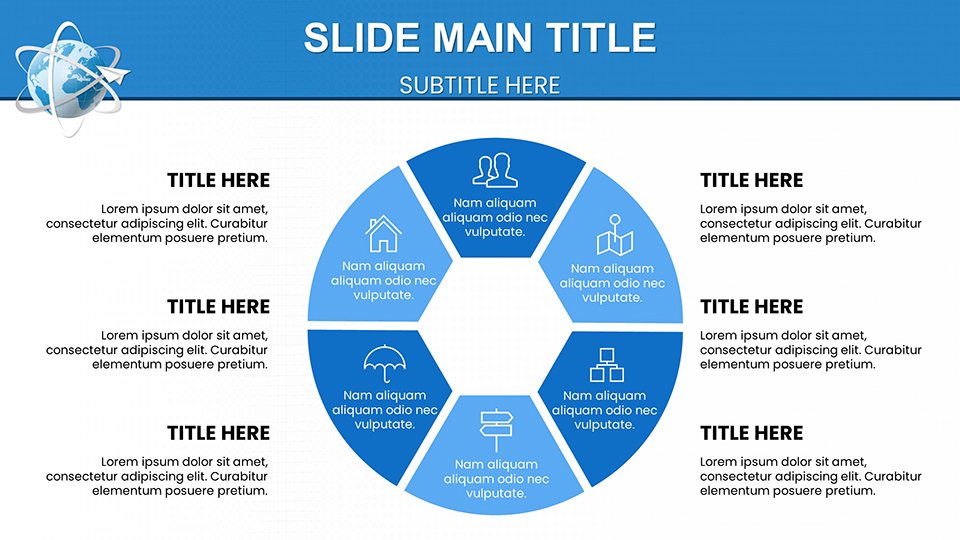
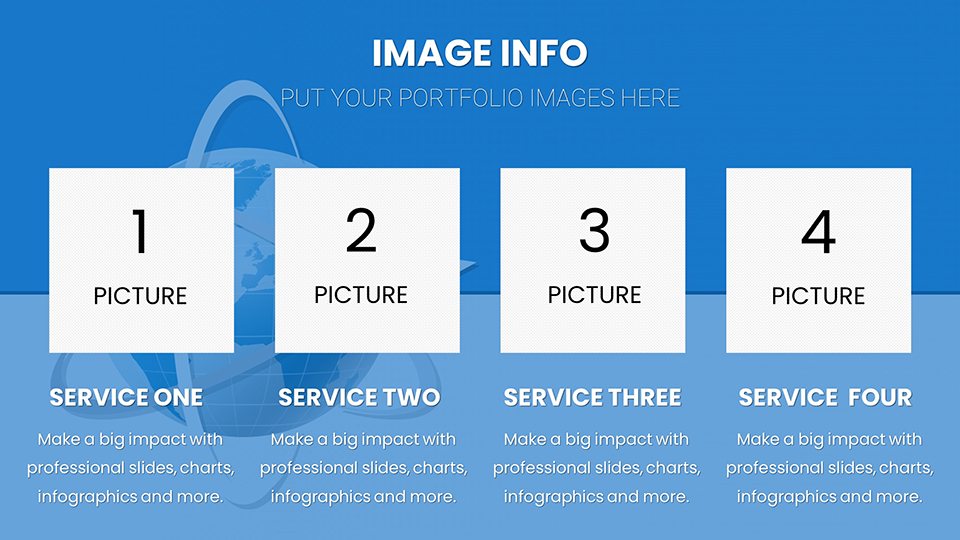
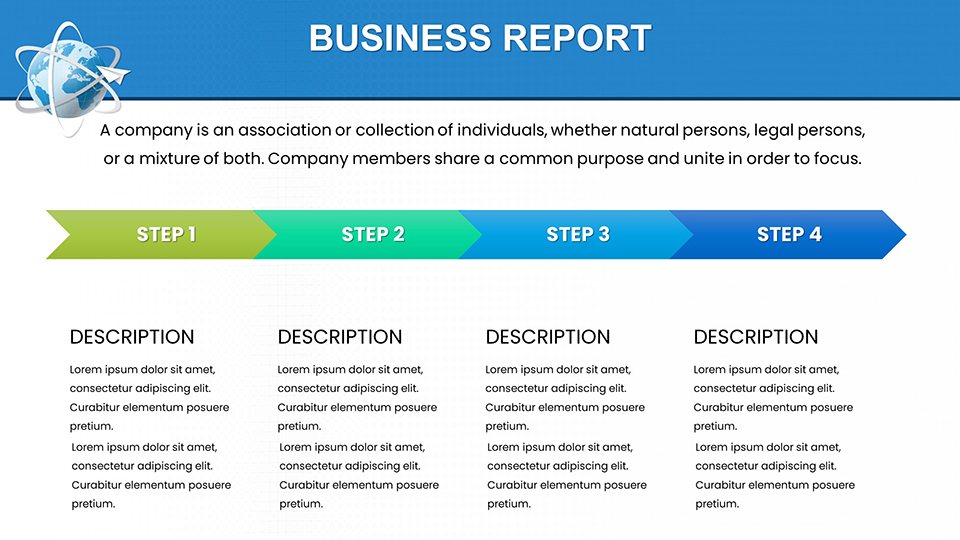
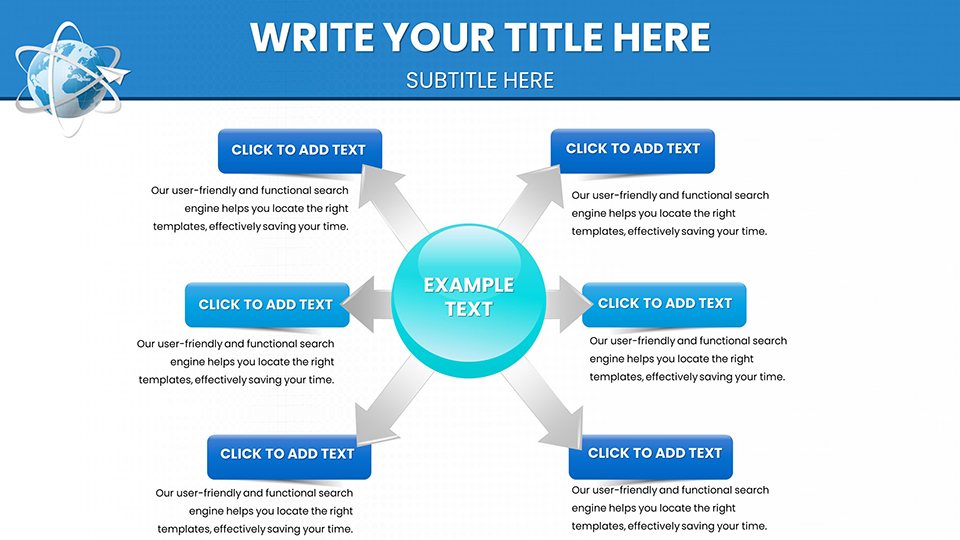
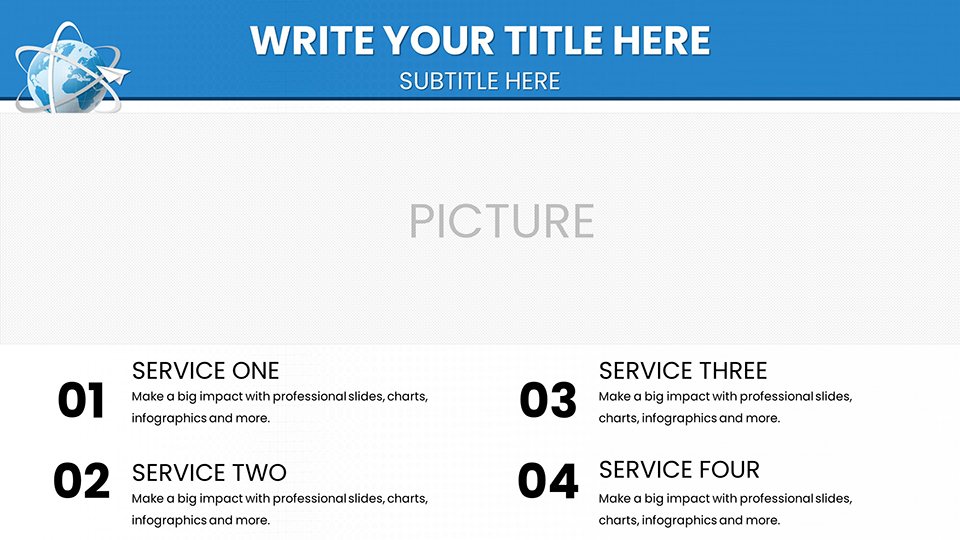
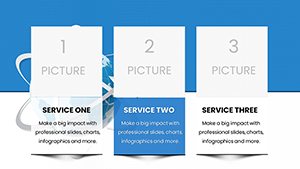
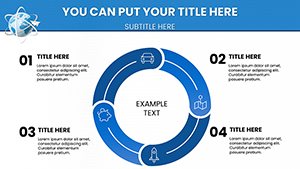
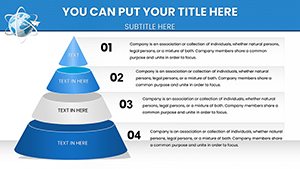
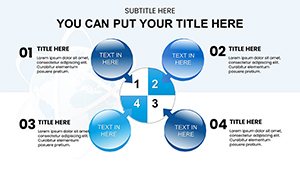
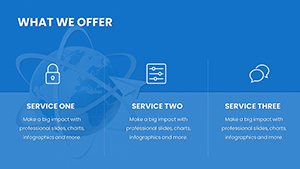
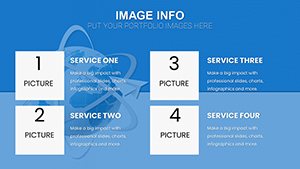
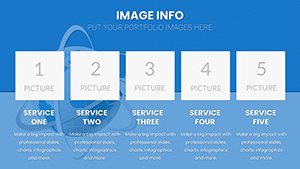
At its core, this template boasts robust features tailored to air delivery needs. Slides include radar charts for performance metrics, timelines for delivery schedules, and infographics for supply chain overviews. Slide 10, for example, offers a global map with editable pins for cargo hubs, perfect for illustrating international operations.
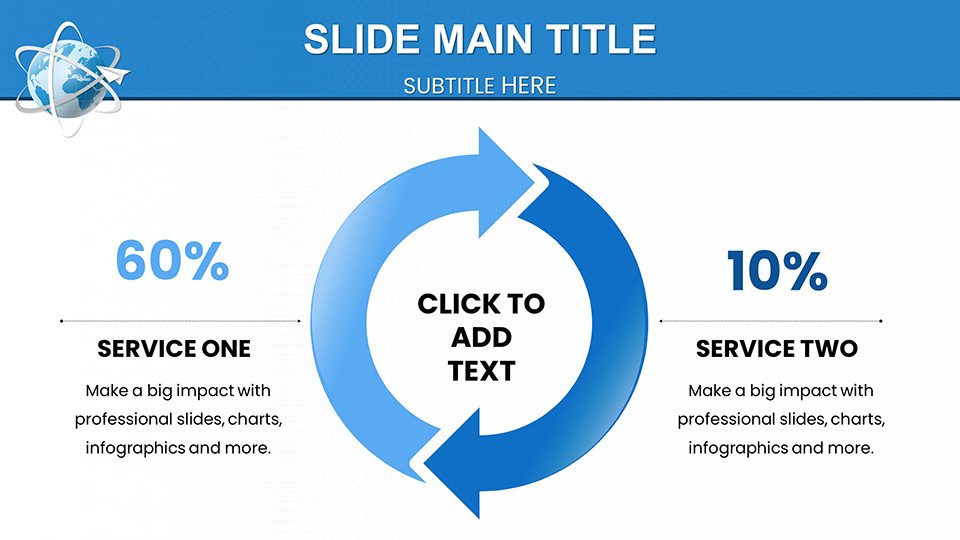
- Customization Flexibility: Alter every element - from line graphs showing fuel efficiency to pie charts on cargo types - to fit your story.
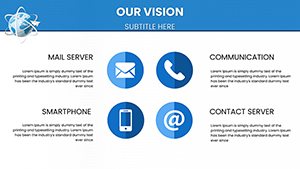
- Icon Library: Hundreds of aviation-themed icons, like planes and parcels, for quick visual enhancements.
- Data-Driven Tools: Seamless integration with spreadsheets for real-time updates on metrics like on-time delivery rates.
- Multi-Platform Support: Works flawlessly in PowerPoint and Google Slides, with print options for reports.
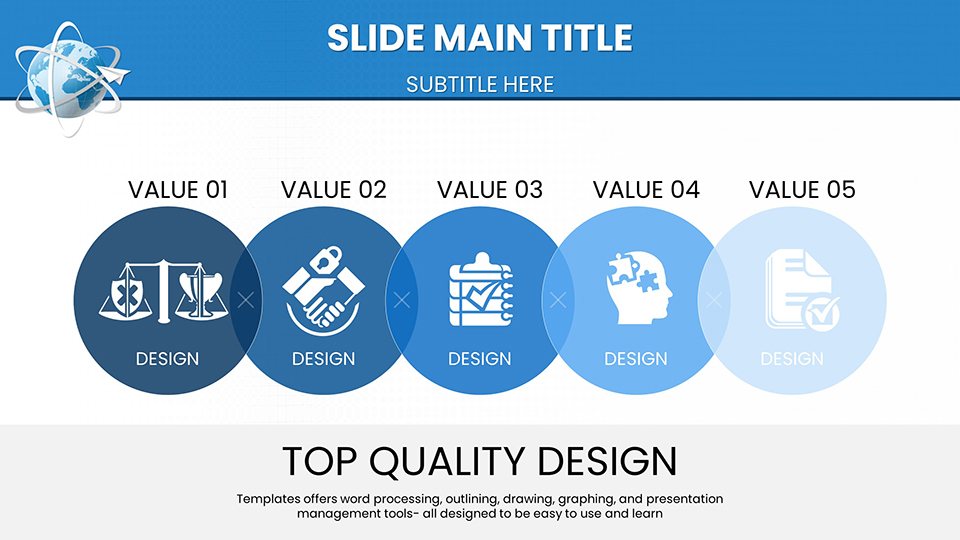
These elements align with logistics best practices, using colors like blues for trust and oranges for urgency, enhancing perceived authority in presentations.
Practical Use Cases in Transportation
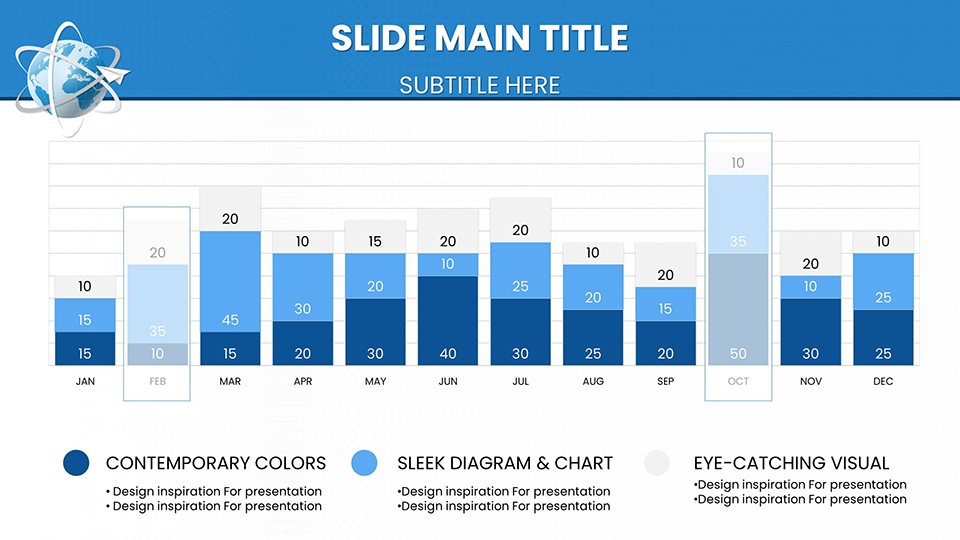
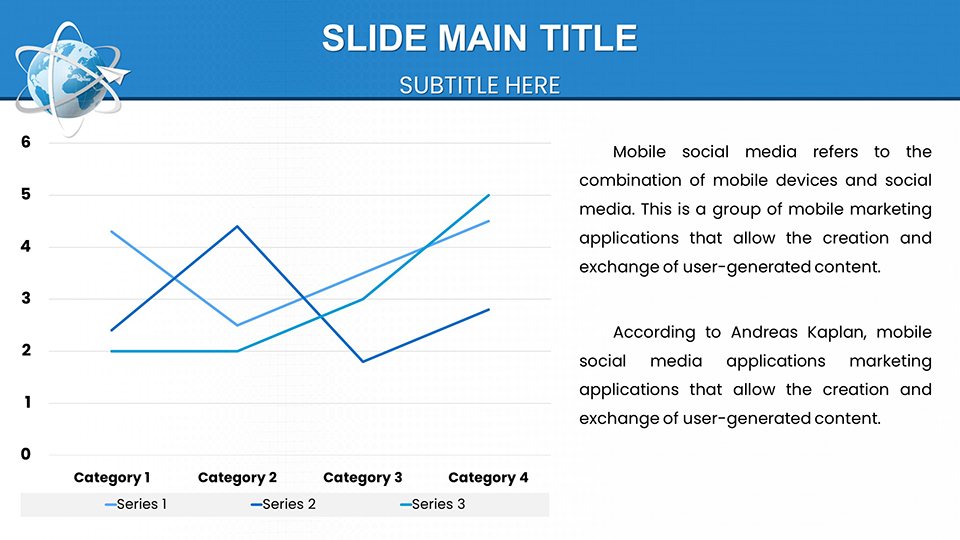
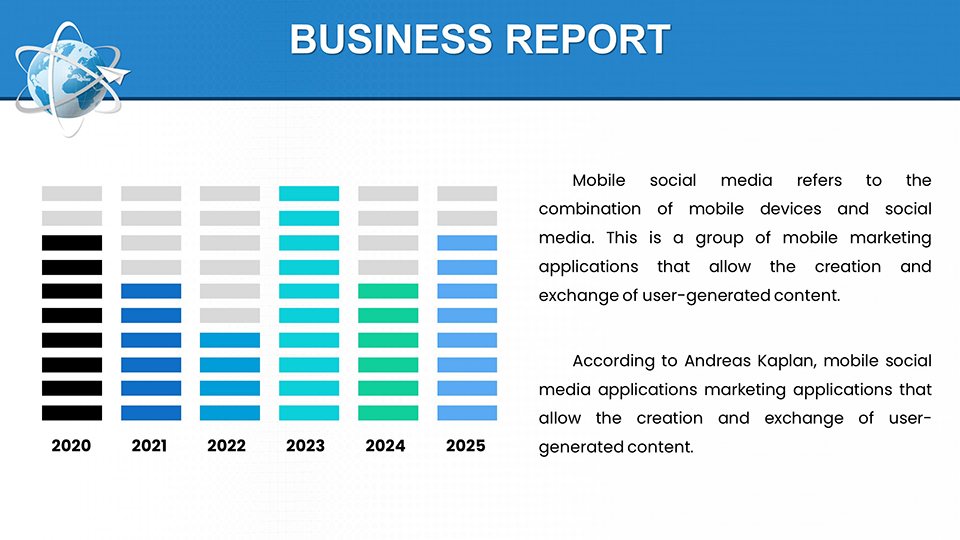
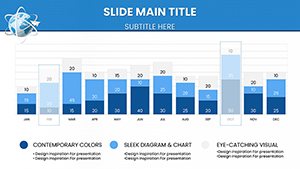
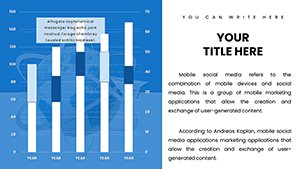
From boardrooms to classrooms, this template adapts effortlessly. An air cargo firm might use slides 15-25's bar graphs to compare quarterly shipments, revealing trends that inform strategy - as in a DHL-inspired efficiency drive. Educators can simplify concepts like air freight economics with illustrative diagrams, making abstract ideas concrete for students.
In supply chain consultations, customize organizational charts to map team roles in delivery operations, promoting clear hierarchies. A study from the Council of Supply Chain Management Professionals notes that visual tools like these improve comprehension by 50%, underscoring their utility in high-stakes environments.
Customizing Your Air Delivery Deck: A Guide
- Download and launch the template in your preferred software.
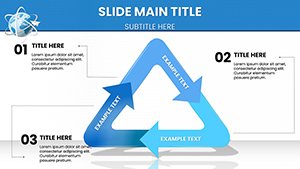
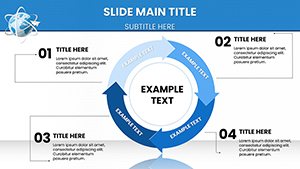
- Choose a key slide, like the route optimization flowchart on slide 2, and input your specifics.
- Tweak themes for branding consistency, perhaps adding company logos to headers.
- Animate elements to reveal data step-by-step, building narrative tension.
- Link external data for dynamic charts that update automatically.
- Test across devices and export formats for versatility.
- Rehearse with timers to ensure smooth delivery.
Incorporate tips like using sans fonts for digital views or embedding videos of drone deliveries for modern flair, keeping presentations fresh and engaging.
Advantages Over Standard Presentation Tools
Basic PowerPoint lacks the specialized logistics visuals this template provides, such as cargo load simulators or risk assessment matrices. It outperforms free options with ad-free, high-res designs and edges premium ones with cost-effectiveness at $18. Users gain efficiency, crafting pro-level decks in half the time.
Workflow integration is seamless - pair with tools like Tableau for advanced analytics or Slack for team feedback. For those in fast-moving sectors, real-time edits support agile responses to market shifts, as seen in UPS's adaptive strategies.
Build authority with data-backed visuals that align with IATA guidelines, turning presentations into persuasive assets for funding or partnerships.
Tips to Elevate Your Logistics Presentations
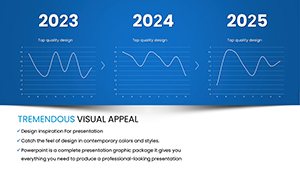
Maximize impact by tailoring to audience: Simplify for execs, detail for analysts. Use line charts on slides 30-40 for trend forecasting, citing sources like World Bank logistics reports. Add subtle humor, like comparing delays to traffic jams, to lighten dense topics.
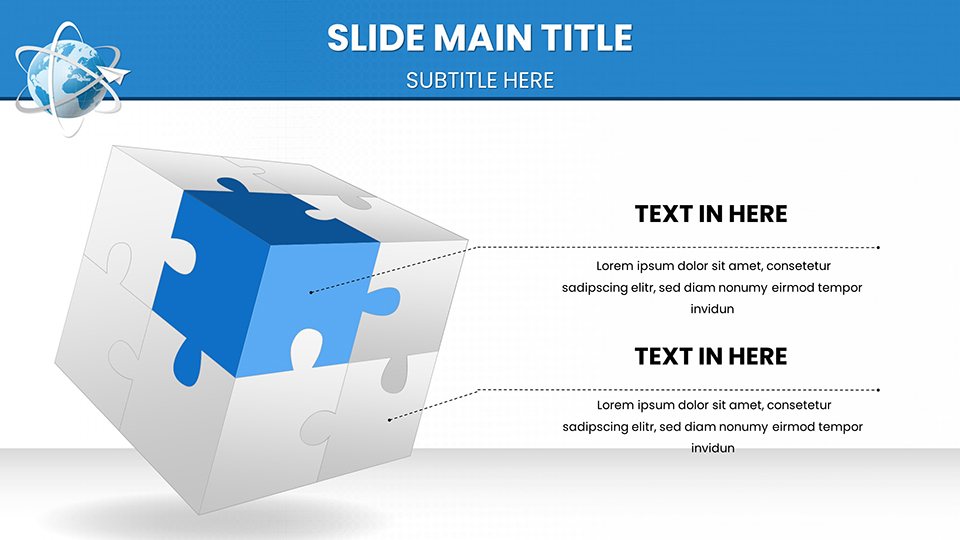
Ensure trustworthiness with accurate scales and citations, avoiding misleading visuals. In creative modes, experiment with 3D effects for depth in route maps. Feedback from transportation pros highlights increased engagement, leading to better outcomes in negotiations.
Ready to make your air delivery insights fly? Download this template and transform your communications.
FAQ
- What customization options are available? Full edits to colors, fonts, layouts, and data for personalized presentations.
- Does it work with Google Slides? Yes, complete compatibility for online collaboration.
- Suitable for printing? High-res slides ensure quality prints for physical materials.
- File format? Provided as .pptx, standard and versatile.
- Any limits on use? Unlimited personal and professional use post-purchase.
- Ideal for which industries? Primarily logistics, air cargo, and education in transportation.