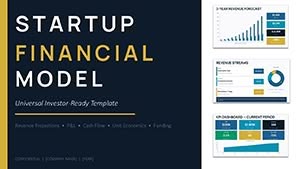
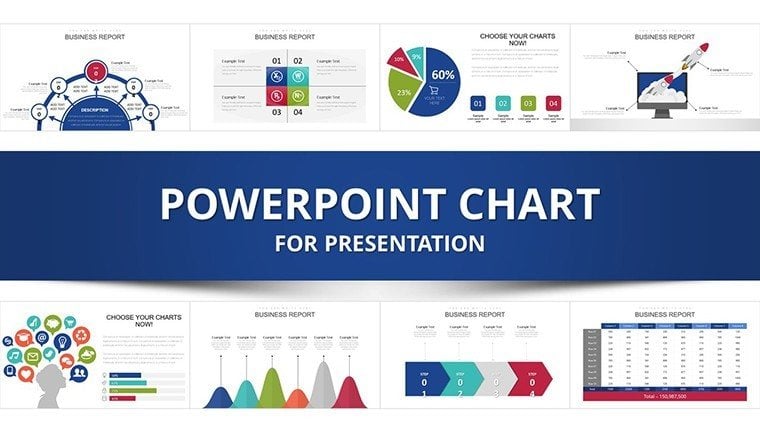
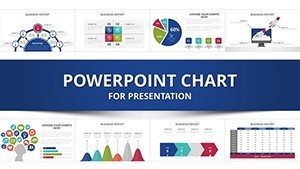
Dynamic Startup PowerPoint Charts Template: Launch Your Ideas with Impact


Type: PowerPoint Charts template
Category: Analysis
Sources Available: .pptx
Product ID: PC00930
Template incl.: 30 editable slides
In the fast-paced world of startups and entrepreneurship, presenting your business ideas effectively can make the difference between securing funding and fading into the background. Our Dynamic Startup PowerPoint Charts Template is crafted specifically for ambitious entrepreneurs who need to communicate complex data with clarity and flair. With 30 fully editable slides, this template empowers you to create professional presentations that captivate investors, partners, and clients. Imagine transforming raw numbers into visually stunning narratives that highlight your market analysis, growth projections, and strategic plans. Whether you're pitching a new venture or updating stakeholders on progress, this template adapts seamlessly to your needs, ensuring your message resonates.
Unlock the Power of Visual Data Storytelling
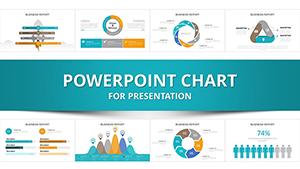
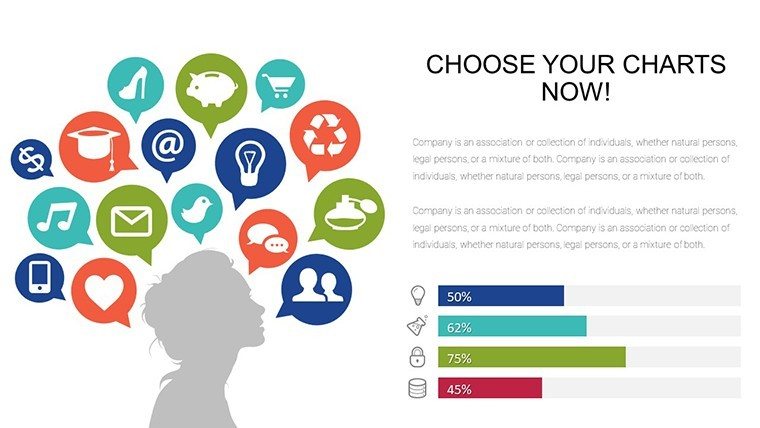
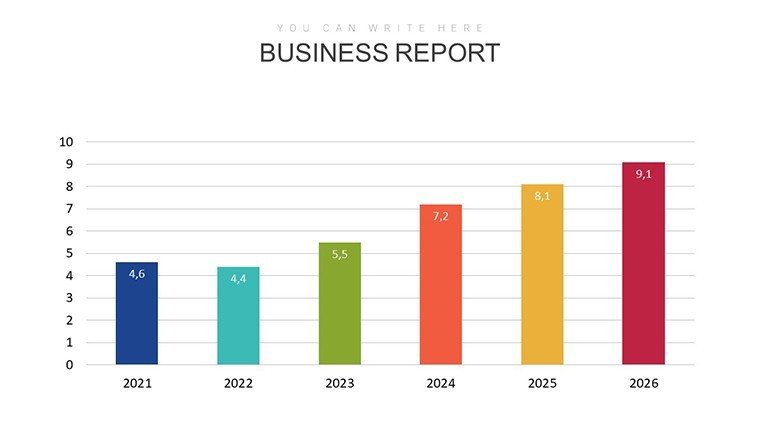
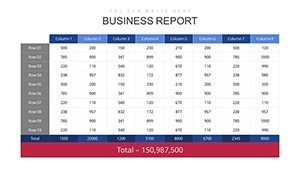
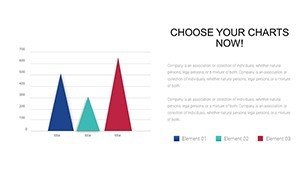
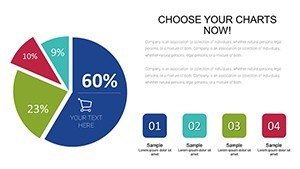
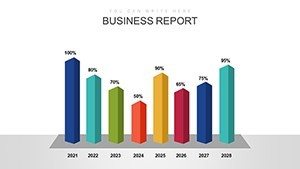
Data is the backbone of any successful business pitch, but overwhelming slides can lose your audience. This template's dynamic charts turn that challenge into an opportunity. From bar graphs illustrating revenue forecasts to pie charts breaking down market shares, each element is designed for maximum impact. Entrepreneurs often struggle with time constraints, but our user-friendly interface allows quick customizations - change colors to match your brand, edit data points on the fly, and rearrange slides effortlessly. Drawing from best practices in financial presentations, as outlined in resources like PwC's financial statement guides, we emphasize clarity and compliance with standards like GAAP to build trust in your numbers.
Key Features That Set Your Presentations Apart
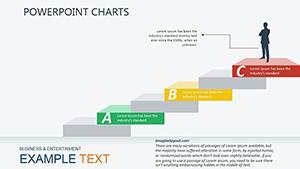
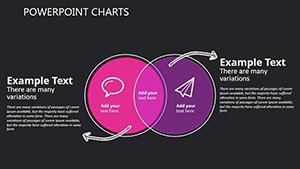
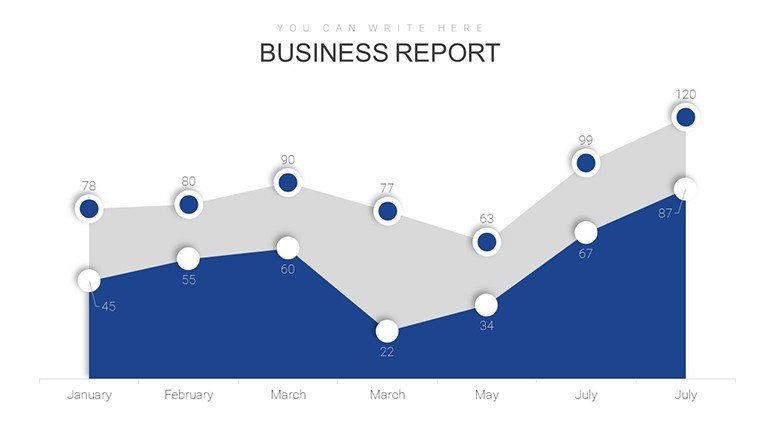
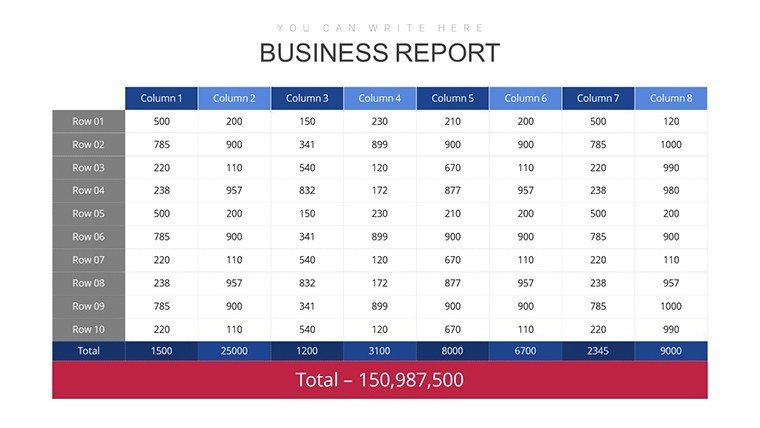
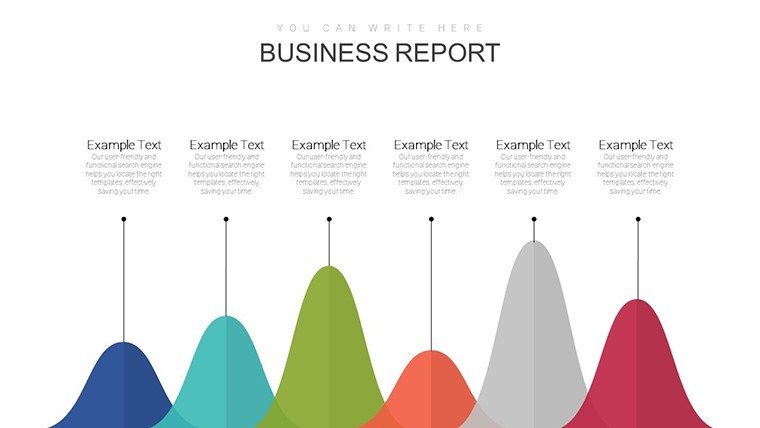
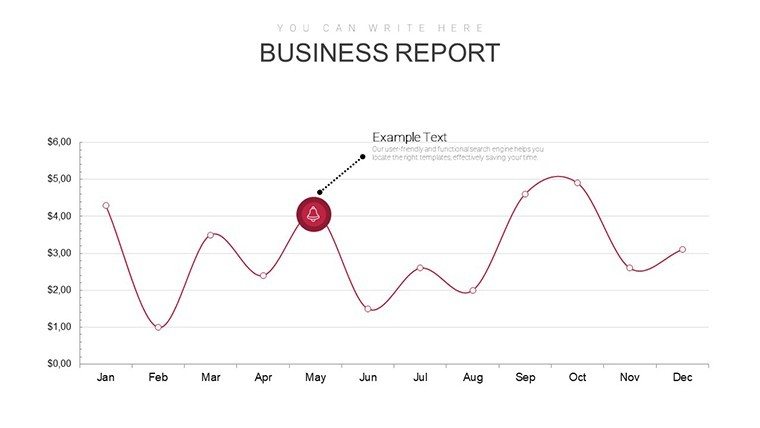
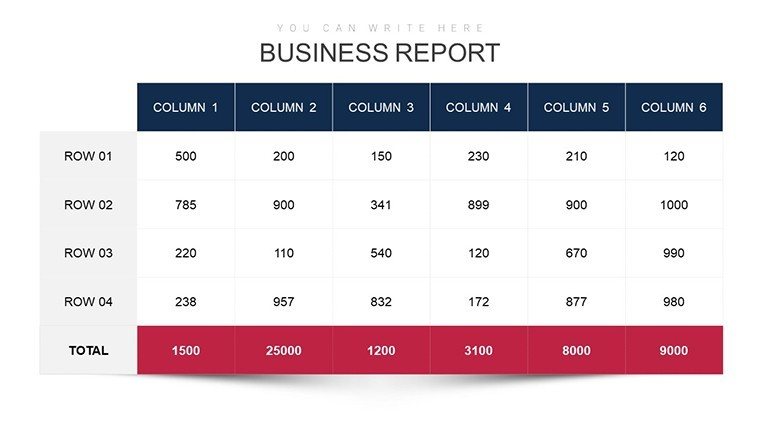
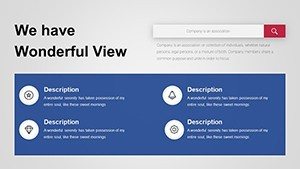
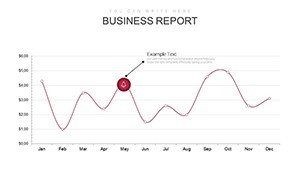
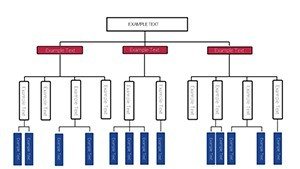
Our template isn't just about charts; it's a comprehensive toolkit for business communication. Start with stunning visuals that capture attention immediately - think sleek line graphs showing growth trajectories over time, or clustered columns comparing competitor performance. Versatility shines through with endless customization options: adjust fonts for a modern look, incorporate your logo, or integrate icons that represent your industry. The user-friendly design means even PowerPoint beginners can create pro-level slides, saving hours of frustration. Moreover, the data-driven focus helps you present insights backed by real metrics, giving you a competitive edge in meetings.
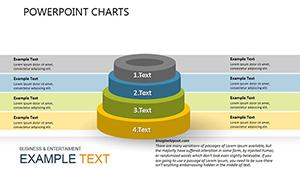
- Stunning Visuals: High-resolution charts that make complex data digestible, allowing you to spotlight key business insights without overwhelming viewers.
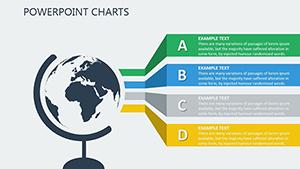
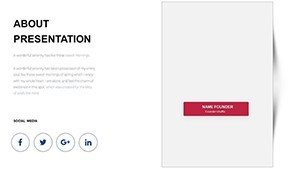
- Customization Freedom: Tailor every element to your brand, from color schemes to layout, ensuring your presentation feels uniquely yours.
- Ease of Use: Intuitive editing tools that let you adapt charts quickly, perfect for last-minute tweaks before a big pitch.
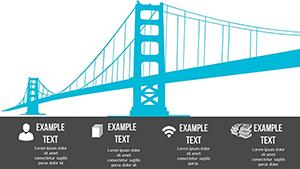
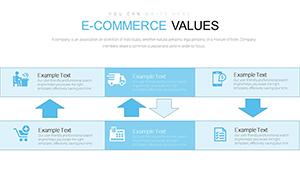
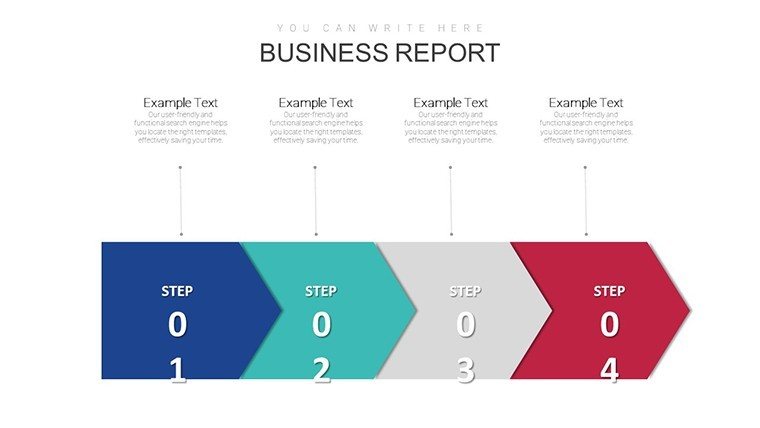
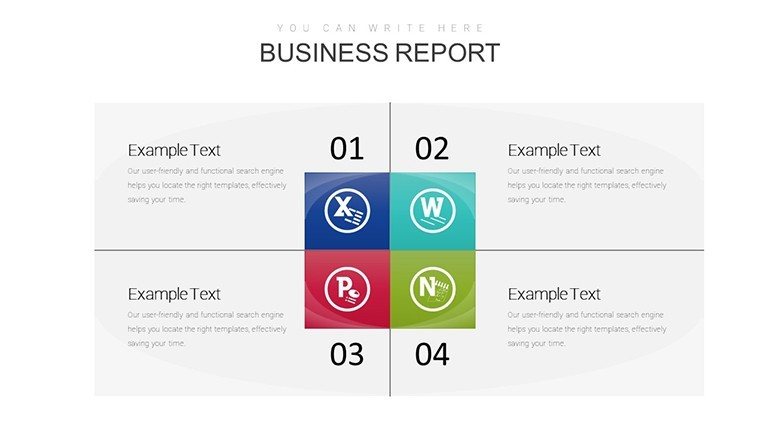
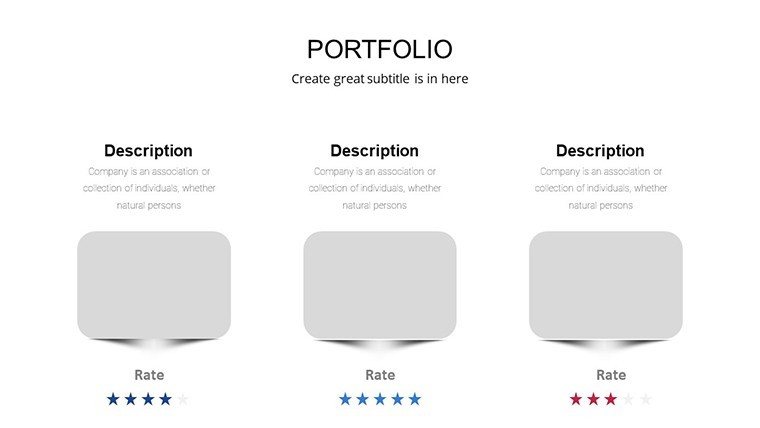
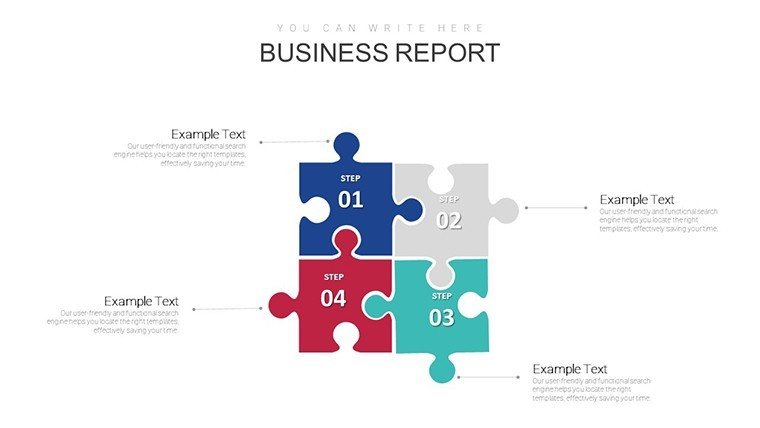
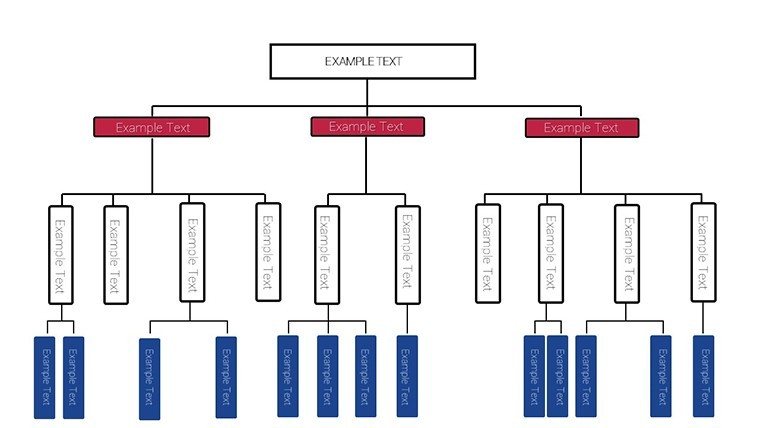
- Infographic Integration: Embed visual elements like timelines and flowcharts to narrate your startup journey engagingly.
- Professional Polish: Pre-designed themes that align with business standards, helping you project confidence and expertise.
Real-World Applications for Entrepreneurs
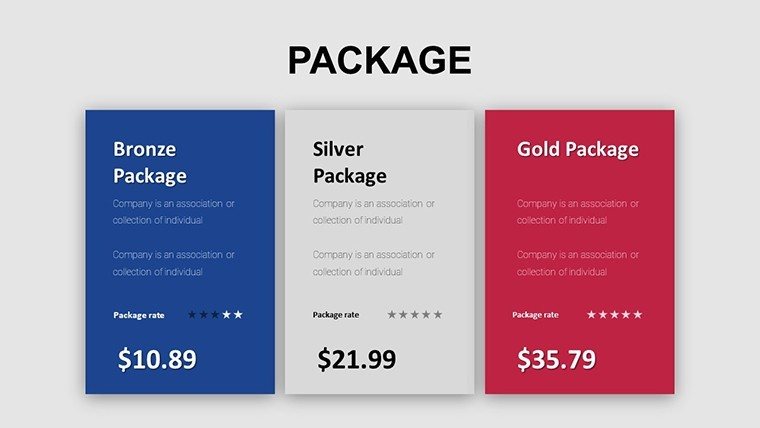
Picture this: You're an aspiring entrepreneur preparing for a venture capital meeting. Using our template, you craft a slide deck that starts with an overview chart of your market opportunity, followed by detailed breakdowns of your financial model. Case studies from successful startups, like those analyzed in financial presentation best practices, show how visual aids have secured millions in funding. For instance, a tech startup used similar dynamic charts to demonstrate user growth, leading to a successful Series A round. Small business owners can apply this for internal reviews, tracking sales trends with area charts or evaluating expenses via donut graphs. The template's flexibility extends to various scenarios, from investor pitches to team strategy sessions, always emphasizing actionable insights.
Step-by-Step Guide to Customizing Your Template
Getting started is straightforward. First, download the .pptx file and open it in PowerPoint. Select a slide, say one with a bar chart for revenue projections - simply click the data placeholders and input your figures. Adjust the color palette to evoke energy and innovation, perhaps blues and greens for a tech-focused pitch. Add animations subtly to reveal data points sequentially, keeping your audience engaged without distraction. For deeper analysis, incorporate scatter plots to show correlations between marketing spend and customer acquisition. This approach aligns with GAAP principles by ensuring accurate representation of financial data, avoiding common pitfalls like misleading scales.
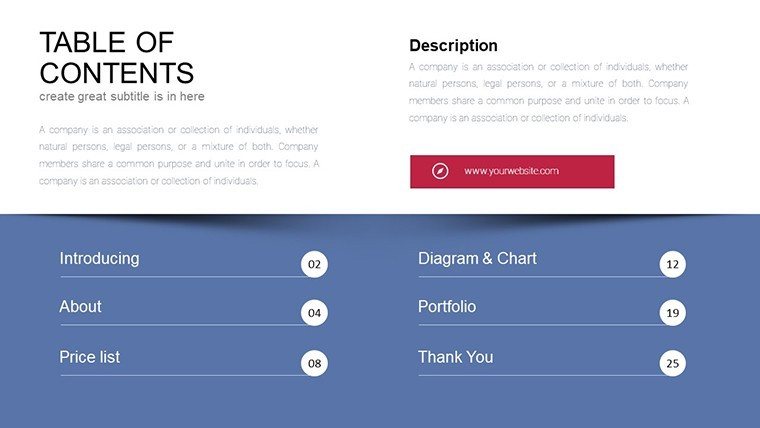
- Open the template and review the 30 slides to plan your flow.
- Input your data into charts, verifying accuracy for credible presentations.
- Customize visuals - fonts, colors, and icons - to reflect your brand identity.
- Test animations and transitions for smooth delivery.
- Rehearse your pitch, focusing on how charts support your narrative.
Beyond basics, integrate this template into your workflow. Pair it with tools like Excel for data import, creating live-updating charts that reflect real-time metrics. For productivity boosts, use it in collaborative sessions via Microsoft Teams, where team members can edit slides simultaneously. This not only streamlines preparation but also fosters better decision-making through visualized data.
Benefits That Drive Business Growth
Investing in this template means more than just better slides - it's about elevating your entire business communication strategy. Users report increased engagement in presentations, with audiences retaining key points longer due to visual reinforcement. Compared to basic PowerPoint defaults, our themed icons and infographics add a layer of professionalism that impresses stakeholders. Think of it as your secret weapon for turning data into decisions: a fintech startup, for example, used these charts to highlight cash flow trends, resulting in optimized operations and cost savings. By adhering to financial best practices, such as those from KPMG's handbook on statement presentation, you ensure your pitches are not only compelling but also trustworthy.
Moreover, the template addresses common pain points like information overload. Short paragraphs and bullet points keep content concise, while bold visuals draw eyes to essentials. For entrepreneurs scaling operations, slides dedicated to SWOT analysis or KPI tracking provide structured ways to monitor progress. Imagine presenting quarterly results with radar charts comparing performance metrics - it's a game-changer for demonstrating value to investors.
Expert Tips for Maximum Impact
To truly shine, follow these pro tips: Always start with your audience in mind - what data will convince them? Use consistent color coding across charts for easy comprehension, like red for risks and green for opportunities. Incorporate storytelling elements, weaving charts into a narrative arc that builds to your call to action. From case studies in financial reports, we know that simplicity wins - avoid clutter by limiting each slide to one main idea. Finally, practice delivery to sync your verbal explanations with visual reveals, creating a seamless experience.
As you explore this template, you'll discover its potential to transform mundane data dumps into inspiring visions. Whether analyzing market trends with heat maps or projecting futures with trend lines, every slide is a step toward business success.
Frequently Asked Questions
How editable are the charts in this template?Every chart is fully editable - change data, colors, sizes, and more directly in PowerPoint for a personalized touch.
Is this template compatible with Google Slides?Yes, upload the .pptx file to Google Slides for easy collaboration, though some advanced features may vary.
Can I use this for non-business presentations?Absolutely, its versatile design suits educational or personal projects needing dynamic data visualization.
What file format is provided?The template comes in .pptx format, ensuring compatibility with recent PowerPoint versions.
Are there animation options included?Pre-set subtle animations are available, which you can customize or remove as needed.
Elevate your startup journey today - download this template and turn your visions into victories.