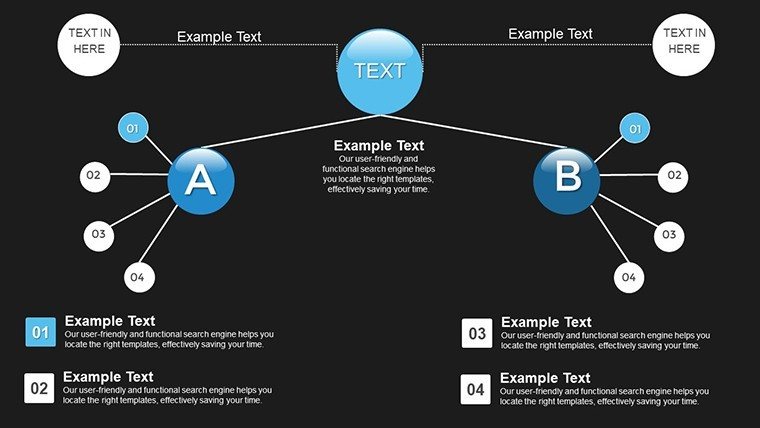
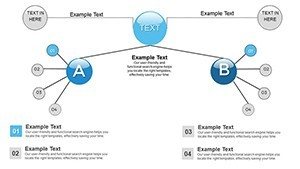
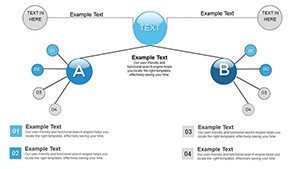
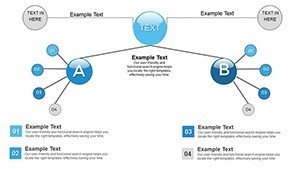
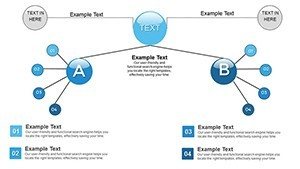
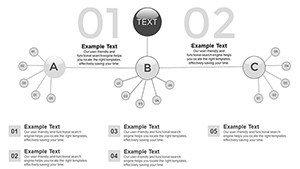
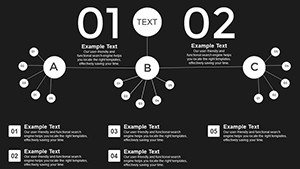
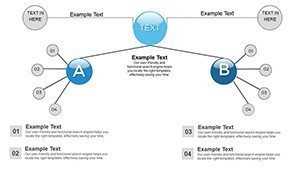
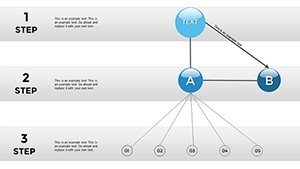
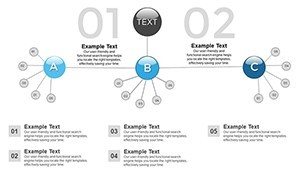
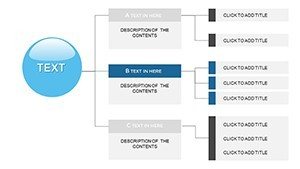
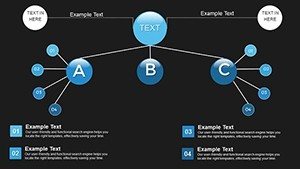
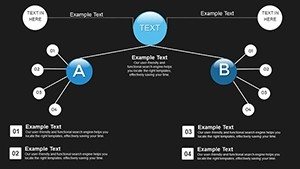
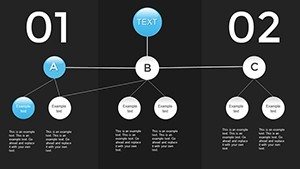
Organizations Work PowerPoint Charts Template


Type: PowerPoint Charts template
Category: Organizational, Tree
Sources Available: .pptx
Product ID: PC00820
Template incl.: 24 editable slides
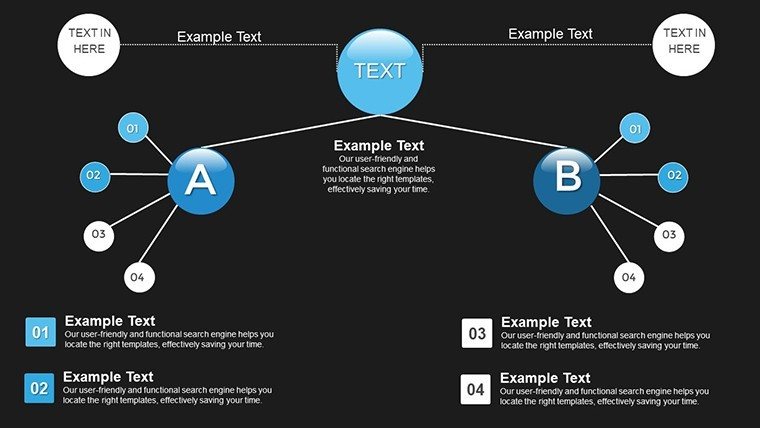
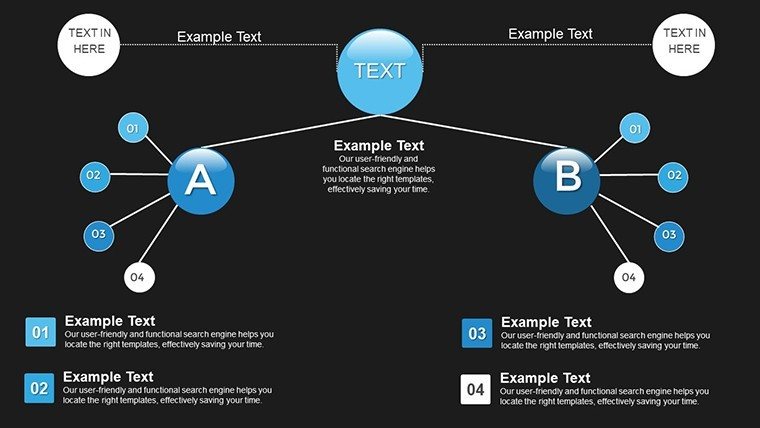
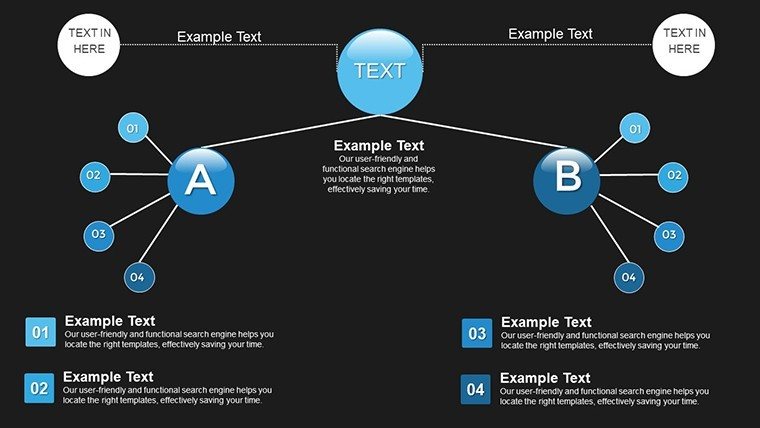
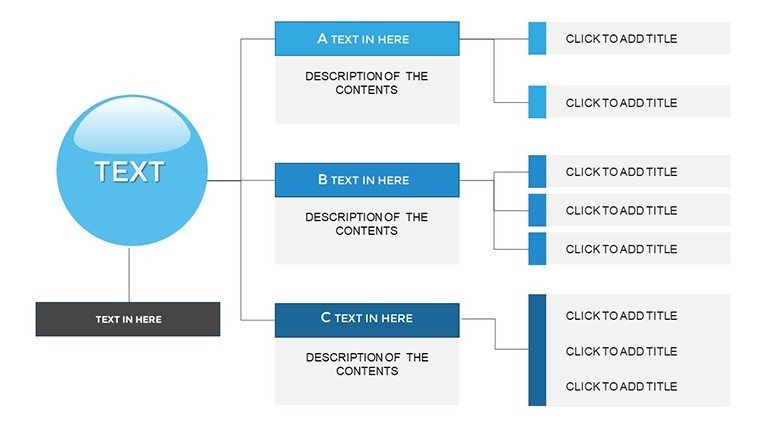
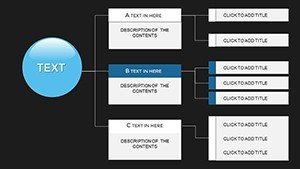
Picture this: You're leading a nonprofit board meeting, and instead of drowning in spreadsheets, your audience is nodding along to clear, vibrant charts that map out your team's workflow and impact. Our Organizations Work PowerPoint Charts Template, with its 24 editable slides, is engineered for just such moments. Tailored for nonprofits, educators, and business pros, it turns abstract organizational data into tangible visuals, fostering better understanding and collaboration. From illustrating volunteer hierarchies to tracking program outcomes, this template empowers you to communicate with precision and passion.
Mastering Organizational Clarity with Versatile Charts
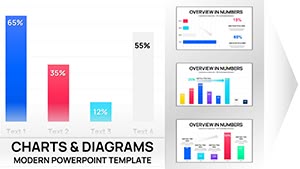
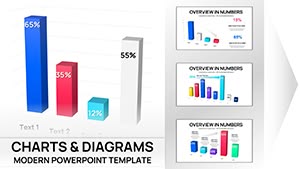
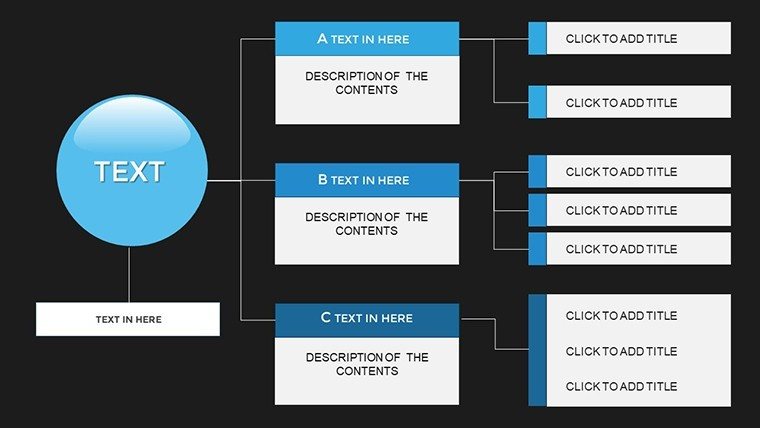
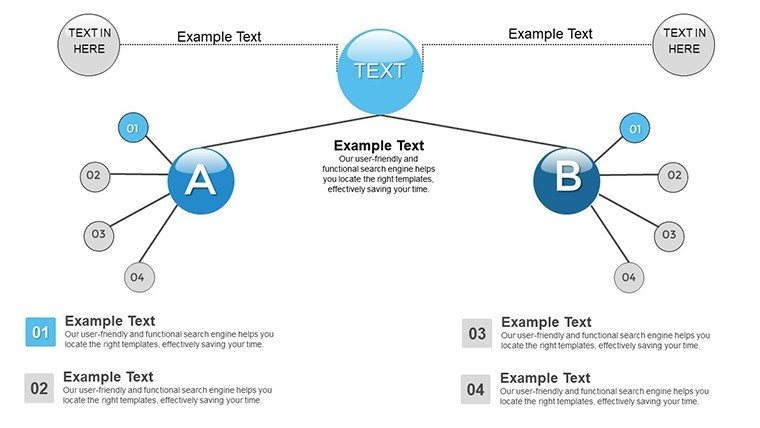
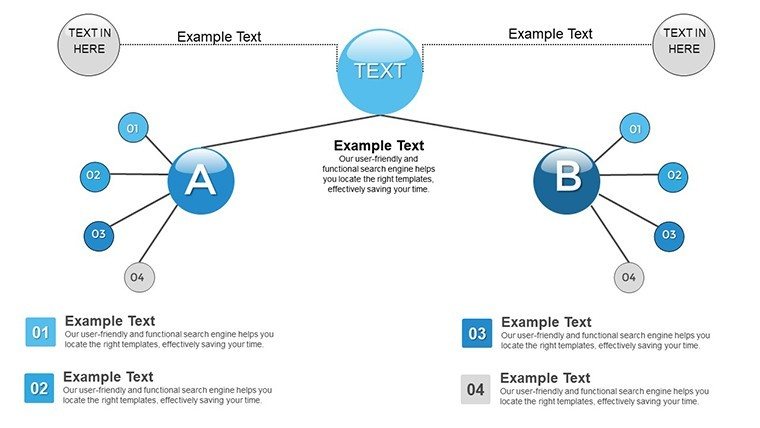
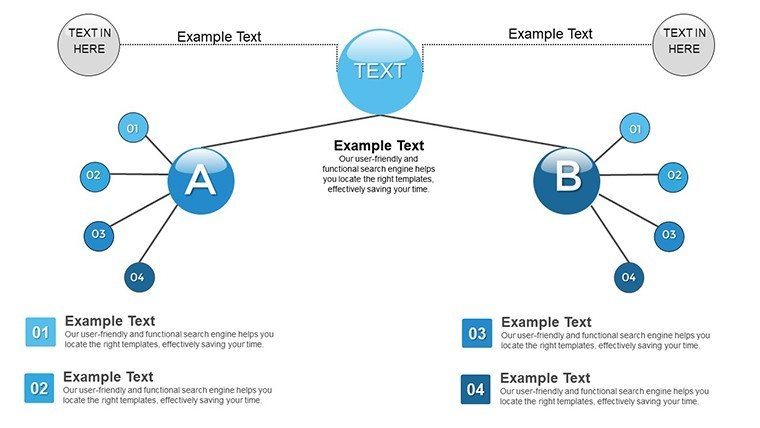
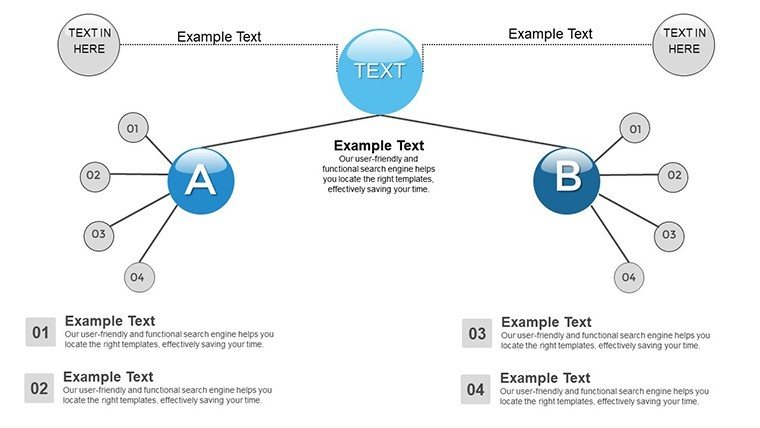
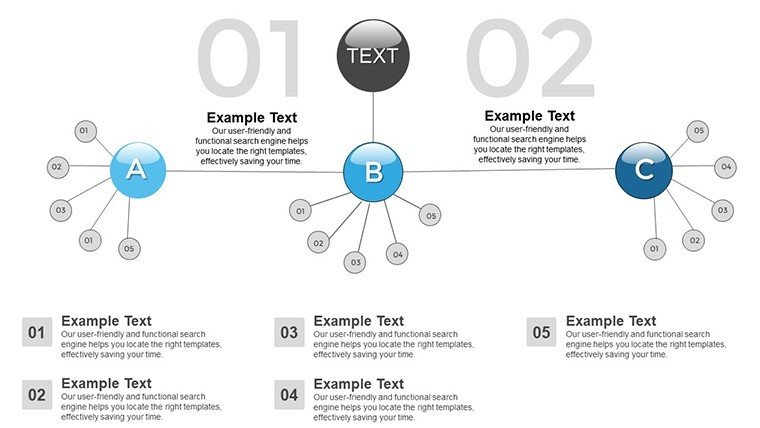
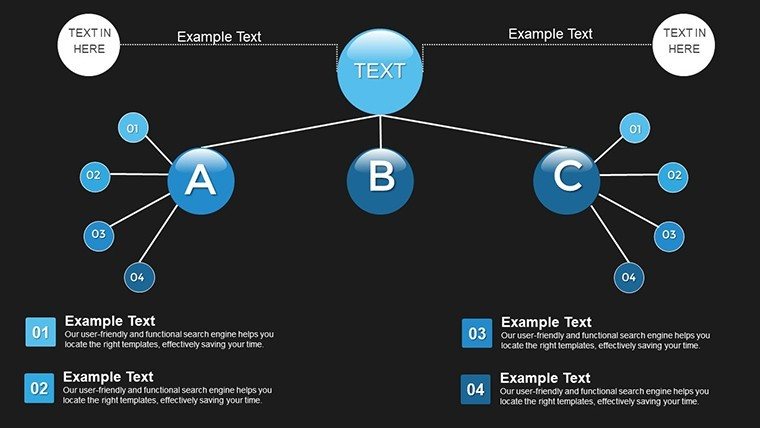
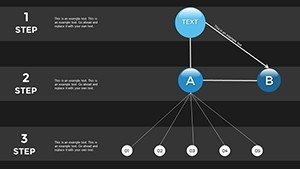
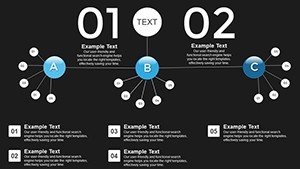
In the realm of nonprofits, where resources are precious and missions are paramount, effective communication is key. This template delivers a suite of chart types - bar graphs for funding comparisons, pie charts for budget breakdowns, line graphs for growth trends, and scatter plots for correlation analysis - all wrapped in a professional, tree-structured design. Each slide is prepped for quick edits, ensuring you spend less time fiddling with formats and more on strategizing. Imagine a community outreach coordinator using a bar graph to highlight participation rates across regions, instantly revealing where efforts yield the most fruit.
Standout Features for Nonprofit Efficiency
Diving deeper, the template boasts a user-friendly interface that welcomes all skill levels. Customize with your branding colors, fonts, and styles in minutes, thanks to intuitive tools. The 24 slides cover everything from basic overviews to detailed analytics, with engaging visuals that simplify complex info. Accessibility is baked in, with options for high-contrast modes and screen-reader friendly labels, aligning with inclusive practices endorsed by organizations like the Nonprofit Technology Network.
- Chart Variety: Mix and match bars, pies, lines, and scatters for comprehensive reporting.
- Brand Alignment: Effortless tweaks to reflect your organization's identity.
- Engagement Boosters: Visual elements that keep stakeholders focused and informed.
- Time Efficiency: Ready-to-use layouts accelerate your prep work.
Tailored Use Cases for Mission-Driven Teams
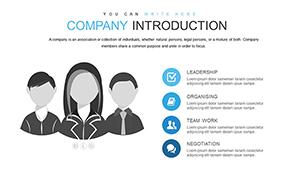
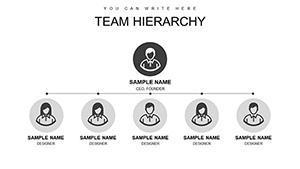
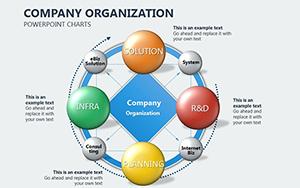
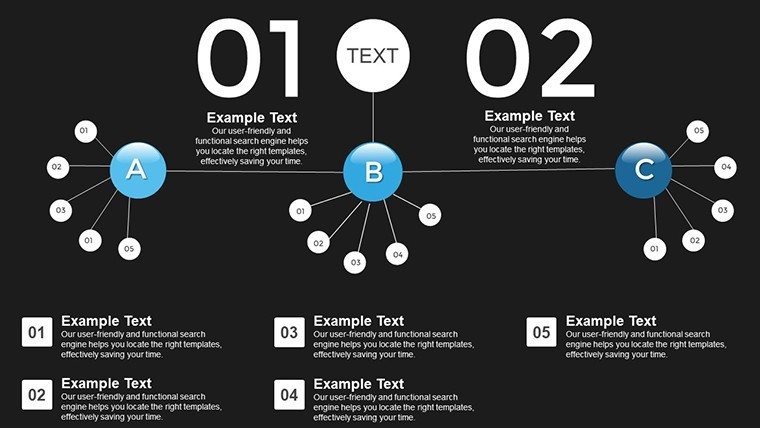
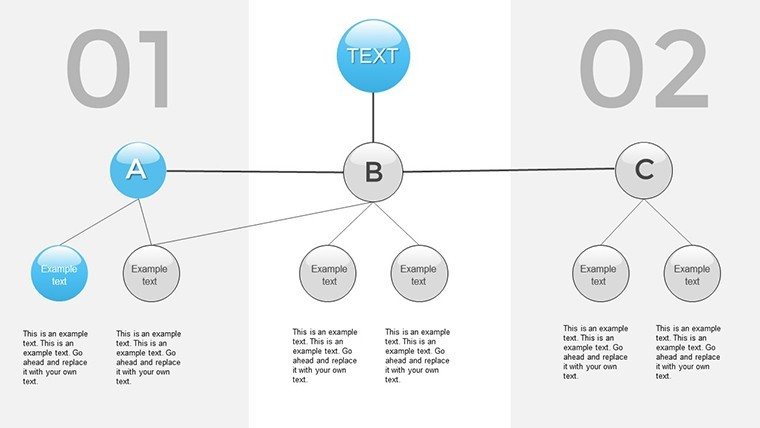
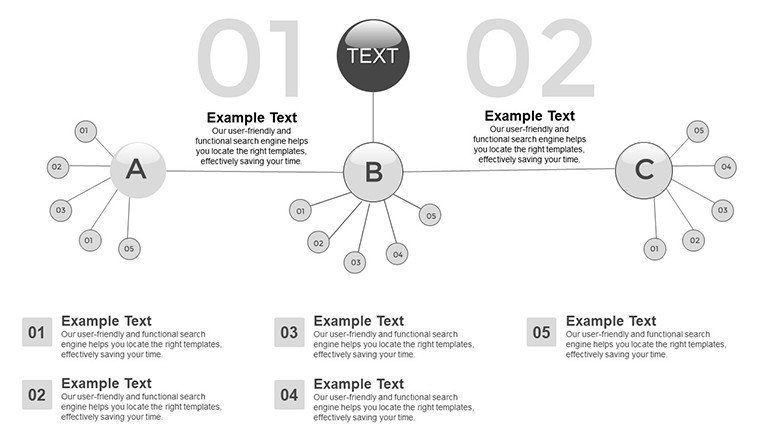
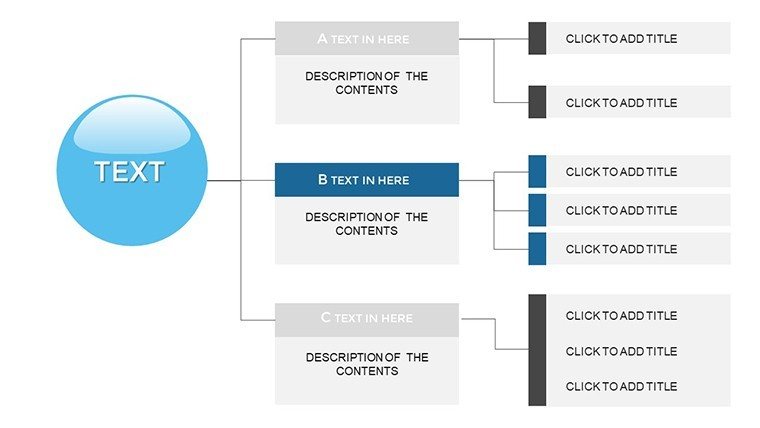
For nonprofits, this template shines in grant proposals, showing funders a clear tree of operations - from board to volunteers - demonstrating accountability. Educators can adapt it for curriculum planning, plotting student progress with line graphs. Public speakers might use scatter plots to correlate donations with program impacts, making abstract successes concrete. A real-world example: A health nonprofit used similar charts to visualize patient outreach, resulting in a 25% funding increase after presenting to donors. In corporate consulting, it's perfect for strategy sessions, mapping workflows to identify efficiencies.
Extend to architecture-inspired scenarios: Urban nonprofits can use tree charts to outline project teams for sustainable building initiatives, ensuring roles align with AIA collaboration guidelines for seamless execution.
Workflow Integration and Customization Steps
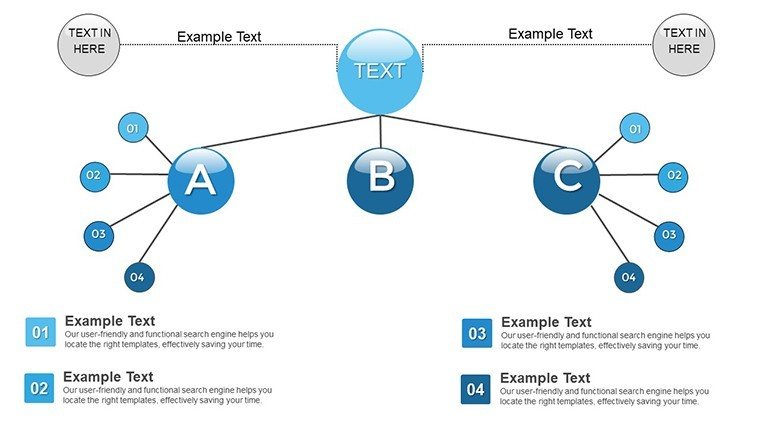
- Select a slide that fits your data narrative, like a tree for hierarchies.
- Import data from spreadsheets; watch charts populate instantly.
- Refine visuals - adjust scales, add legends, or incorporate icons for flair.
- Preview animations if needed, though this version emphasizes static clarity for print-friendly outputs.
- Share or present, confident in its professional polish.
This process meshes with tools like Google Workspace, enhancing collaborative editing for remote teams.
Superior to Standard Presentation Options
Unlike basic PowerPoint defaults, which can appear amateurish, this template offers sleek, cohesive designs that convey authority. Free tools often lack depth, but here you get layered analytics without the bloat. Users in nonprofits note improved donor engagement, as visuals make impacts visceral rather than verbal.
Weave in related terms like workflow diagrams, data mapping tools, and organizational visuals to enrich your content organically.
Pro Tips from a Marketing Lens
Keep charts uncluttered - aim for 5-10 data points max, per visualization experts. Use consistent color schemes for branding, and test on various devices for responsiveness. For nonprofit pitches, link charts to real metrics, like volunteer hours versus outcomes, to build trust.
This template is more than slides; it's a catalyst for clearer missions and stronger connections.
Frequently Asked Questions
What chart types are included?
Bar, pie, line, and scatter plots, all customizable for various needs.
Is it suitable for beginners?
Yes, the intuitive interface makes it accessible to all users.
Can I add my own data easily?
Absolutely - import from Excel or enter directly for quick updates.
Does it support team collaboration?
Compatible with shared platforms like Google Slides for group edits.
How does it help nonprofits specifically?
It visualizes structures and impacts, aiding in funding and planning.
Are there animation options?
Focus is on static charts, but basic transitions can be added.
Empower your organization - secure this charts template now and amplify your impact.