Marketing Mix Modeling PowerPoint Charts Template for Analysts


Type: PowerPoint Charts template
Category: Analysis
Sources Available: .pptx
Product ID: PC00754
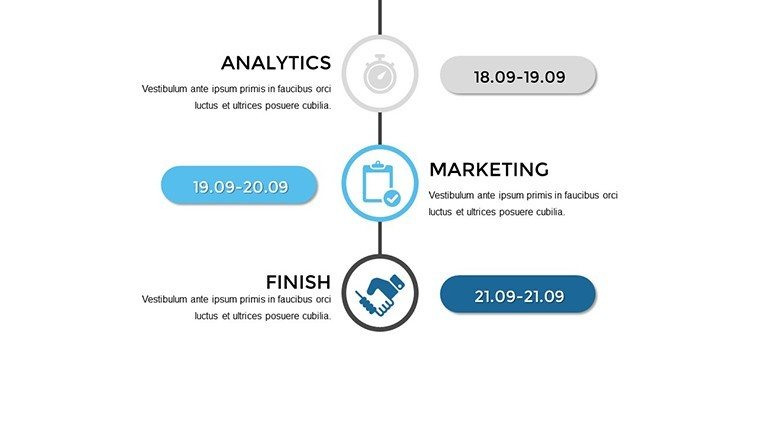
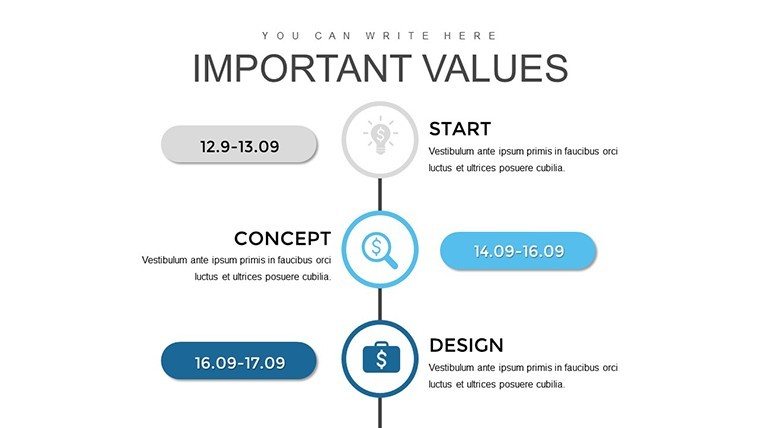
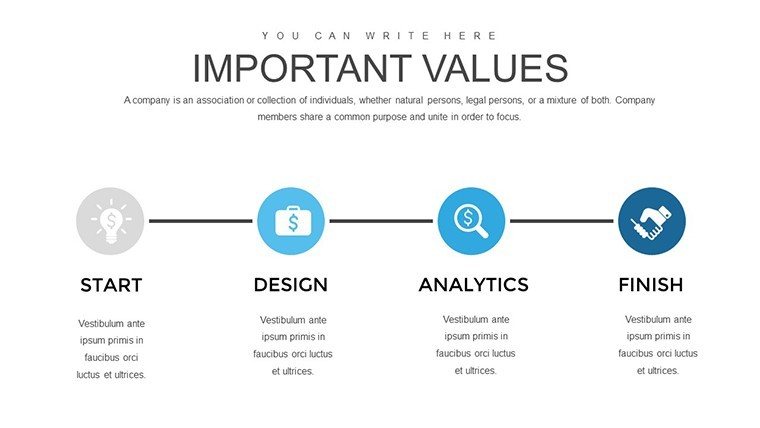
Template incl.: 44 editable slides
In today's data-saturated marketing landscape, turning numbers into narratives is key to strategic success. Our Marketing Mix Modeling PowerPoint Charts Template equips analysts and strategists with 44 editable slides packed with diverse graphs, from ROI curves to channel attribution visuals. Crafted for those who dissect campaigns to optimize spends, this template bridges raw data and actionable insights, much like how causaLens helped a mobile app firm achieve 15x ROI by refining allocations.
Compatible with PowerPoint, it's designed for seamless customization, allowing you to tailor layouts to your brand's story. Whether presenting at conferences or internal reviews, elevate your delivery with professional designs that align with MMA standards for marketing measurement.
Unlocking the Essence of Marketing Mix Modeling
Marketing mix modeling (MMM) analyzes how elements like price, promotion, product, and place impact sales. Our template visualizes these interactions through charts, aiding in budget optimization. As in PyMC-Marketing's end-to-end case, where MMM revealed channel efficiencies, use our slides to simulate scenarios and forecast outcomes.
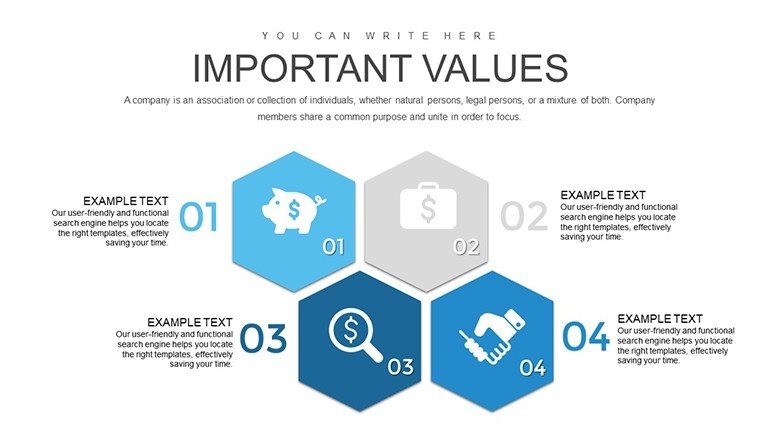
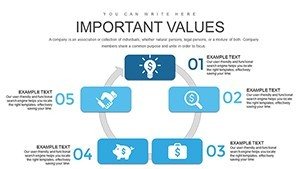
Essential Features for In-Depth Analysis
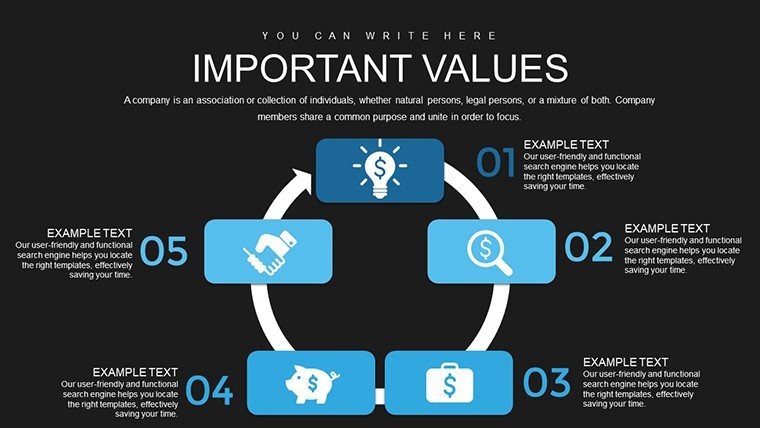
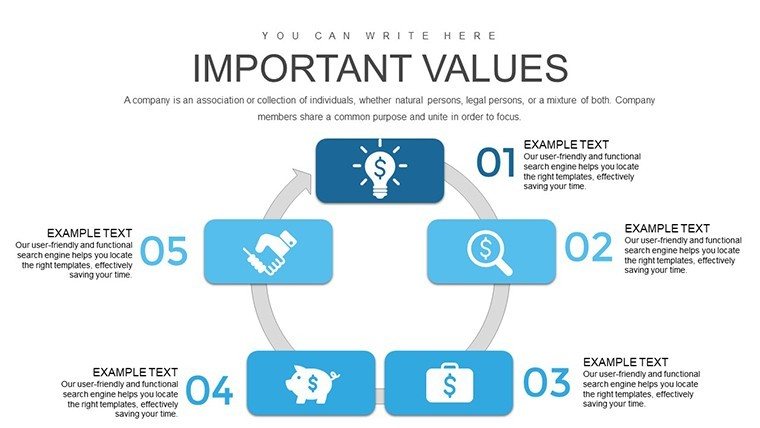
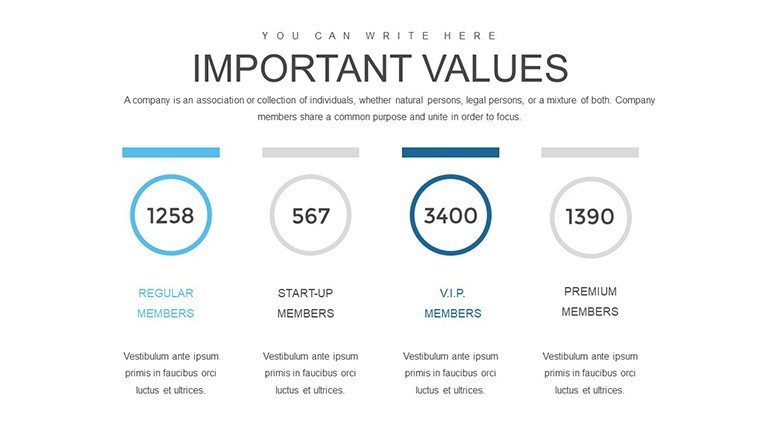
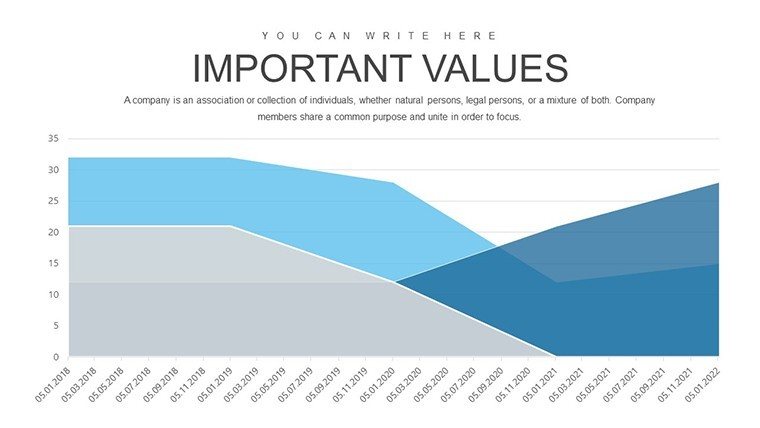
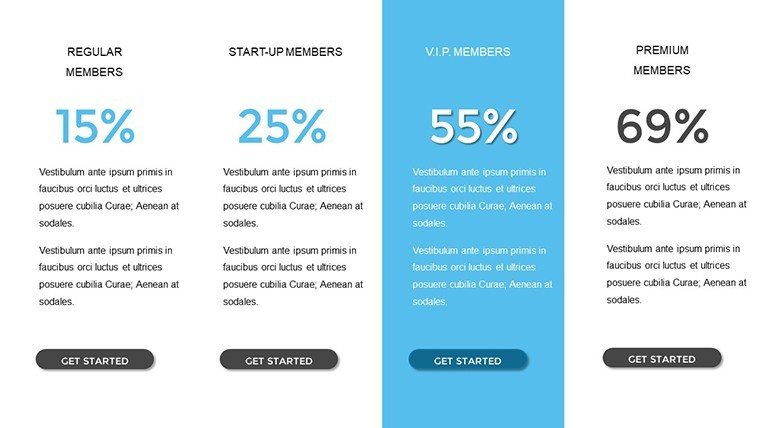
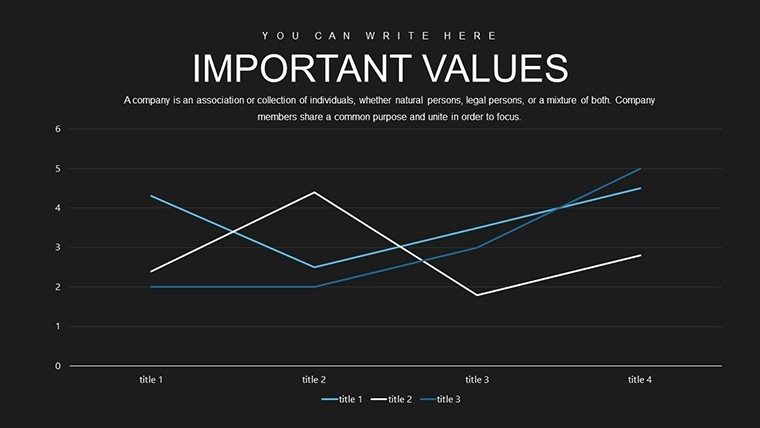
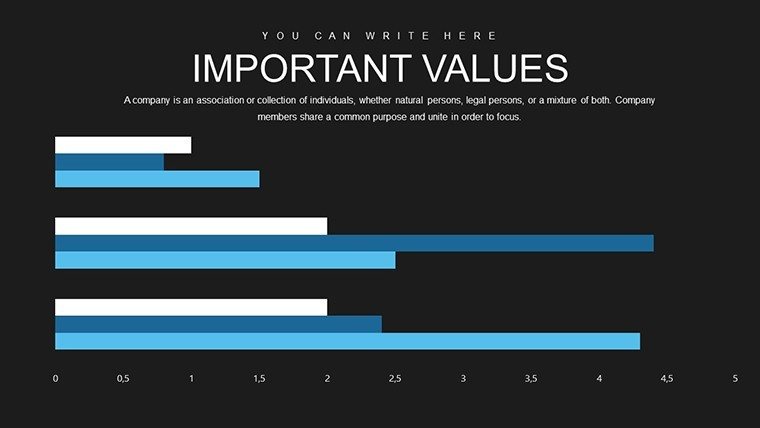
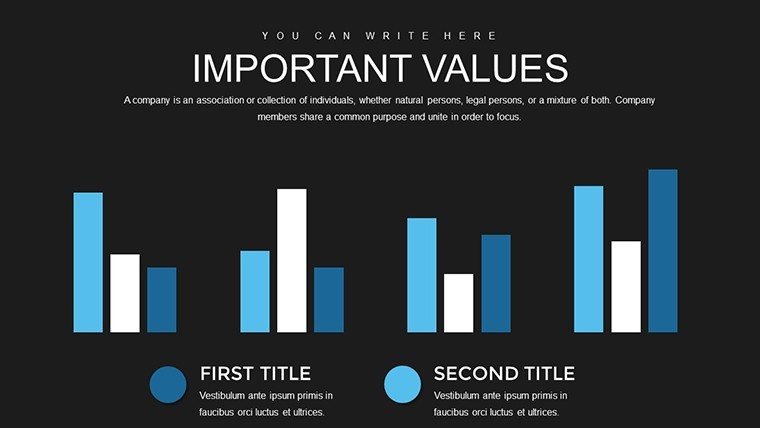
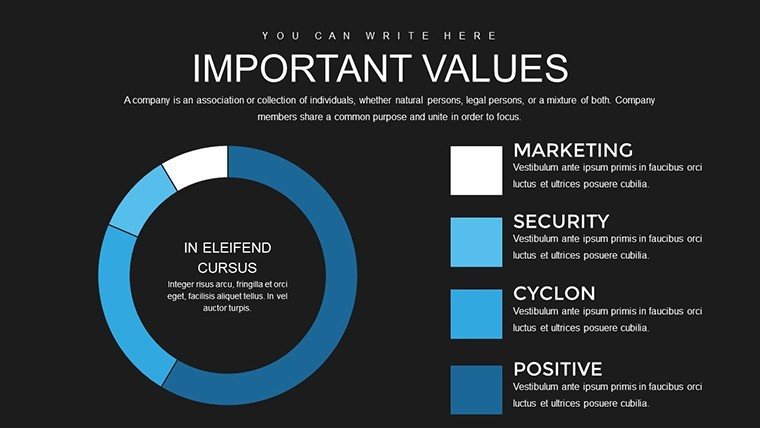
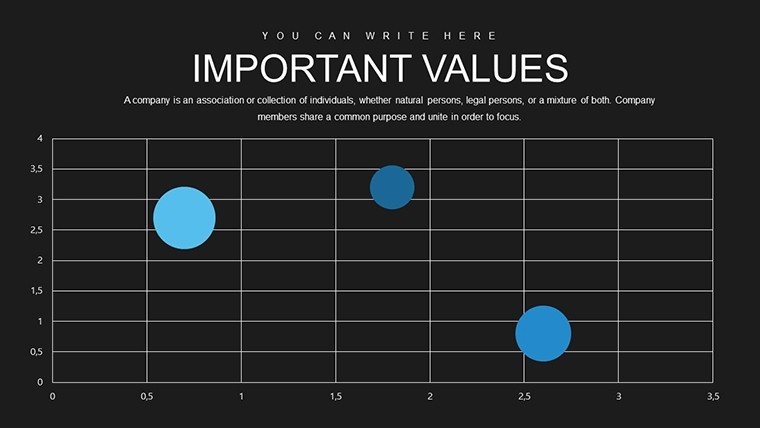
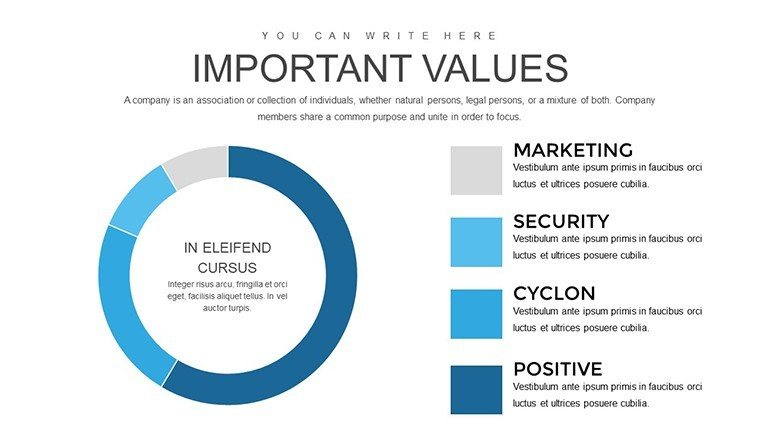
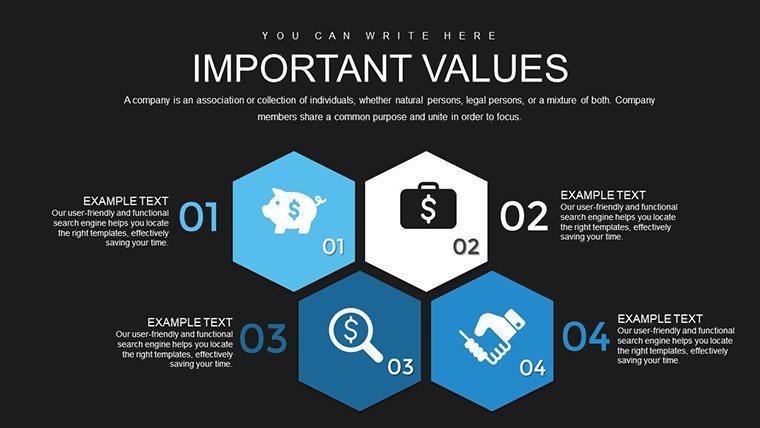
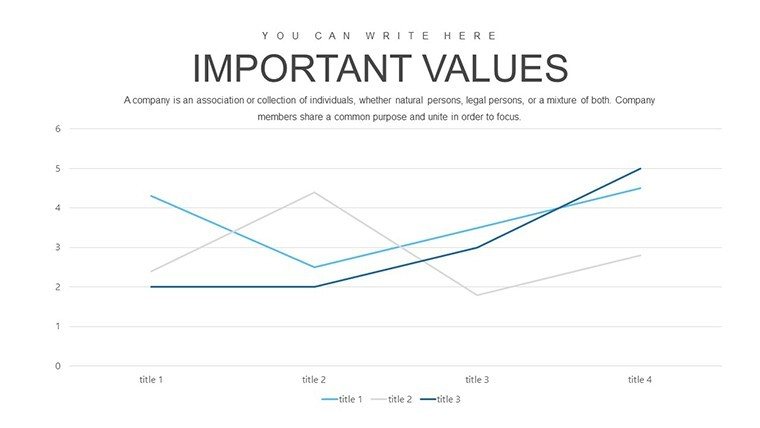
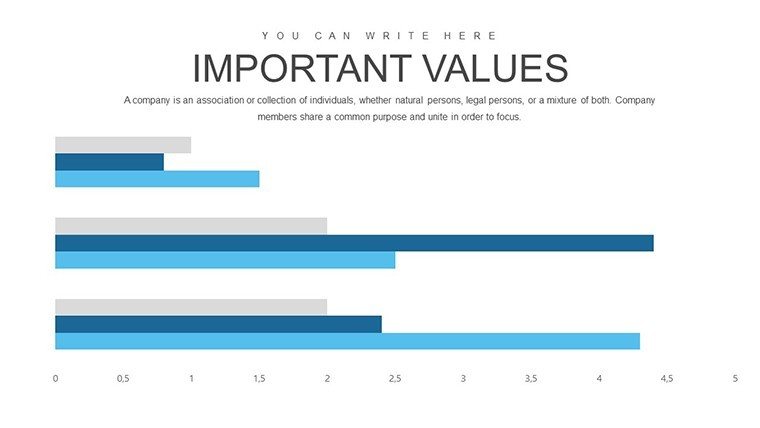
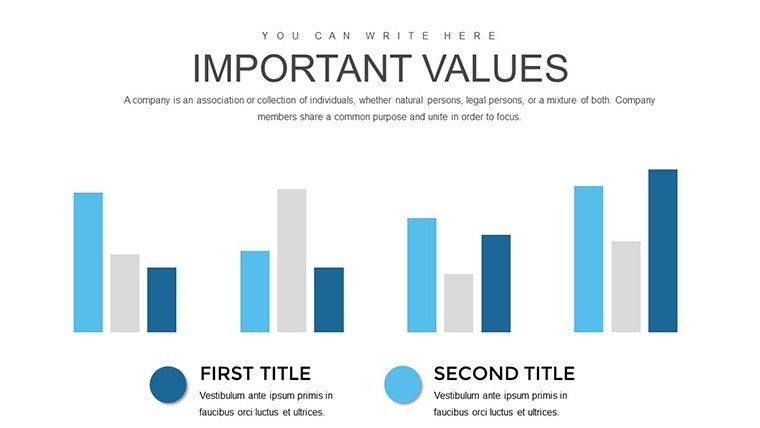
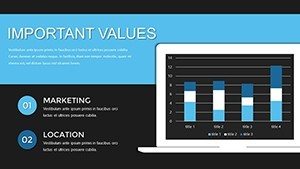
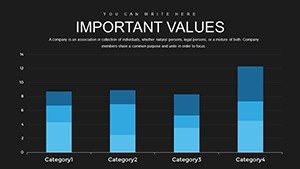
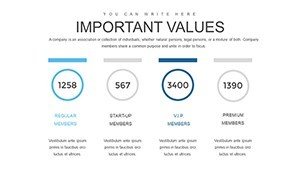
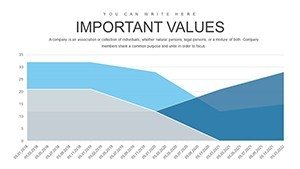
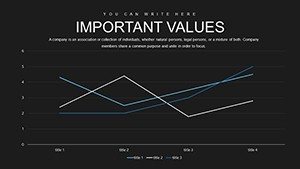
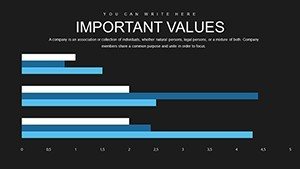
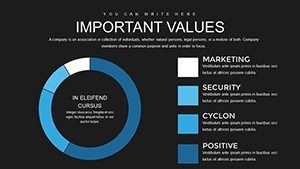
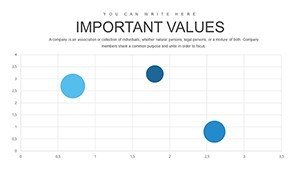
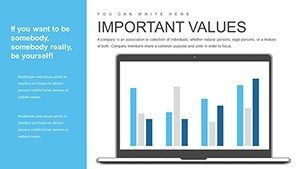
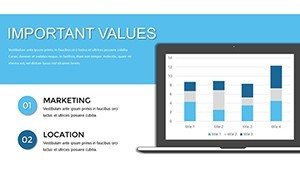
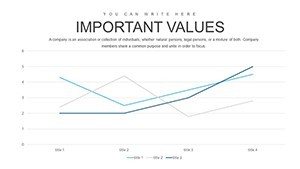
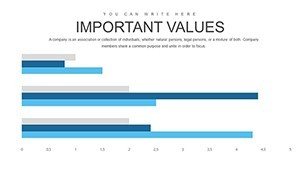
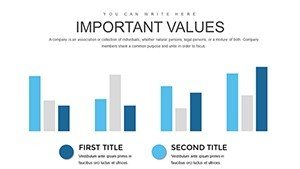
- Varied Data Graphs: Bar, line, pie, and scatter plots for comprehensive modeling.
- Customization Tools: Easy edits for colors, fonts, and data integration.
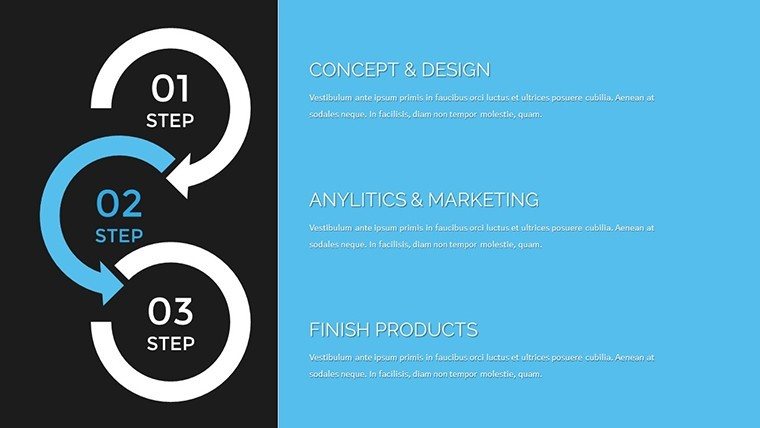
- Strategic Layouts: Flow from data input to insight output.
- 44 Slides: Covering basics to advanced MMM visuals.
- Branding Flexibility: Align with corporate identities effortlessly.
These draw from expert curation, ensuring through proven designs used in cases like Nationwide's modernized MMM, per MMA case study.
Use Cases That Drive Marketing Excellence
For brand managers, chart promotion effects on sales spikes. Analysts can model price elasticity, as in Marketbridge's example where MMM guided pricing strategies. A real-world win: Cura of Sweden boosted conversions 82% via MMM optimization, using visuals similar to our template's attribution charts.
In team huddles, use bubble charts for multi-channel analysis, fostering collaborative decisions. Educators teaching MMM can leverage these for classroom demos, enhancing understanding of econometric models.
Implementing the Template Step-by-Step
- Import your dataset into designated placeholders.
- Select graph types based on variables (e.g., line for trends).
- Customize aesthetics for audience appeal.
- Add annotations for key insights.
- Present with confidence, using built-in transitions.
Integrate with tools like Excel for live data links, keeping models current.
Advantages for Marketing Professionals
This template outperforms basic charts by offering layered visuals for complex MMM, reducing analysis time. Users report sharper insights, akin to Cassandra MMM's role in brand internationalization. For trustworthiness, it's backed by industry-aligned designs.
Compared to free alternatives, our expert layouts provide depth, like decomposition charts for factor isolation.
Pro Tips for MMM Mastery
Layer multiple graphs for holistic views; use colors to denote mix elements. From the Nationwide case, incorporate external factors like economic indicators for robust models. Ensure charts are mobile-friendly for on-the-go reviews.
Weave in real data from your CRM for authenticity, boosting presentation credibility.
Transform Data into Decisions Now
Ready to optimize your marketing mix? Download this template and start modeling success today.
FAQ
What data types work best?
Sales, spend, and external variables for accurate modeling.
Is customization beginner-friendly?
Yes, intuitive interface with drag-and-drop.
Can it handle large datasets?
Optimized for efficiency, but link to external sources for big data.
Are there MMM-specific charts?
Yes, including attribution and elasticity graphs.
How to update for new campaigns?
Refresh data placeholders and regenerate visuals.
Compatible with Mac?
Fully, via PowerPoint for Mac.