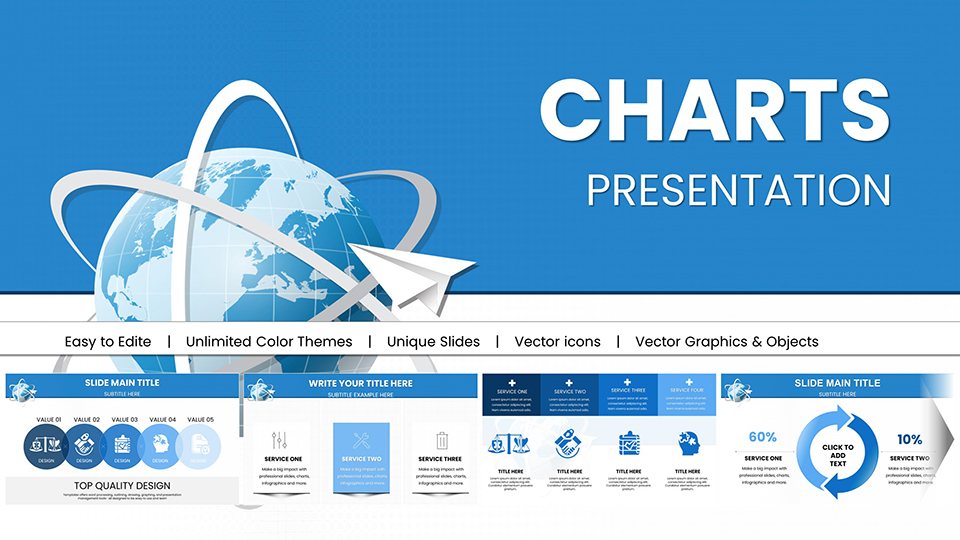
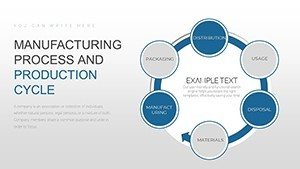
Manufacturing Process PowerPoint Template: Master Production Cycles


Type: PowerPoint Charts template
Category: Business Models
Sources Available: .pptx
Product ID: PC00725
Template incl.: 35 editable slides
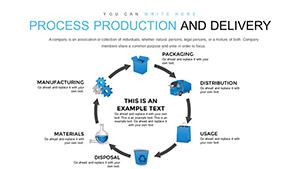
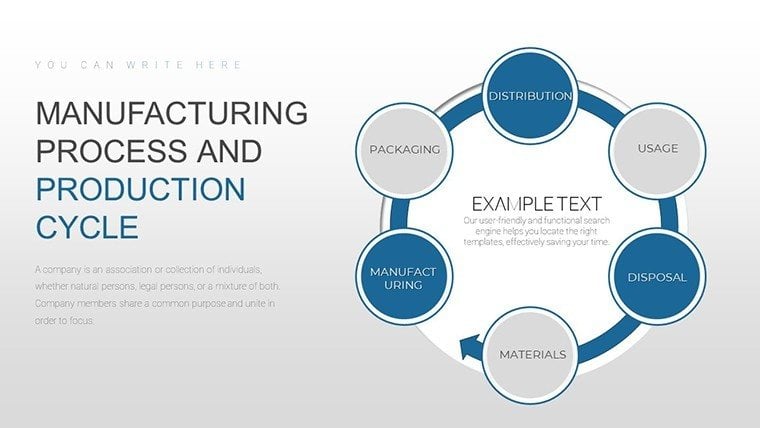
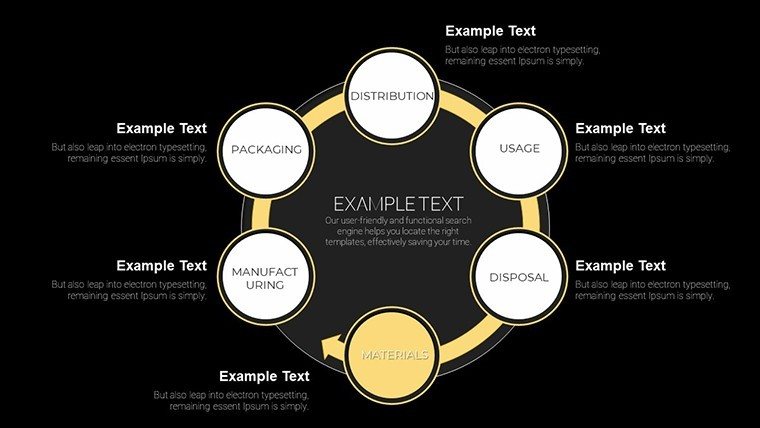
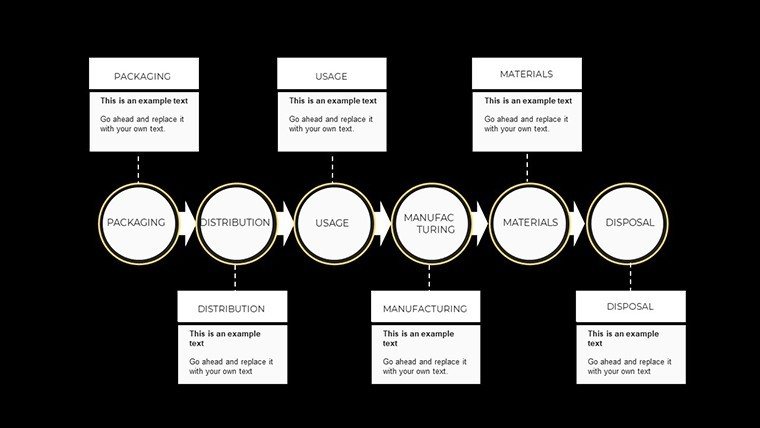
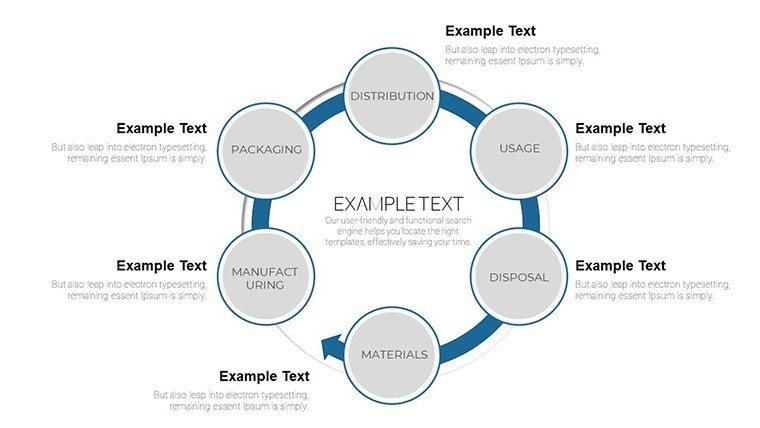
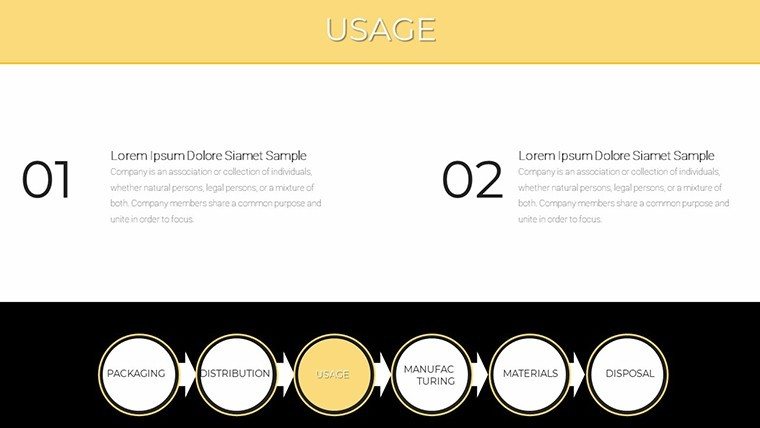
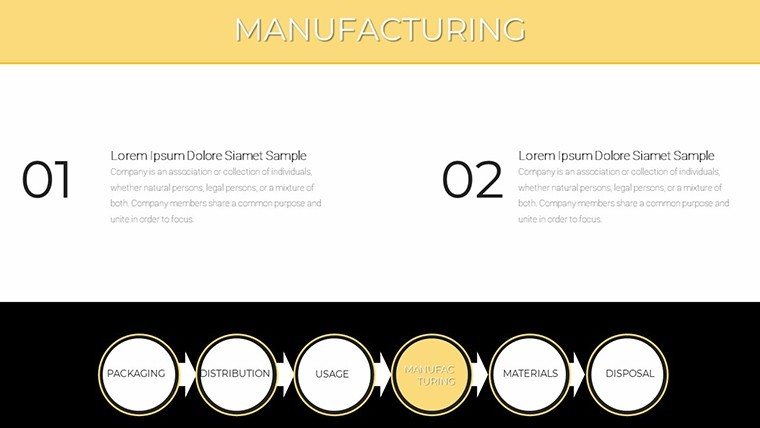
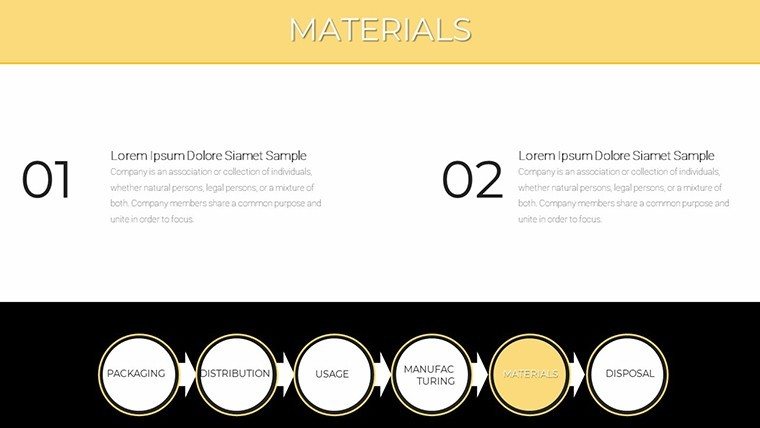
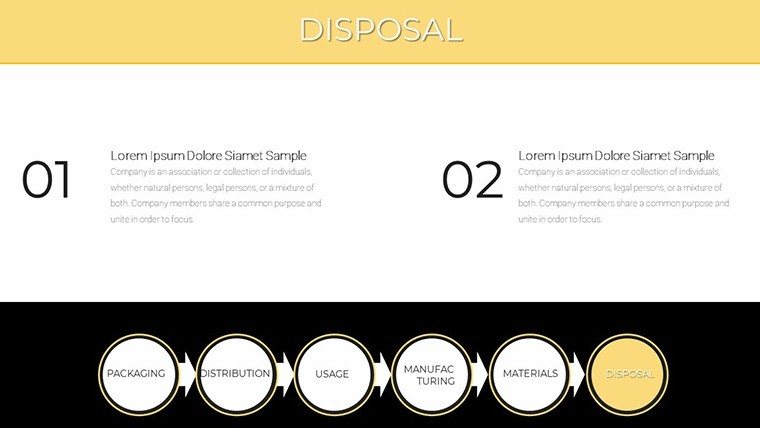
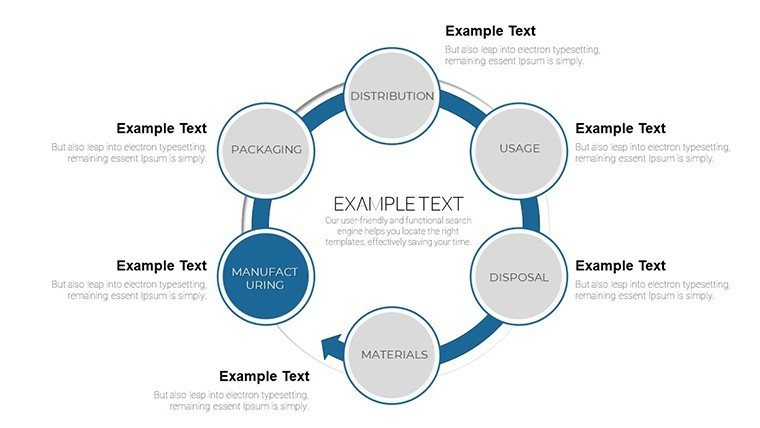
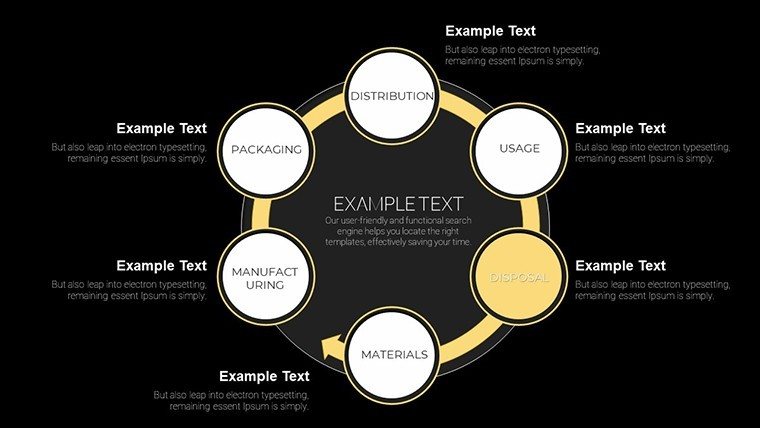
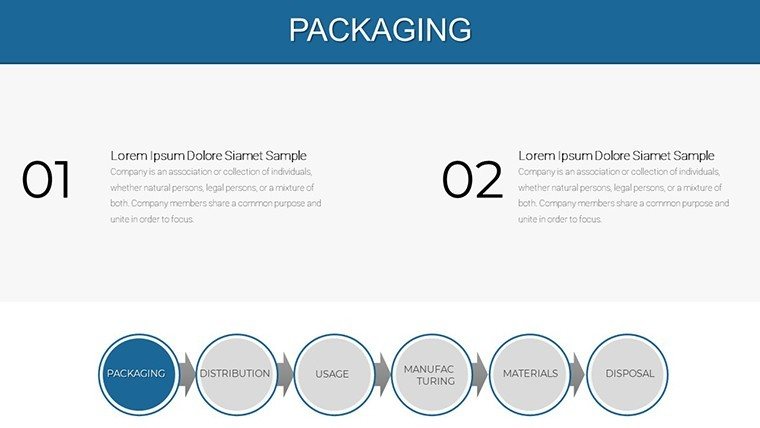
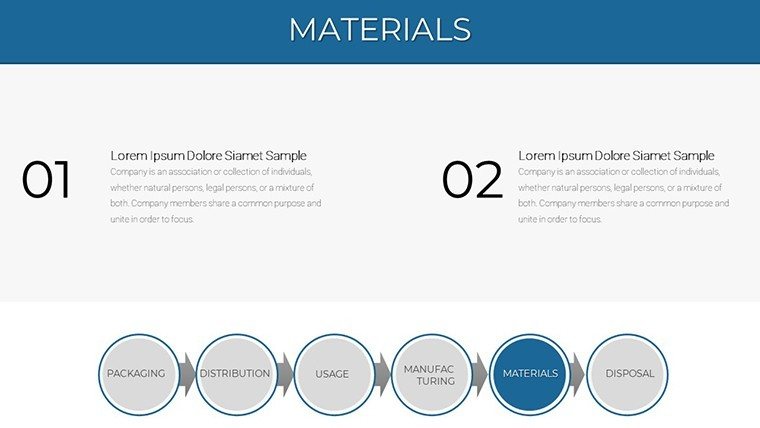
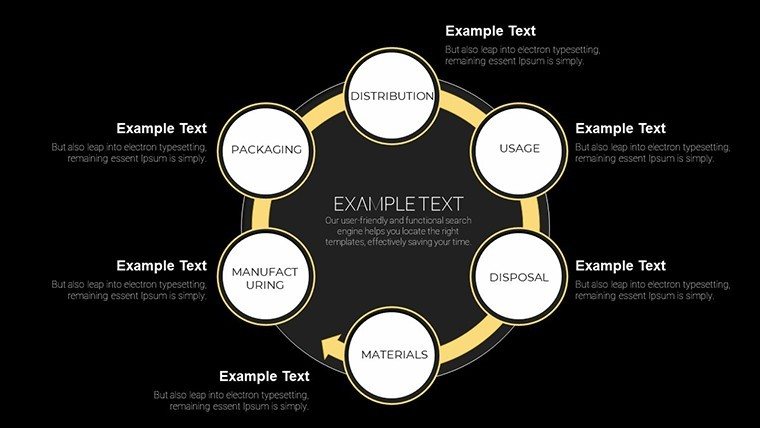
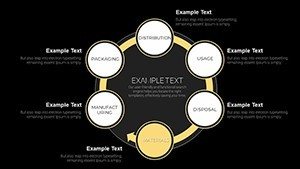
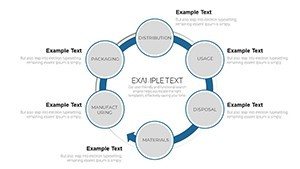
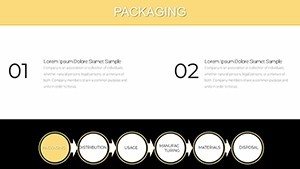
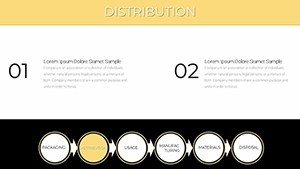
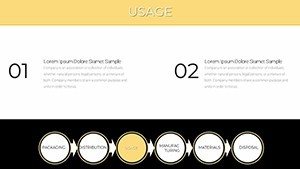
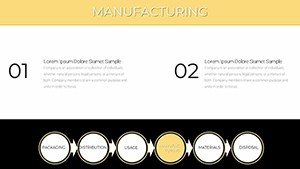
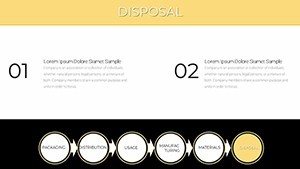
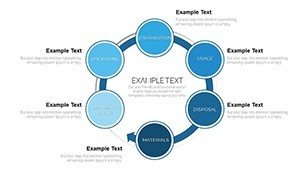
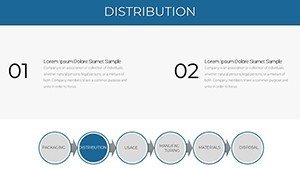
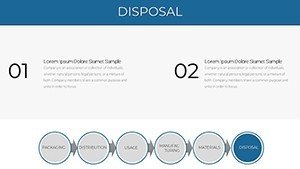
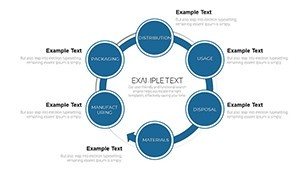
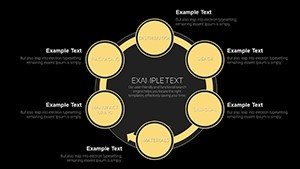
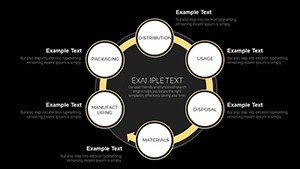
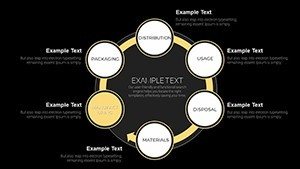
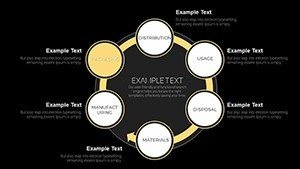
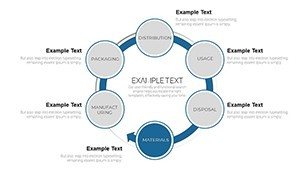
Navigating the intricacies of manufacturing demands tools that cut through complexity. Our Manufacturing Process - Production Cycle Charts Template for PowerPoint is engineered for that purpose, equipping engineers, managers, and analysts with 35 editable slides to depict workflows with precision. From supply chain logistics to quality controls, this .pptx gem turns raw data into polished visuals, ideal for operational reviews or training sessions.
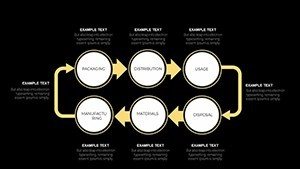
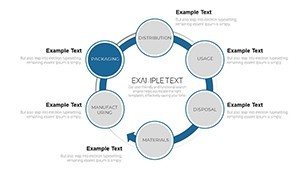
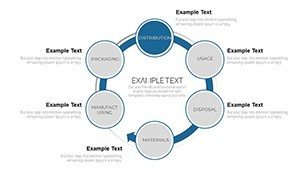
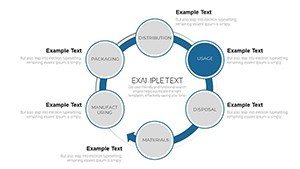
Envision mapping a full production line: raw materials intake at start, assembly in middle, and output metrics at end. Developed with input from industry vets aligned with ISO standards, it ensures compliance and clarity, helping you avoid the pitfalls of convoluted diagrams that confuse rather than convince.
Essential Features for Industrial Excellence
Built for durability in demanding environments, the template includes a comprehensive chart suite tailored to manufacturing needs.
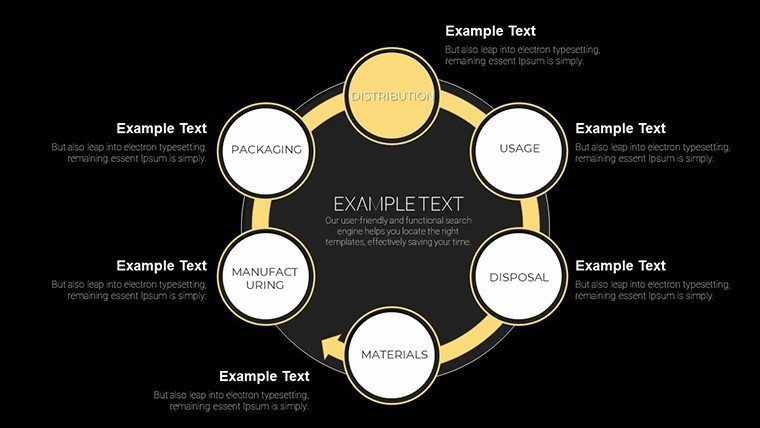
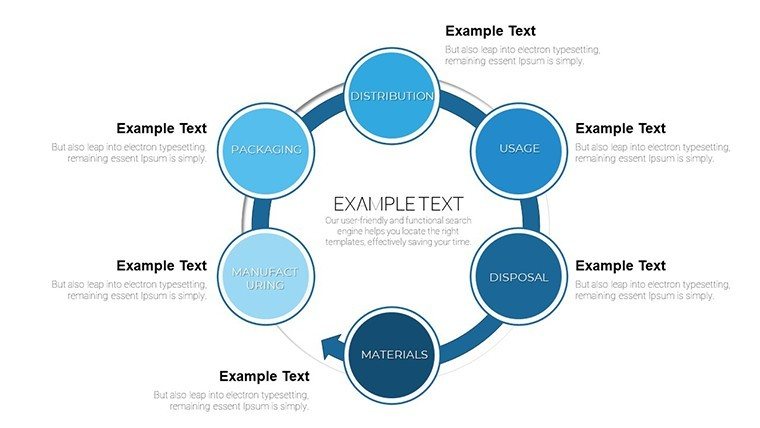
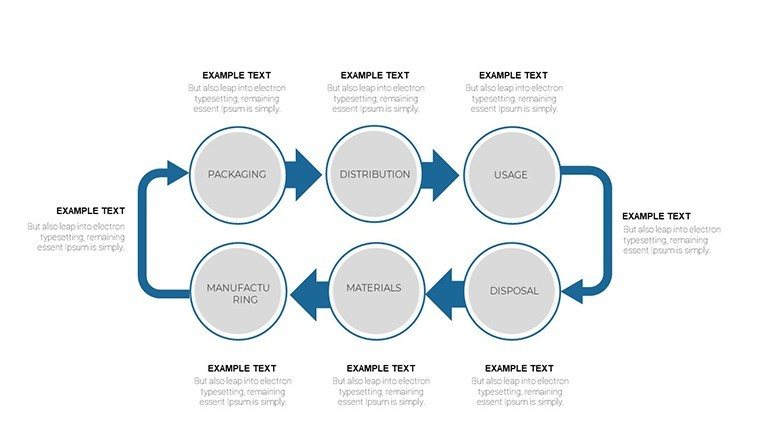
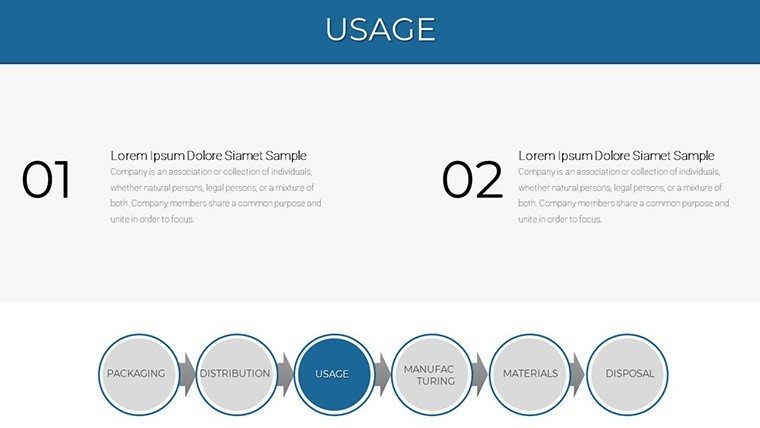
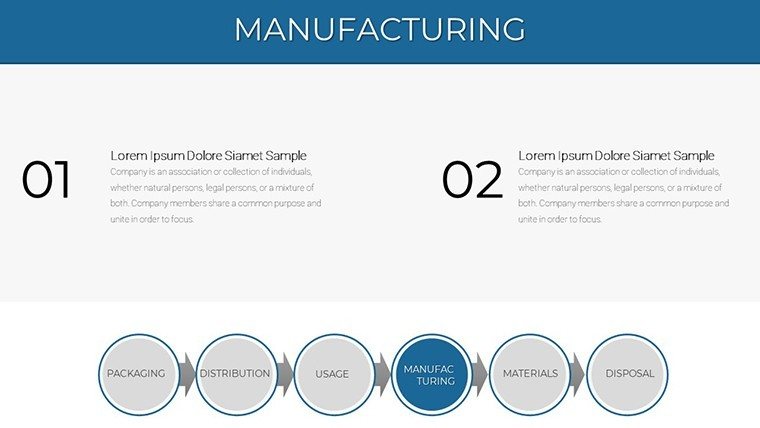
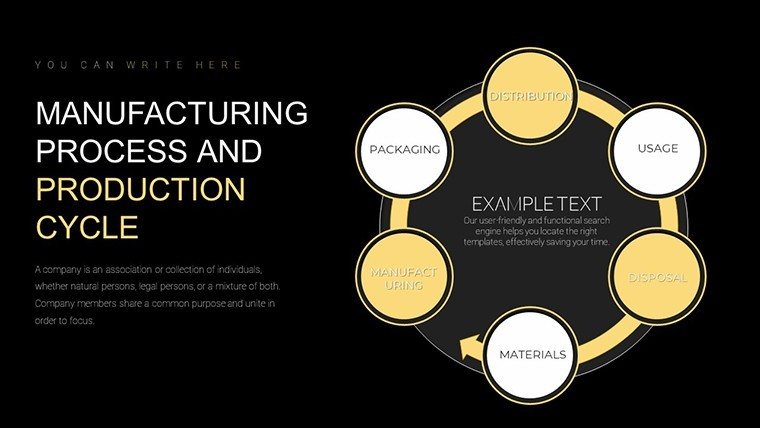
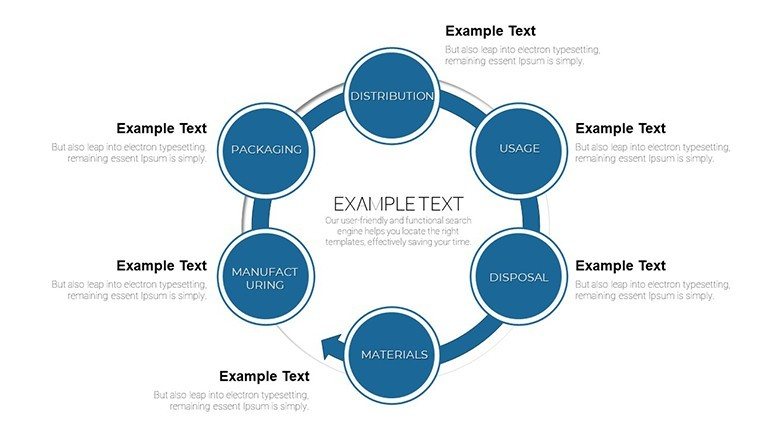
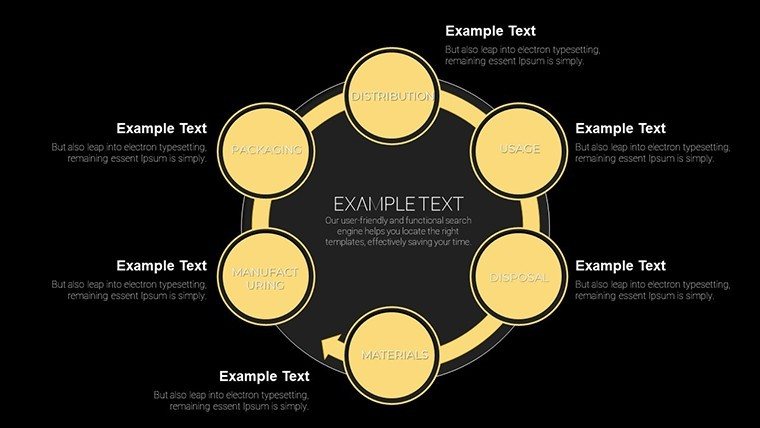
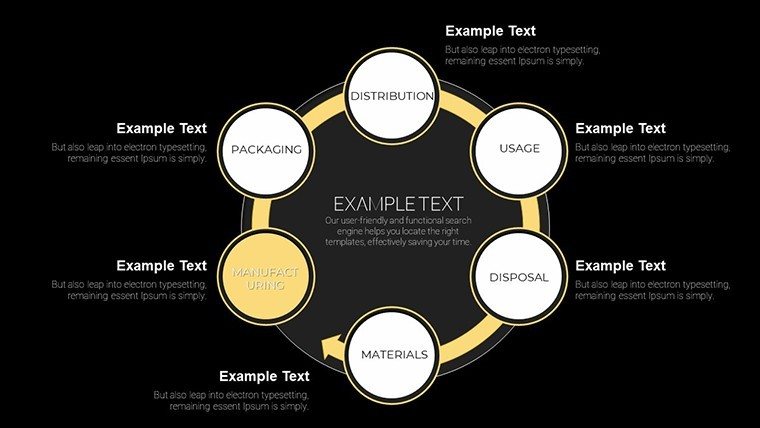
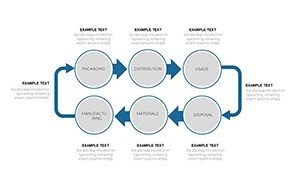
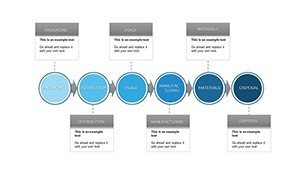
- Flowchart Mastery: Customizable arrows, nodes, and stages for detailed process mapping.
- Efficiency Diagrams: Graphs showing bottlenecks, throughput, and lean metrics.
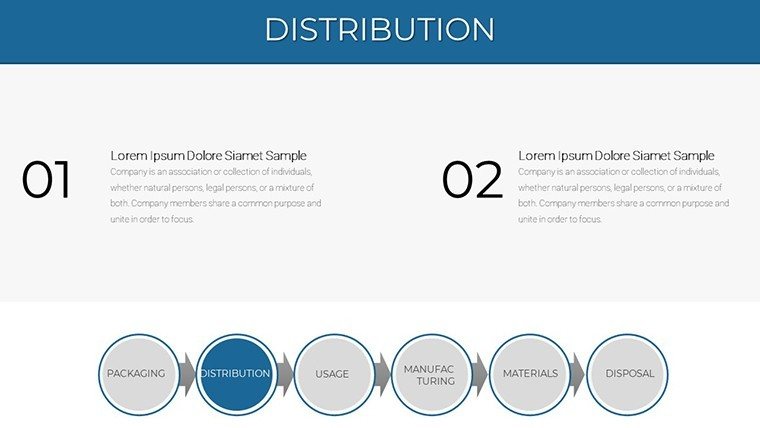
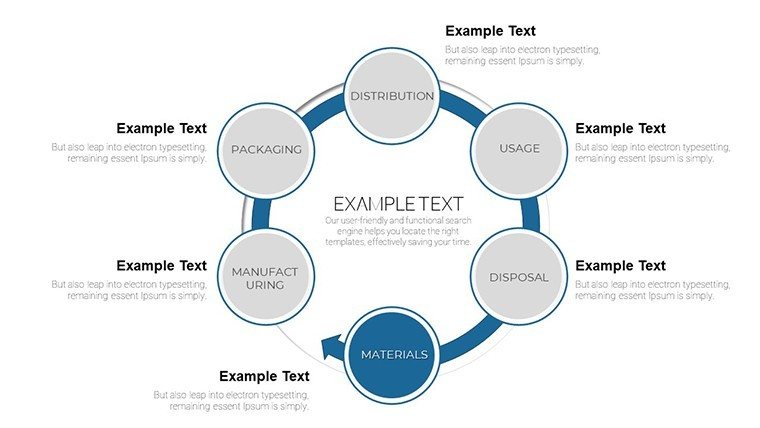
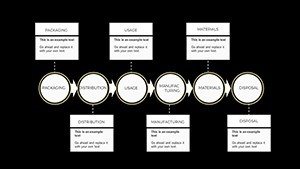
- Supply Chain Visuals: End-to-end representations with editable timelines.
- Quality Metrics: Pie charts and bars for defect rates and performance KPIs.
- Cross-Platform Support: Perfect for PowerPoint, Google Slides, and beyond.
These features tackle everyday challenges, like visualizing lean transformations, with tools that adapt to your data inputs effortlessly.
Applications That Drive Results
In practice, this template powers success stories, such as a automotive supplier using it to optimize assembly lines, slashing downtime by 15% as per Lean Enterprise Institute benchmarks. For educators, it's a boon for simulating factory scenarios.
Key benefits: Accelerate decision-making, foster team alignment, and impress stakeholders with pro-level polish. Outshines basic tools by offering specialized manufacturing icons and data-linked elements.
Implementation Guide: Operational Review
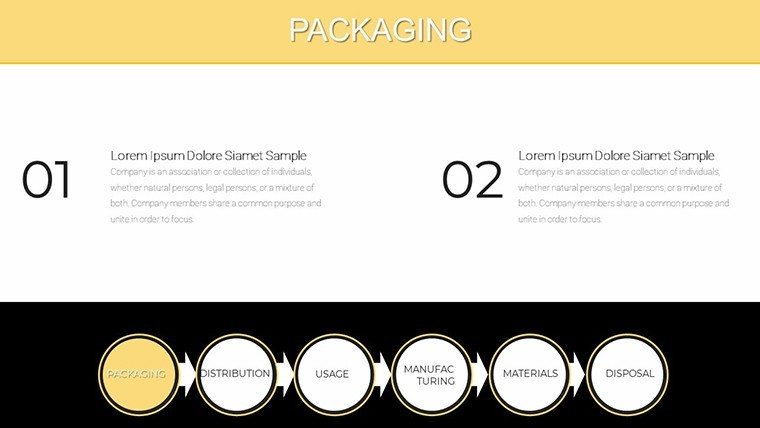
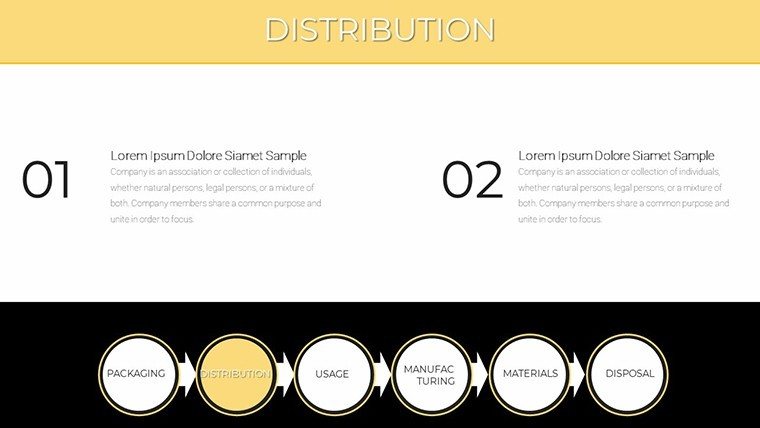
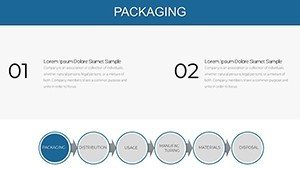
- Initialization: Select a flowchart slide and label stages with your process steps.
- Data Infusion: Link to Excel for real-time metrics updates.
- Refinement: Color-code for risks, adding notes for context.
- Execution: Present in meetings, using animations for step reveals.
- Optimization: Iterate based on feedback for continuous improvement.
This methodical approach ensures your presentations not only inform but catalyze change.
Insights for Peak Performance
Enhance with tips like using Gantt-style integrations for timelines or Six Sigma alignments for quality charts. Naturally incorporate terms like "value stream mapping" for depth. Pair with software like ERP systems for dynamic data flow.
Feedback highlights 50% faster slide prep, freeing time for strategy over setup.
This template is your ally in manufacturing mastery, blending form and function for unbeatable outcomes.
Launch Your Efficiency Boost
Transform processes today - download and deploy for presentations that propel progress.
FAQ
How do I edit flowcharts?
Simply click elements to resize, recolor, or add text.
Supports Google Slides?
Yes, full compatibility with minor font checks.
Can I add custom data?
Absolutely, via embedded charts or external links.
Ideal for which industries?
Manufacturing, logistics, and related fields.
Are updates available?
Check our site for version enhancements.
License details?
Unlimited use post-purchase, no resale.