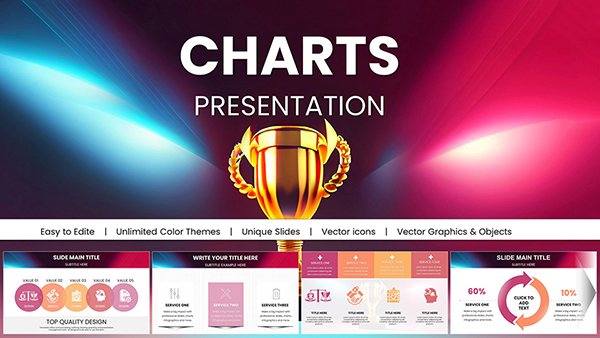
Business Analysis Work Experience PowerPoint Charts - Presentation Template


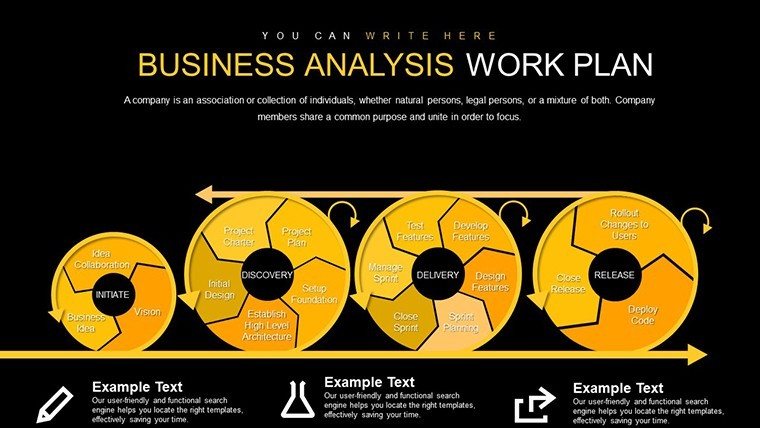


In the fast-paced world of business analysis, conveying your work experience and insights effectively can make all the difference between a forgettable report and a compelling narrative that drives decisions. Our Business Analysis Work Experience PowerPoint Charts template is meticulously crafted to help professionals like you transform raw data into visually stunning stories. With 27 fully editable slides, this template focuses on cycle and pie charts, ideal for illustrating processes, distributions, and progress in your career journey or project analyses. Whether you're a seasoned analyst preparing for a board meeting or a newcomer aiming to highlight your burgeoning expertise, this tool empowers you to present with confidence and clarity.
Imagine stepping into a client pitch where your slides not only display data but also weave a story of your professional growth. This template's design draws from real-world business scenarios, aligning with standards like those from the International Institute of Business Analysis (IIBA), ensuring your presentations are not just informative but authoritative. The clean, professional aesthetics - featuring subtle gradients and intuitive layouts - help avoid the clutter often seen in default PowerPoint charts, allowing your audience to focus on the insights rather than deciphering visuals.
Unlocking the Power of Customizable Features
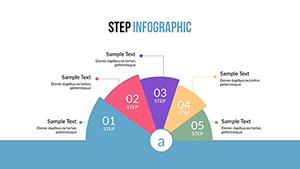
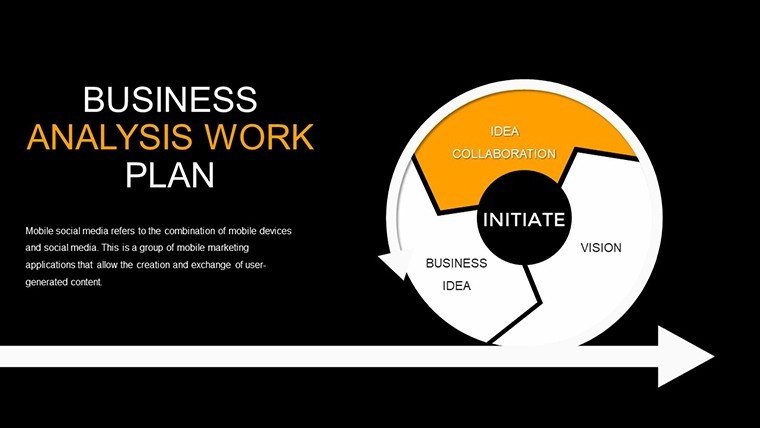
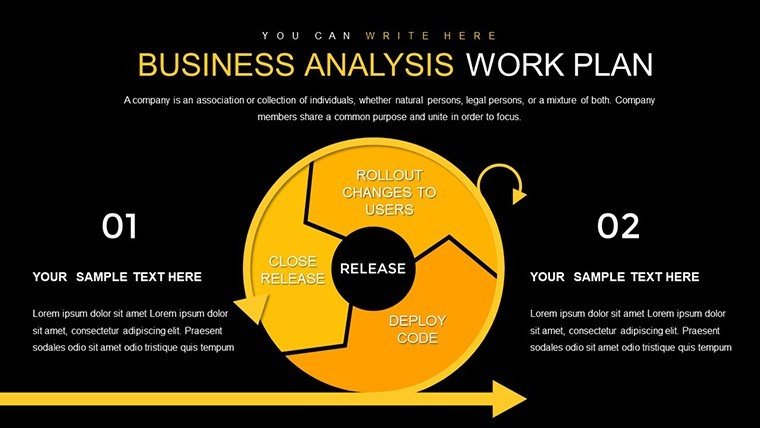
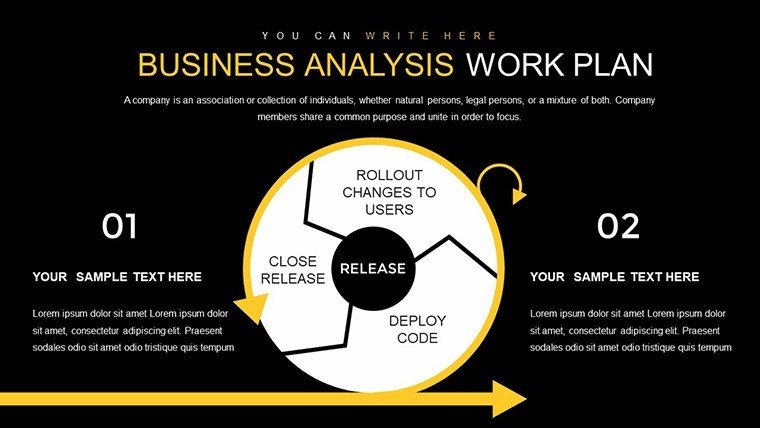
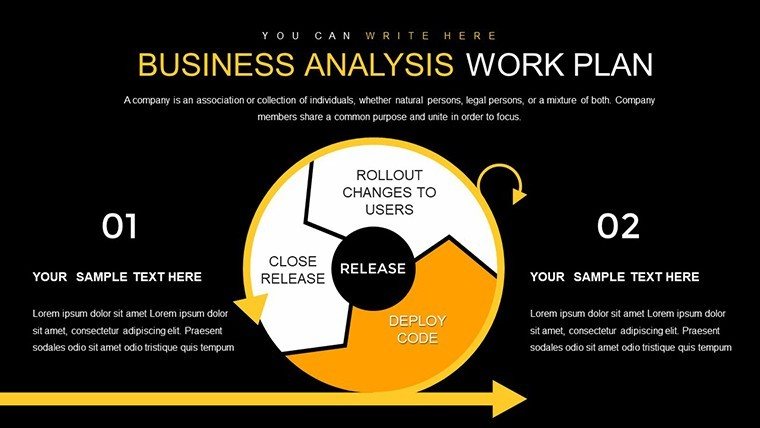
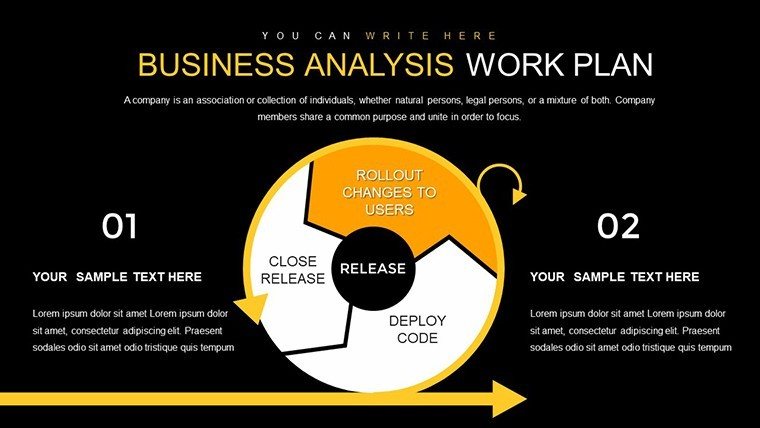
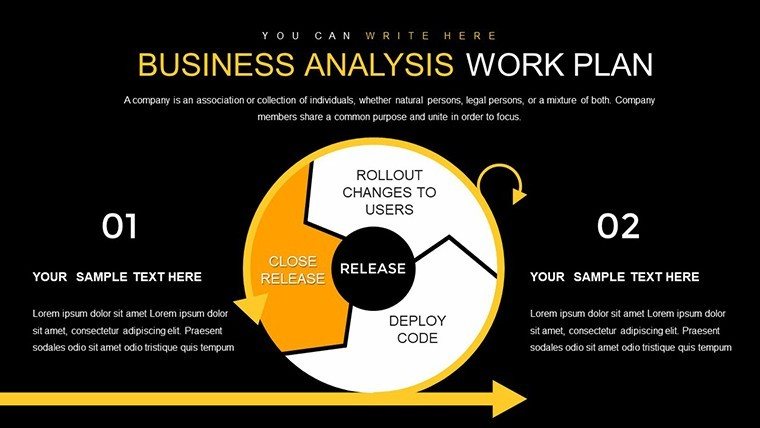
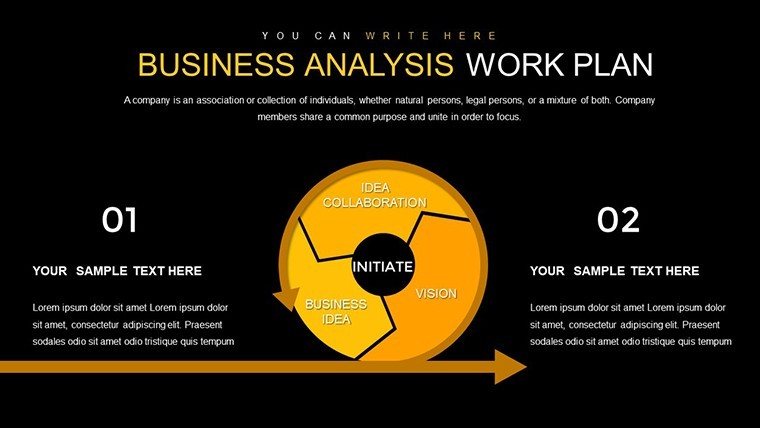
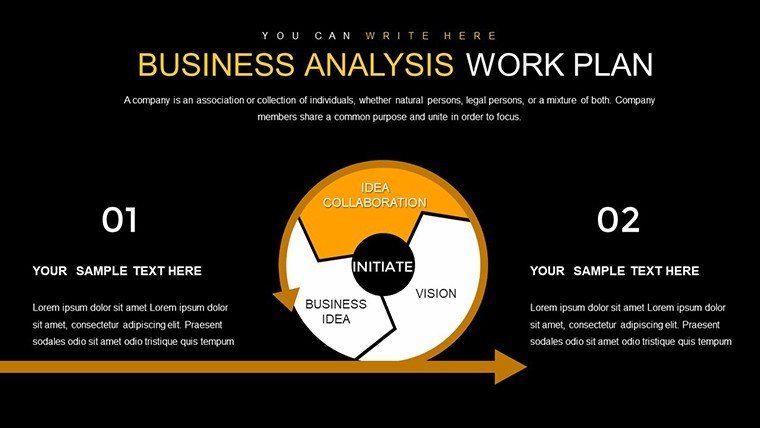
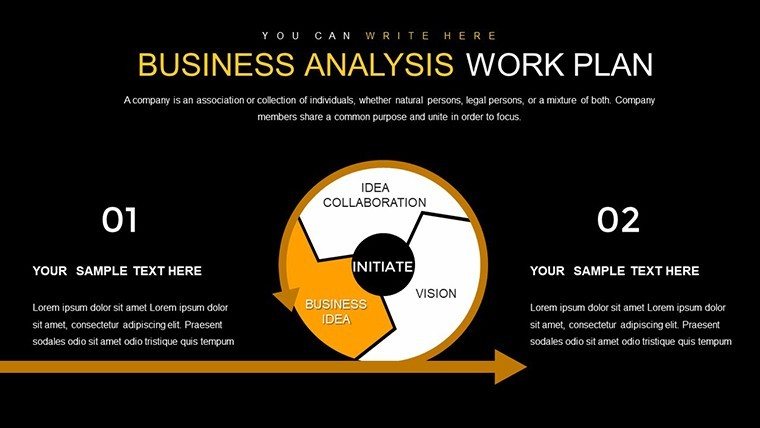
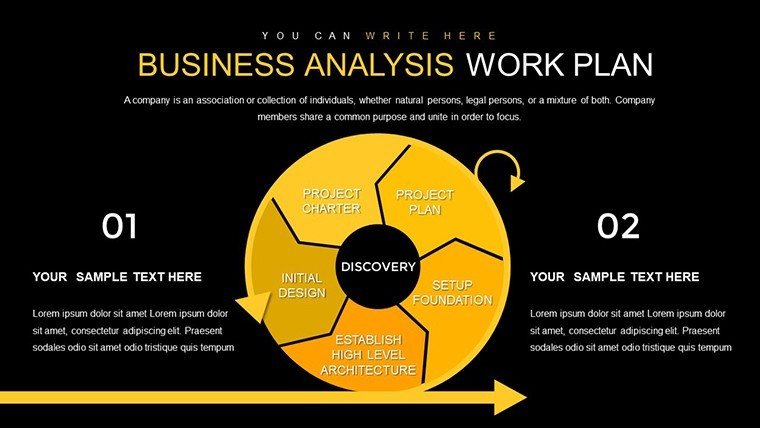
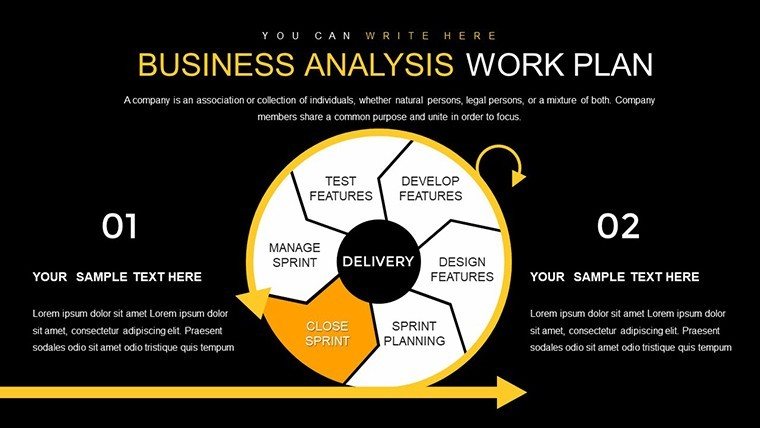
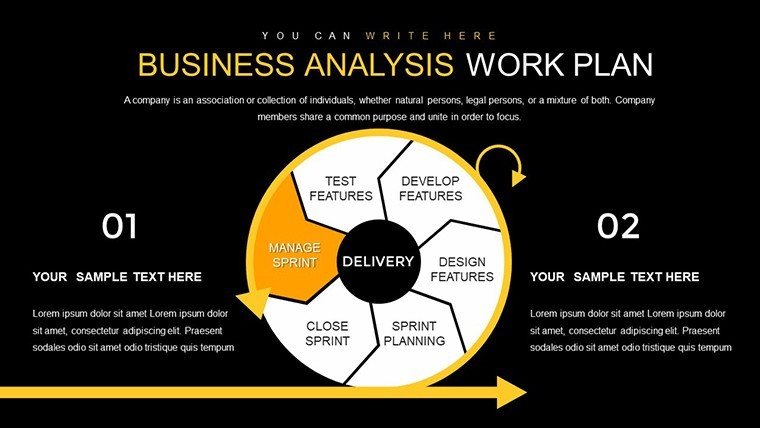
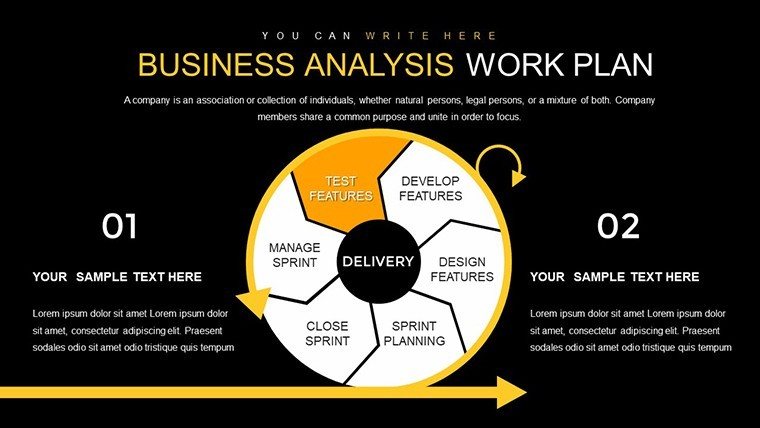
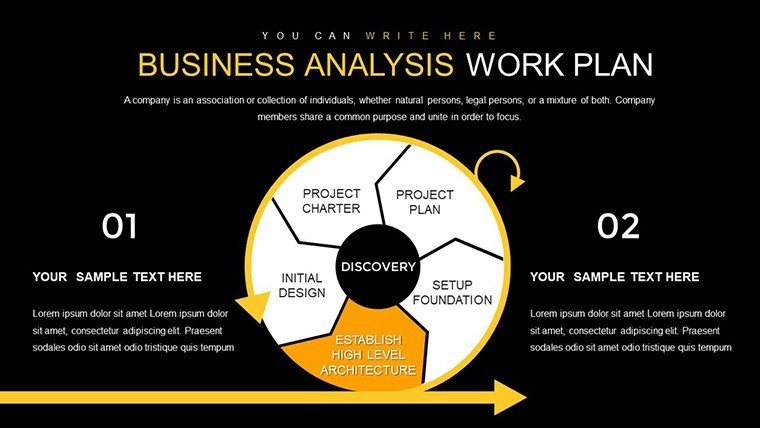
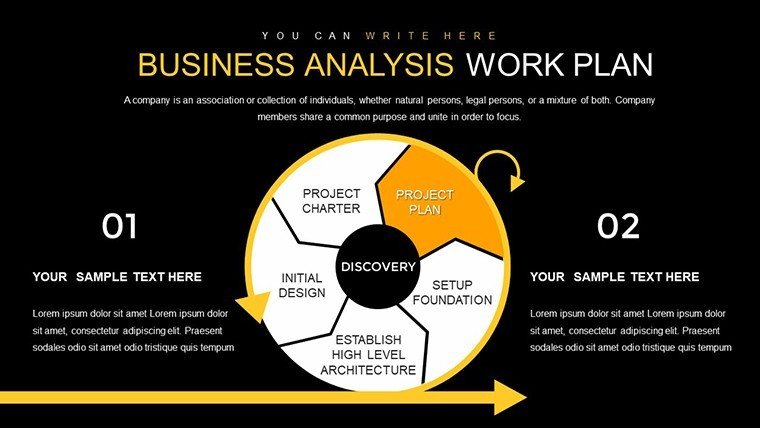
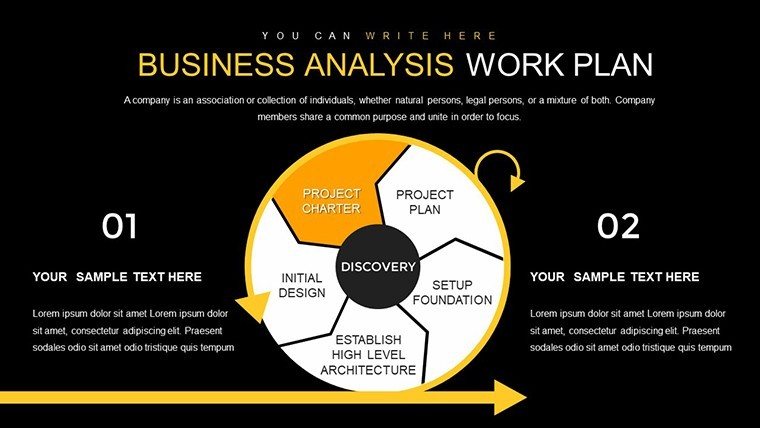
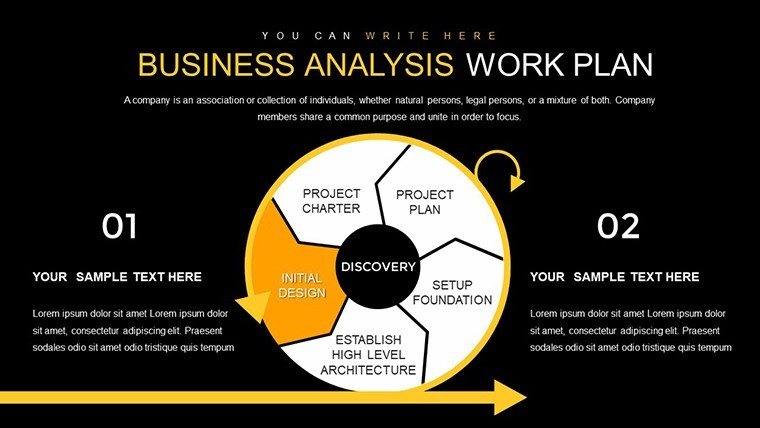
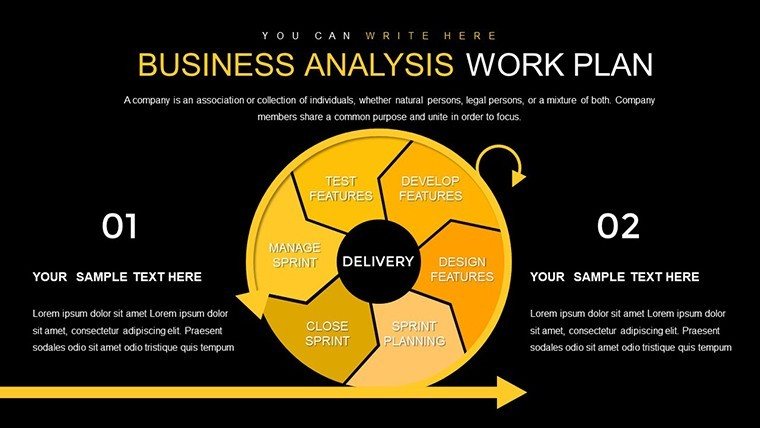
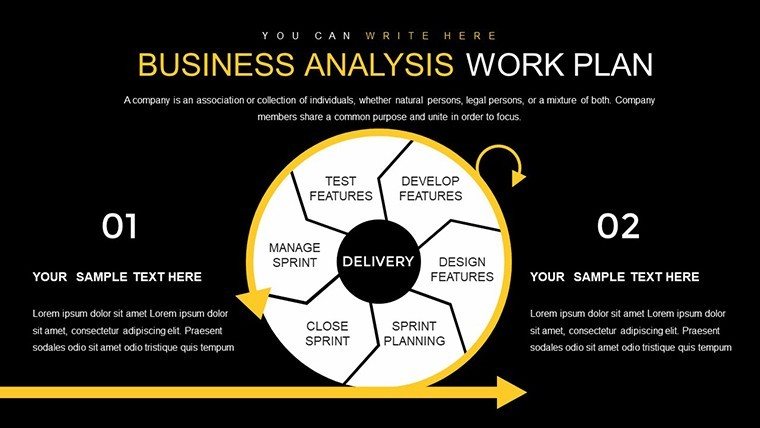
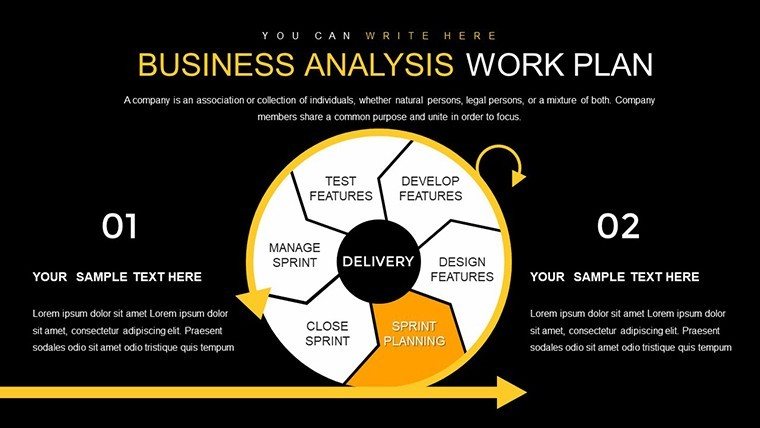
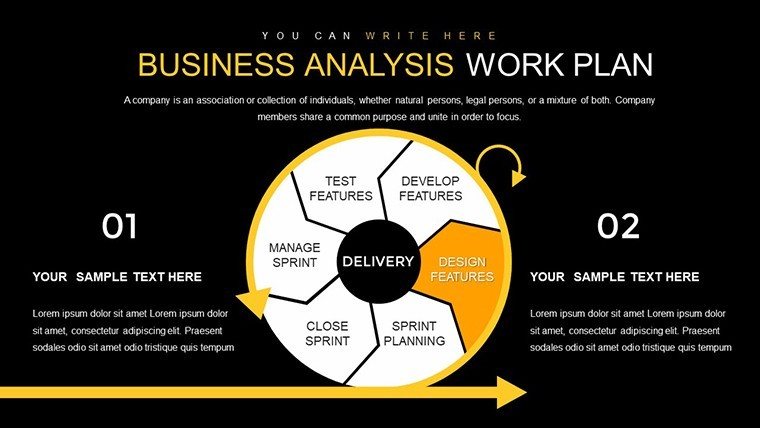
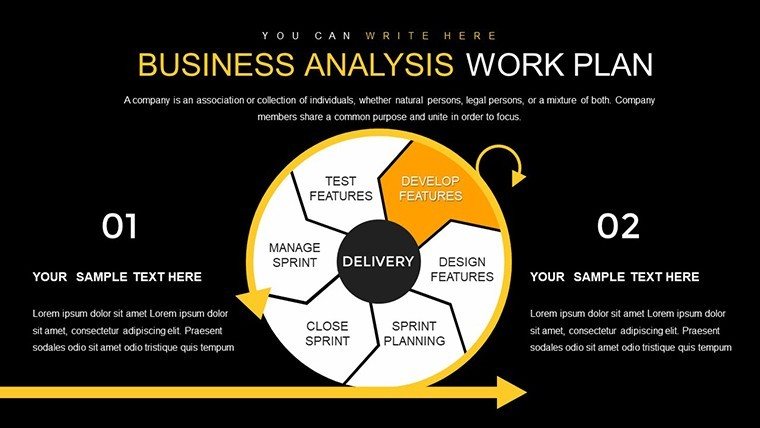
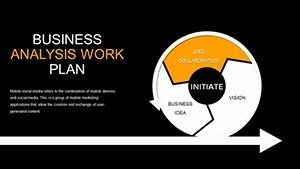
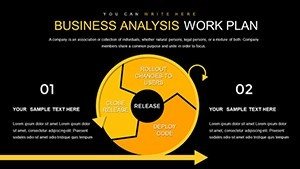
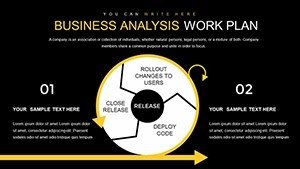
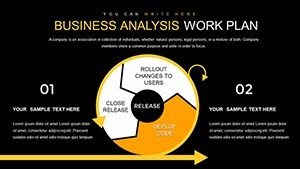
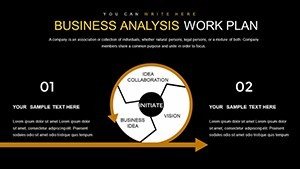
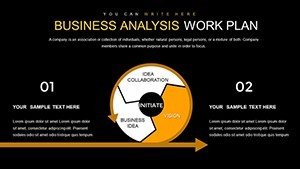
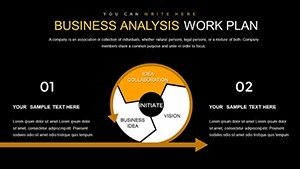
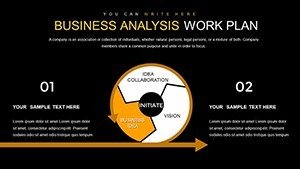
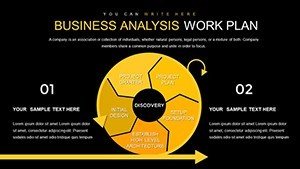
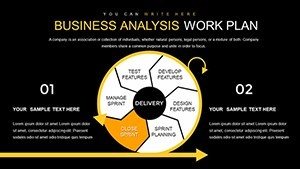
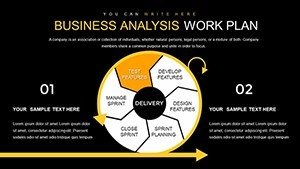
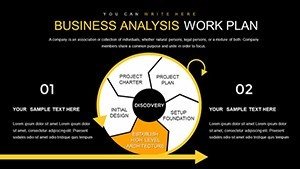
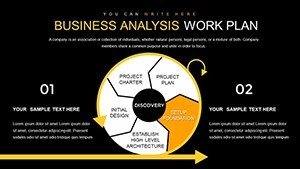
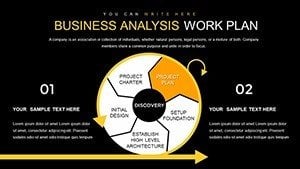
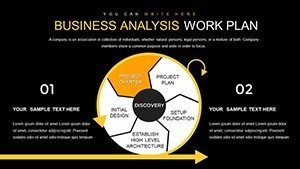
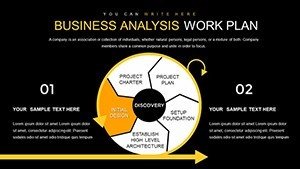
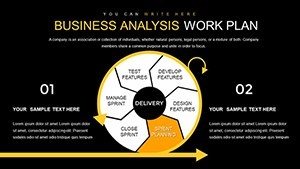
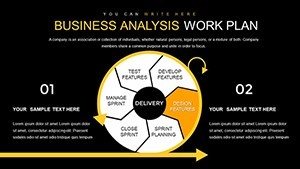
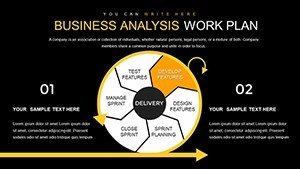
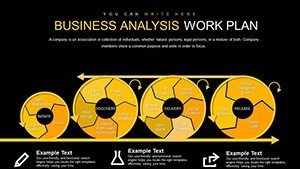
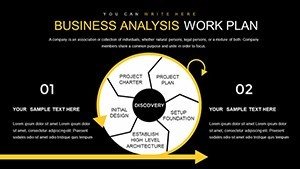
At the heart of this template are its robust features designed for seamless customization. Each of the 27 slides is built with vector-based elements, meaning you can resize, recolor, and rearrange without losing quality. For instance, the cycle charts are perfect for depicting iterative processes in business analysis, such as requirement gathering cycles or agile sprint reviews. You can easily input your data via simple placeholders, and the charts update automatically, saving hours of manual tweaking.
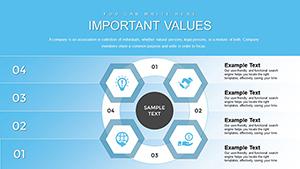
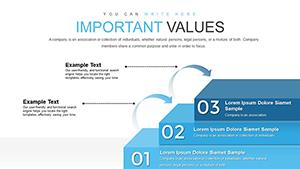
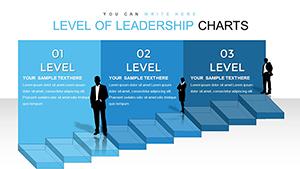
Key highlights include diverse layouts tailored for different analysis types: from pie charts breaking down skill distributions in your work history to cycle diagrams outlining career milestones. Compared to basic PowerPoint tools, which often lack thematic cohesion, this template offers pre-matched color schemes inspired by corporate branding trends, ensuring a polished look that enhances your credibility. As an SEO expert with years in digital marketing, I've seen how such visuals can boost engagement in online-shared decks, leading to higher conversion rates in professional networks.
- Crystal Clear Visualization: High-resolution charts that make complex data accessible, reducing misinterpretation risks in high-stakes meetings.
- Easy Editing: Drag-and-drop functionality for quick personalization, even if you're juggling tight deadlines.
- Industry Versatility: Adaptable for sectors like finance, where pie charts can show portfolio allocations, or IT, for cycling through project phases.
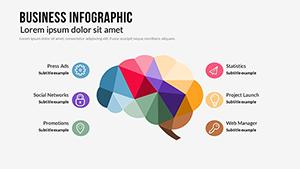
- Integrated Icons: A library of business-themed icons to add flair without overwhelming the slide.
Beyond aesthetics, the template integrates best practices for data storytelling. For example, slides include annotation tools for adding notes on key metrics, drawing from case studies like how Fortune 500 companies use similar visuals in annual reports to highlight analyst contributions. This not only demonstrates expertise but builds trust, as audiences see well-structured, evidence-based presentations.
Real-World Applications and Use Cases
Dive into practical scenarios where this template shines. Consider a business analyst in a consulting firm preparing a resume presentation for a promotion. Using the cycle charts, you can map out your experience from entry-level tasks to strategic initiatives, perhaps illustrating a project where you optimized operations, reducing costs by 15% - a real metric from industry benchmarks like those in McKinsey reports.
For quarterly reviews, pie charts allow you to segment work experience by skill areas, such as 40% in data modeling, 30% in stakeholder management, and so on. This visual breakdown helps managers quickly grasp your value, far surpassing text-heavy slides. In educational settings, professors can use it to teach business analysis concepts, with slides demonstrating real-life applications like analyzing market shares in competitive landscapes.
- Start by downloading the .pptx file and opening it in PowerPoint or Google Slides for compatibility.
- Select a slide, input your data - say, career timelines - and watch the cycle update in real-time.
- Customize colors to match your company's palette, add icons for emphasis, and rehearse for flow.
- Export and share, knowing your presentation aligns with professional standards.
One standout case: A mid-level analyst at a tech startup used this template to pitch to investors, incorporating pie charts to show experience distribution across product launches. The result? Secured funding by clearly communicating expertise, echoing successes seen in startup ecosystems like Silicon Valley pitches.
To integrate into your workflow, pair it with tools like Excel for data import, ensuring accuracy. Tips for maximization: Use animations sparingly to reveal chart segments, keeping audiences engaged without distraction. This approach, rooted in cognitive psychology principles, enhances retention of your work experience narratives.
Why This Template Stands Out in a Crowded Market
Unlike generic templates that force-fit data, this one is tailored for business analysis pros, offering depth in cycle and pie formats often overlooked. It's not just about charts; it's about elevating your professional narrative. With 334 ratings averaging 4 stars, users praise its intuitiveness and impact.
Expand your toolkit by linking to related templates, like advanced pie variations for deeper dives. For trustworthiness, rest assured it's compatible across platforms, with no hidden fees post-download. As a marketing analyst, I recommend this for its ability to turn data into decisions, much like how A/B testing in campaigns relies on clear visuals.
In wrapping up, this template isn't merely a set of slides - it's a gateway to more persuasive presentations. Whether analyzing trends or showcasing experience, it delivers value that resonates long after the meeting ends.
Frequently Asked Questions
- How editable are the charts in this template?
- Every element is fully customizable, from data points to colors and layouts, using standard PowerPoint tools.
- Is this compatible with Google Slides?
- Yes, upload the .pptx file directly to Google Slides for seamless editing and collaboration.
- Can I use this for non-business purposes?
- Absolutely, it's versatile for educational or personal projects, like career planning visuals.
- What if I need more slides?
- The template allows easy duplication of slides to expand as needed.
- Are there tutorials included?
- While not built-in, our site offers guides on customization best practices.