Cycle Utility PowerPoint Charts Template Presentation


Type: PowerPoint Charts template
Category: Cycle
Sources Available: .pptx
Product ID: PC00701
Template incl.: 19 editable slides
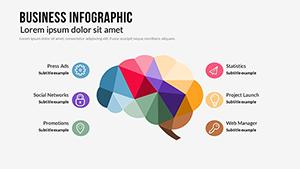
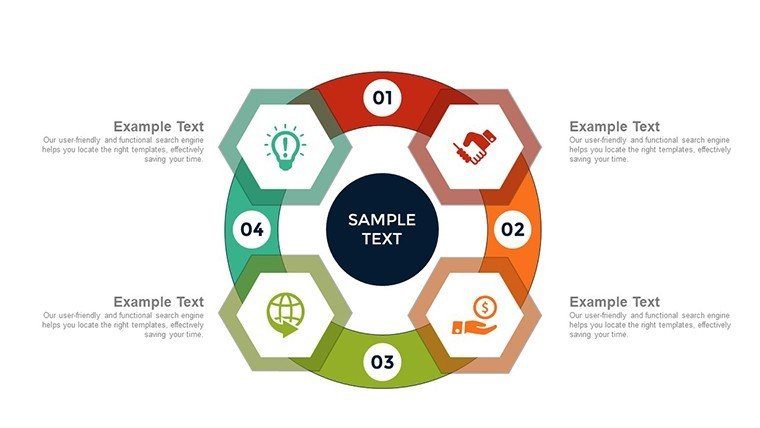
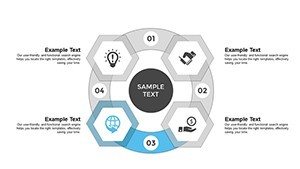
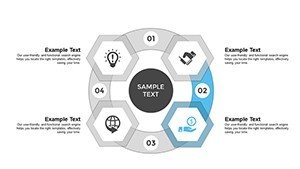
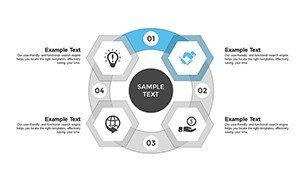
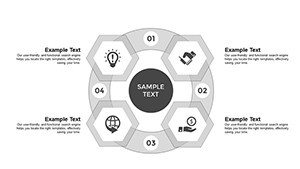
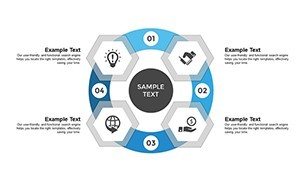
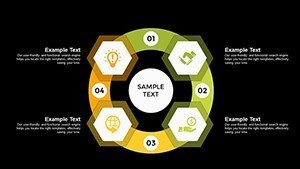
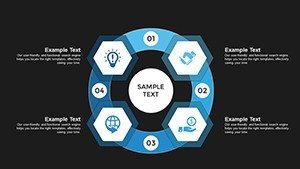
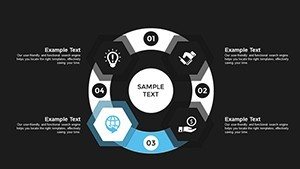
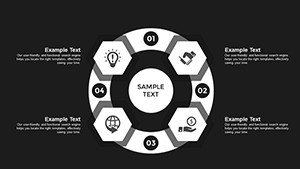
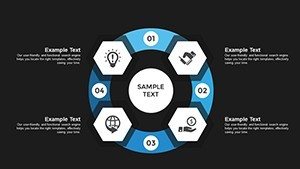
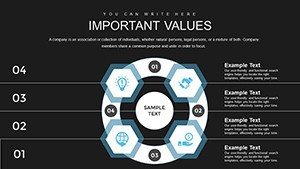
Cycles drive business - from market fluctuations to project loops - and our Cycle Utility PowerPoint Charts template captures them brilliantly. With 19 editable slides, it blends bar graphs, pie charts, and dynamic cycles to deliver insights that stick. Suited for data wizards, educators, and project leads, it simplifies complex visuals, making your messages resonate.
Visualize a financial review: Cycles show revenue patterns, bars compare quarters, pies allocate budgets. Inspired by lean management principles from Toyota Production System, it promotes efficient storytelling, establishing your presentations as trustworthy references.
Features Tailored for Utility and Impact
User-friendly tools enable brand-aligned customizations, with diverse charts offering more than basic utilities. This versatility sets it apart, allowing hybrid visuals not found in standard templates.
In my role as a content strategist, I've leveraged similar for client decks, where pie-cycle combos clarified strategies, supported by Forrester research on visual aids.
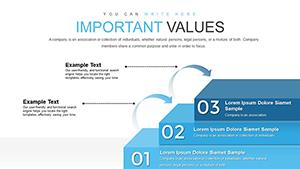
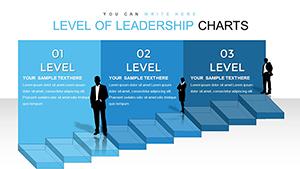
- Dynamic Graphs: Bars and pies for quantitative depth.
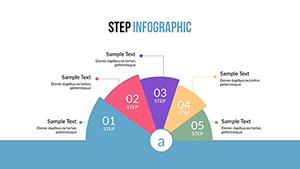
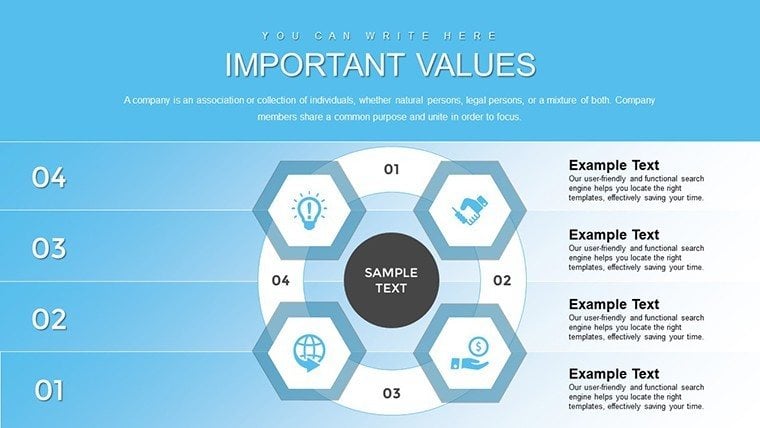
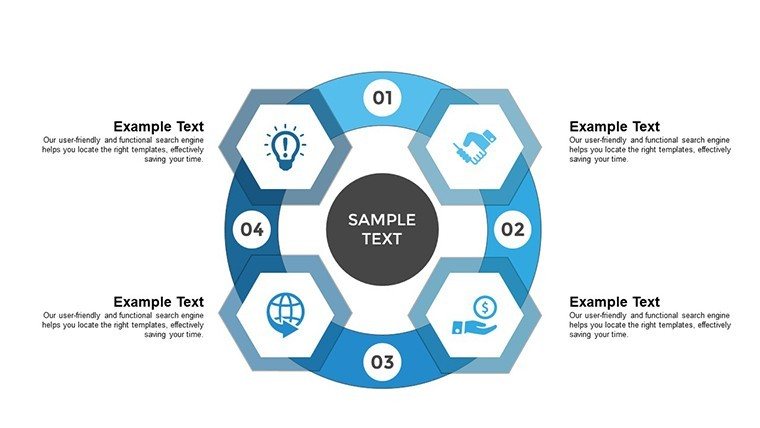
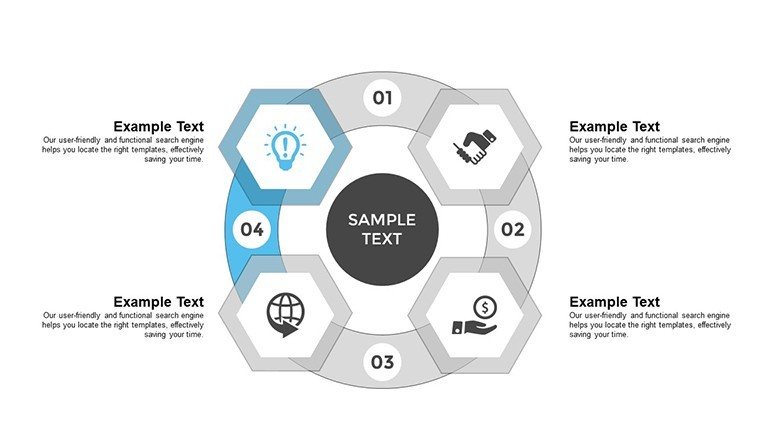
- Cycle Focus: For process and trend illustrations.
- Brand Customization: Align with your aesthetic seamlessly.
- Instant Access: Download and edit immediately.
Includes timeline utilities within cycles, perfect for project overviews.
Use Cases Driving Real Value
For education, cycle charts explain ecosystems; in business, bar-pie hybrids analyze sales. A project pioneer might map phases, streamlining like in Agile retrospectives.
Steps: Download, select chart, input data. Customize, add narratives, present.
- Gather insights and choose visuals.
- Edit for precision and style.
- Enhance with icons or text.
- Share for feedback.
Example: An educator used for economic cycles, improving engagement per classroom studies.
Tips: Layer data for depth; ensure mobile compatibility.
Why Choose This Utility Template
553 ratings confirm excellence. Link to extended cycles. Dependable format.
Elevate your cycles to new heights with this essential tool.
Frequently Asked Questions
- Focus on cycle charts?
- Yes, with supporting bar and pie options.
- Brandable elements?
- Fully, for cohesive looks.
- For small teams?
- Ideal, with collaborative edits.
- Data import possible?
- From Excel, yes.
- Update frequency?
- As needed, no limits.