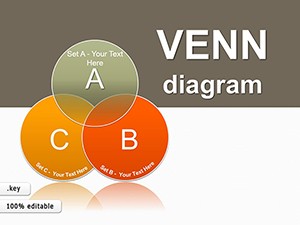
8-Element Venn Diagrams: Keynote Relationship Visuals

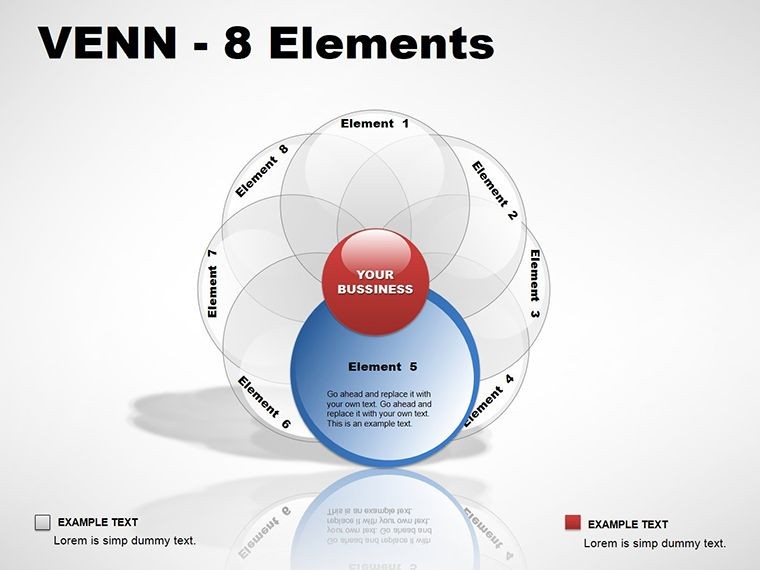

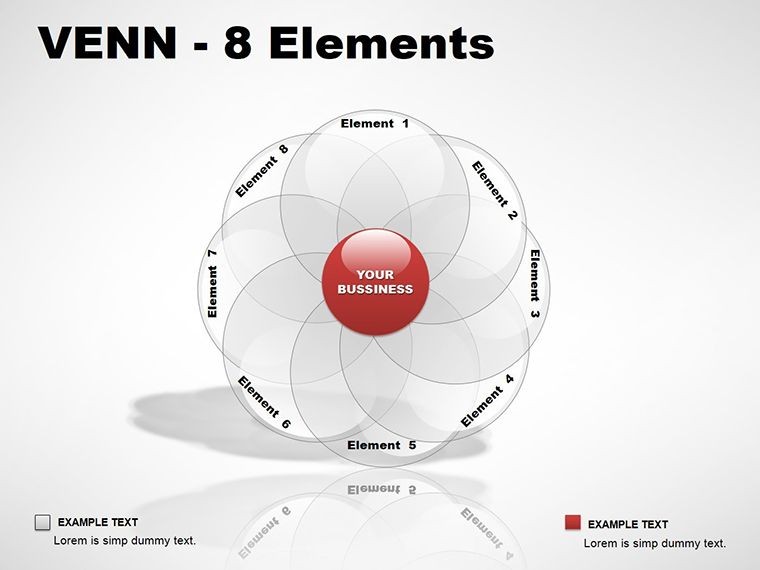

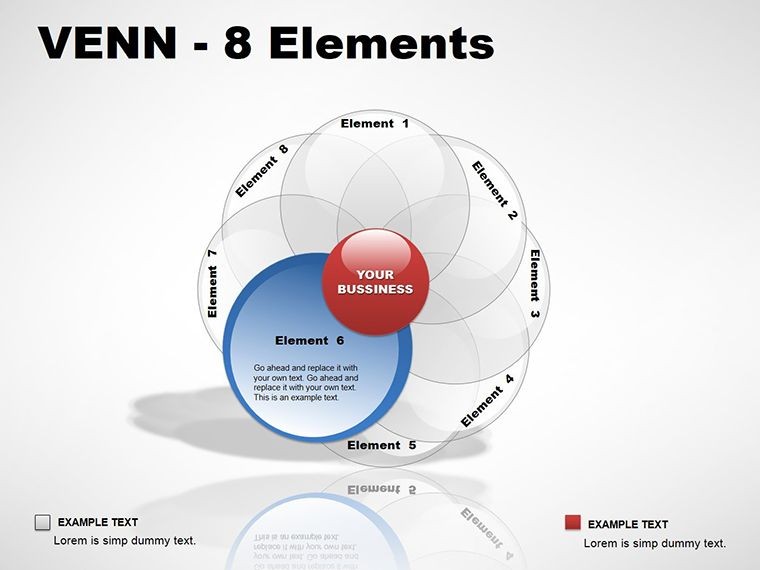


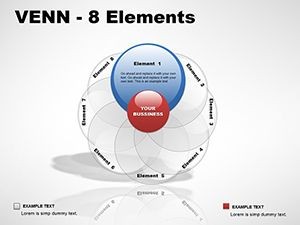
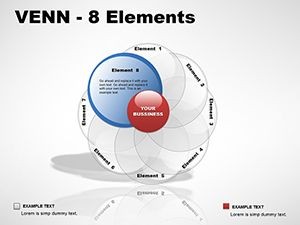
Ever tried explaining how eight distinct ideas intersect without your audience glazing over? Enter the 8-Element Venn Diagrams for Keynote, a collection of 12 slides that masterfully layer superimposed rings to reveal hidden connections. Tailored for thinkers who juggle multifaceted concepts - like researchers mapping interdisciplinary overlaps or marketers dissecting audience segments - these templates transform tangled theories into elegant visuals that spark "aha" moments.
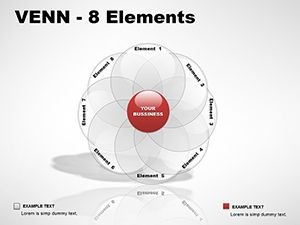
At 12 slides strong, this pack dives deep into relationship structures, where each ring represents a unique element, and their intersections highlight synergies or conflicts. Fully editable in Keynote, you can adjust ring opacities for emphasis, recolor to match your palette, or animate builds to unveil layers progressively. It's like having a Swiss Army knife for diagrams, compatible across macOS versions, ensuring your .key files render crisply on any display.
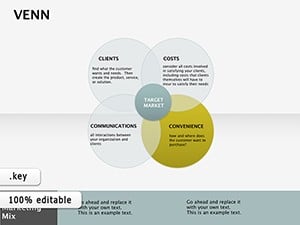
These aren't your basic two-circle overlaps; they're sophisticated eight-ring constructs that handle complexity with grace, perfect for processes where actions evolve through mutual influences. A slide might show customer personas intersecting with product features, instantly clarifying customization opportunities.
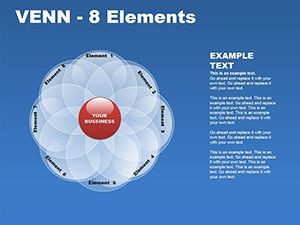
Standout Features for Layered Storytelling
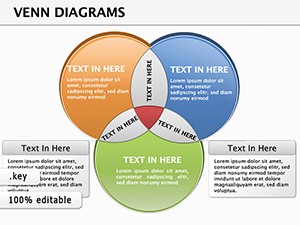
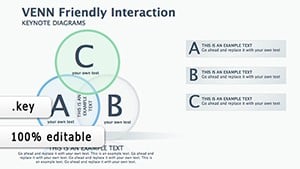
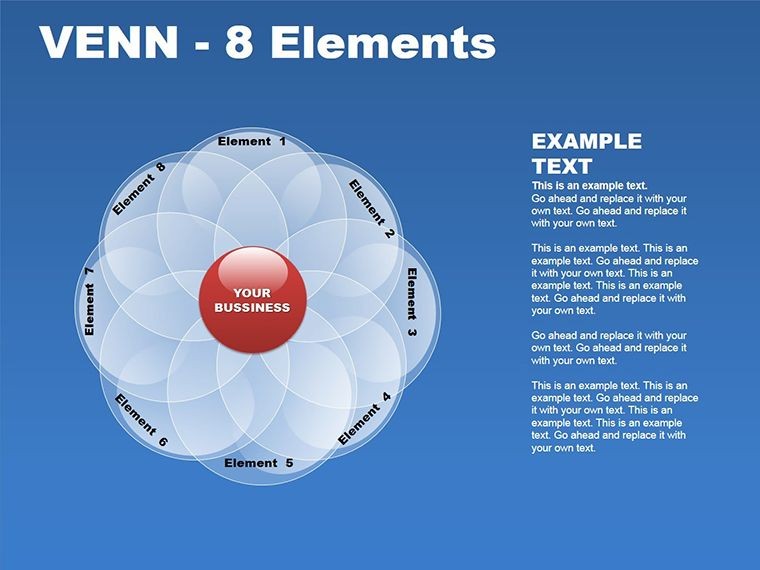
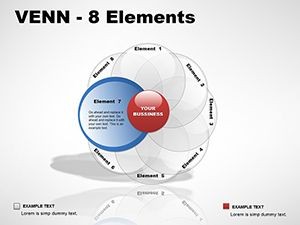
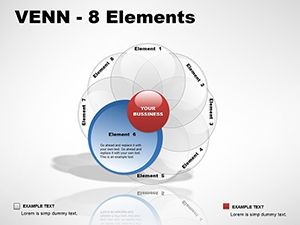
What sets these Venn diagrams apart is their versatility in capturing nuances. The core slide uses symmetric rings for balanced comparisons, while variants introduce asymmetric sizing to prioritize dominant elements. Icons nestle within intersections, denoting outcomes like "shared benefits" with a simple handshake graphic.
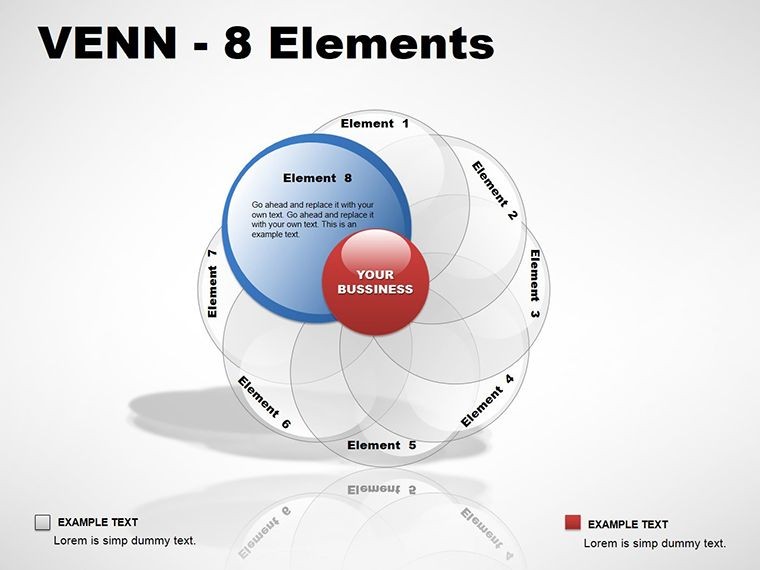
- Multi-Layer Customization: Scale individual rings independently, maintaining overlap integrity for precise data representation.
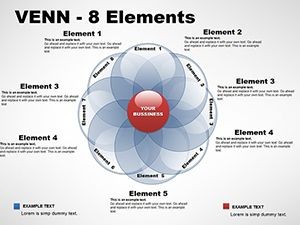
- Color-Coded Intersections: Gradient fills differentiate overlap zones, making multi-way interactions pop without text overload.
- Buildable Animations: Sequence ring appearances to guide viewers from isolated elements to full convergence, building narrative tension.
One innovative slide employs a radial Venn for circular processes, like ecosystem mappings in sustainability talks. Tweak the text curves to fit long labels, and watch how it elevates abstract discussions into tangible insights.
Customizing Step by Step for Maximum Impact
Integration is a breeze. Launch in Keynote, group rings for easy manipulation, then:
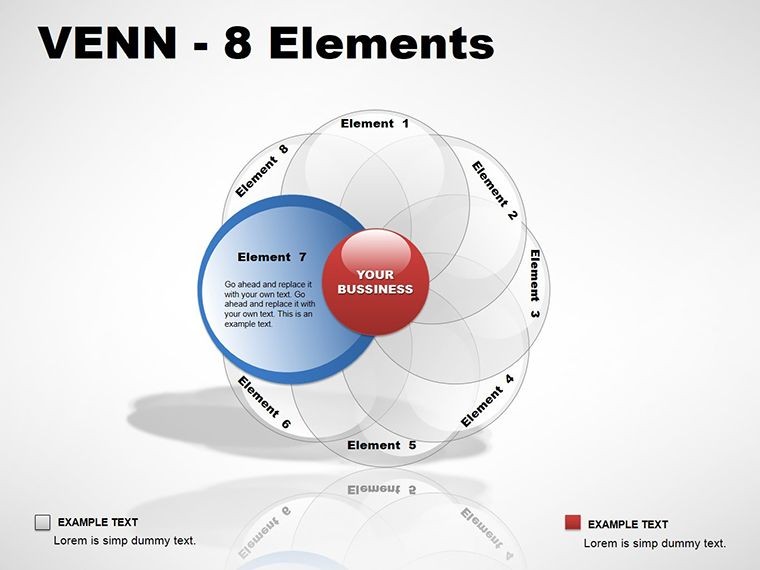
- Define Elements: Label each ring with your categories, using smart guides for alignment.
- Refine Overlaps: Adjust bezier curves on ring edges to fine-tune intersection areas, ensuring logical groupings.
- Infuse Data: Place pie snippets or bullet icons in overlaps to quantify relationships, like market share percentages.
- Animate Reveal: Set staggered entrances via the inspector, syncing with your speaking rhythm for dynamic delivery.
This method, inspired by data visualization pros, sidesteps the clunkiness of drawing from scratch, delivering pro-level results in minutes.
Versatile Applications Across Scenarios
From academic lectures to boardroom strategizing, these diagrams excel where relationships rule. A policy analyst might layer regulatory frameworks, with intersections flagging compliance hotspots. In creative agencies, use them to Venn brainstorm campaign themes against brand pillars, uncovering fresh angles.
For tech product managers, a slide could intersect user needs with feature sets, pinpointing must-haves versus nice-to-haves. The eight-element depth allows for comprehensive breakdowns, like in HR for talent matrixes blending skills, experience, and cultural fit.
Even in event planning, map vendor overlaps with budget categories to avoid redundancies. These visuals foster collaboration, as teams trace paths through rings to align on priorities.
Industry-Specific Adaptations
Tailor to your field: In finance, color-code risk interdependencies; for nonprofits, highlight donor-program synergies. Versus generic shapes, these maintain geometric precision, avoiding distortion in exports.
Copy-paste into master decks effortlessly, preserving layer order for consistent theming.
Benefits That Connect the Dots
These diagrams cut through complexity, enabling faster comprehension and richer dialogues. Viewers internalize interconnections intuitively, leading to sharper decisions. Consultants use them to demystify client challenges, turning sessions into breakthrough workshops.
The payoff? Presentations that linger, prompting follow-ups and deeper engagements. Secure your 8-Element Venn Diagrams for Keynote now and weave the threads of your ideas into unbreakable narratives.
Frequently Asked Questions
How do 8-element Venns differ from simpler versions?
They handle more variables, revealing multi-way overlaps that basic diagrams can't capture without clutter.
Is editing straightforward in Keynote?
Yes, with vector paths and shape tools, modifications are non-destructive and quick.
Can these work for non-overlap scenarios?
Certainly - use disjoint rings for contrasts, or partial overlaps for evolving alliances.
What formats are supported?
.key and .kth files ensure broad Keynote compatibility.
Are animations customizable?
Fully - adjust timing, easing, and order to match your pace.
Ideal for group sizes beyond eight?
For larger sets, nest subgroups within rings to maintain clarity.