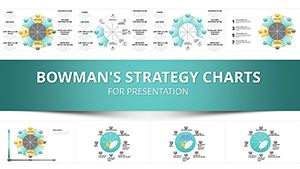
World Economic Situation Keynote Charts Template: Decode Crises for Resilient Strategies


Type: Keynote Charts template
Category: Tables, Illustrations, Analysis
Sources Available: .key
Product ID: KC00591
Template incl.: 30 editable slides
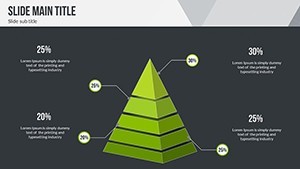
Amidst global uncertainties, understanding the world economic situation is paramount for enterprises and policymakers alike. The World Economic Situation Keynote Charts Template offers 30 editable slides dedicated to dissecting crisis causes, impacts, and management strategies, empowering users to adapt and thrive. Compatible with Keynote on Mac, this tool integrates tables, illustrations, and analytical charts to visualize complex socio-economic systems. Imagine presenting at a conference, using diagnostic diagrams to reveal enterprise vulnerabilities, akin to how the IMF employs visuals in their World Economic Outlook reports to forecast recoveries. This template caters to the informational and transactional needs of analysts seeking robust visuals for crisis navigation, grounded in theoretical foundations from sources like the World Bank. It's a comprehensive resource that not only highlights problems but proposes solutions, fostering trustworthiness through data-driven narratives that encourage proactive management in turbulent times.
Core Features for In-Depth Economic Analysis
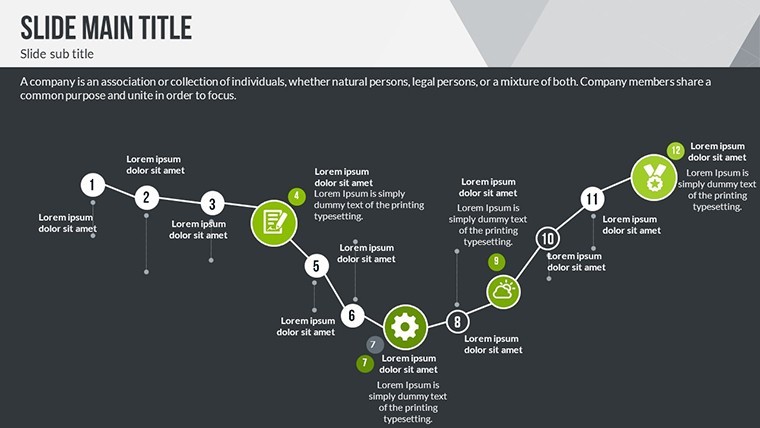
Engineered for analytical rigor, the template boasts a blend of tables for data compilation, illustrations for conceptual clarity, and charts for trend spotting. Editable elements allow tailoring to specific crises, with a focus on adaptation strategies.
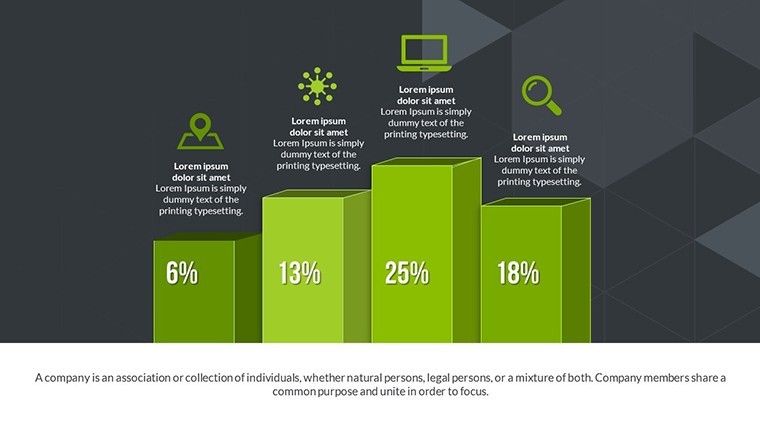
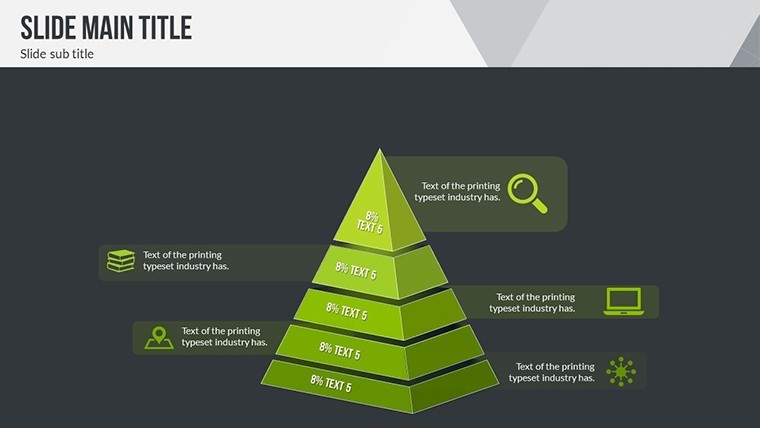
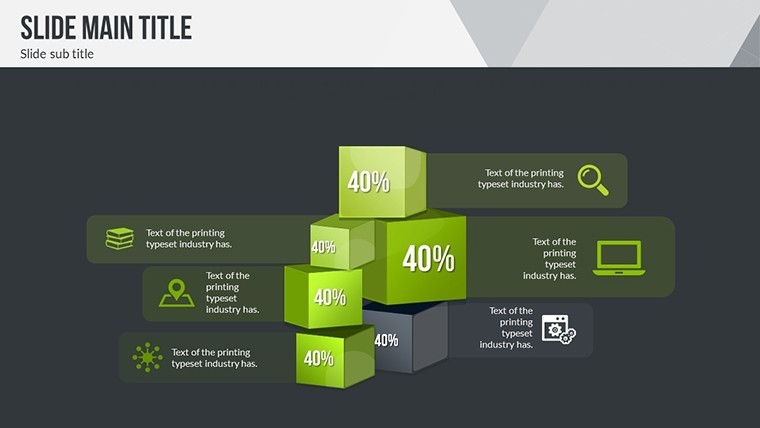
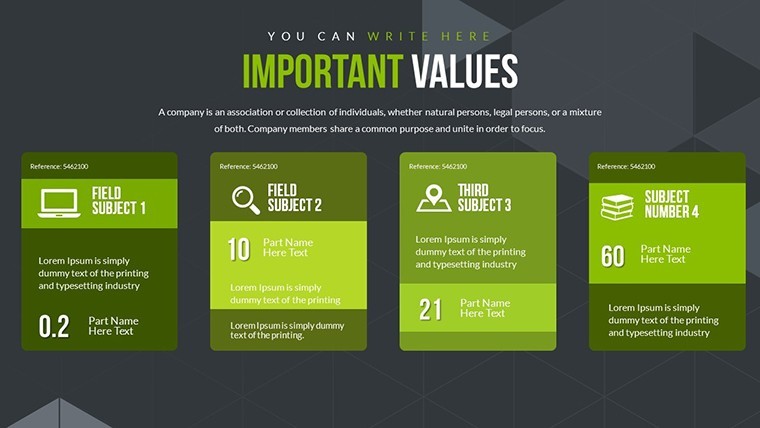
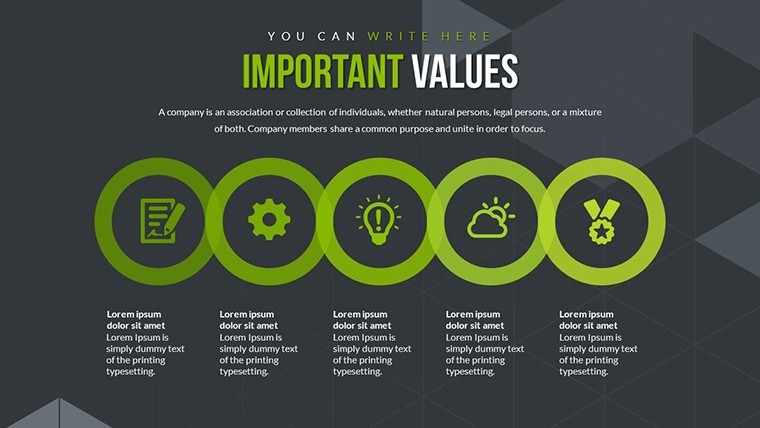
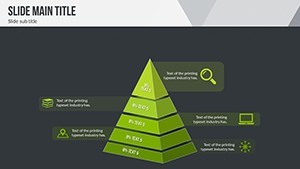
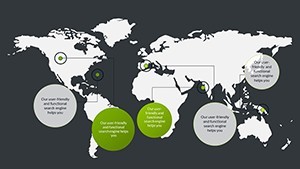
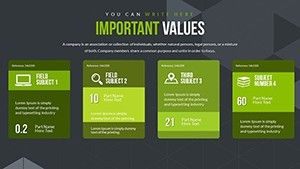
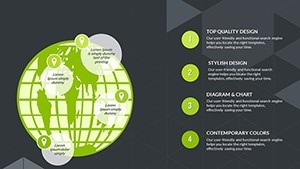
- Table and Illustration Fusion: Combine structured data tables with visual metaphors to explain crisis functions and enterprise impacts.
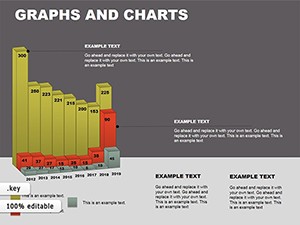
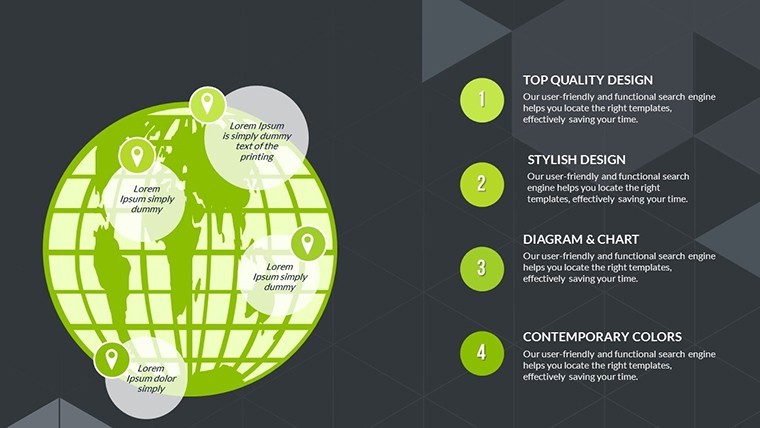
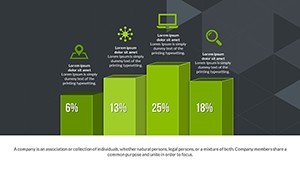
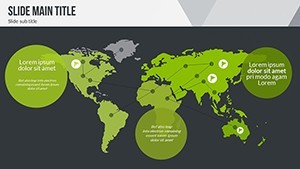
- Diagnostic Tools: Built-in charts for identifying phenomena, customizable for regional or global scopes.
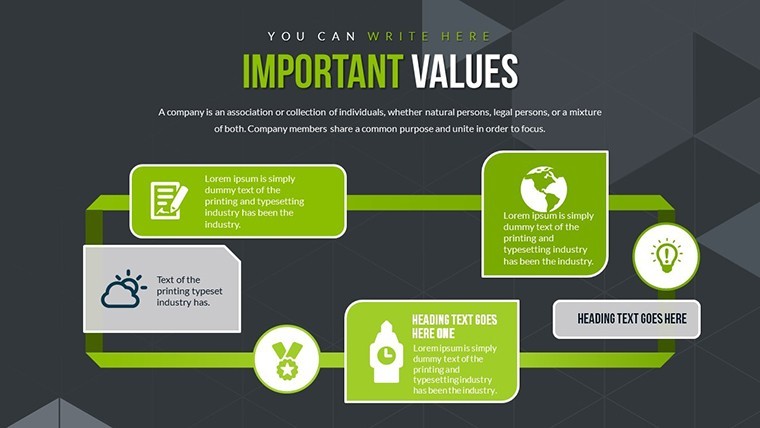
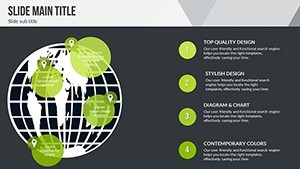
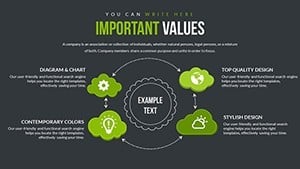
- Strategy Development Slides: Frameworks for overcoming crises, editable to incorporate methodologies like SWOT or PESTLE.
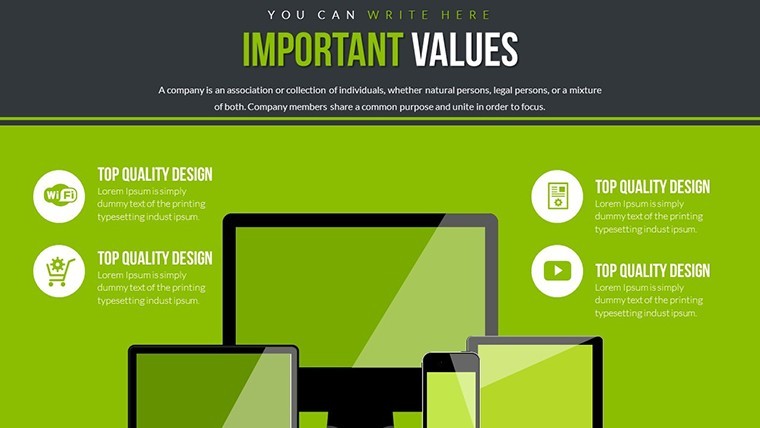
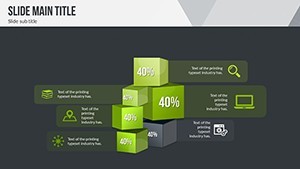
- High-Fidelity Visuals: Resolution-optimized for detailed presentations, ensuring clarity in projections.
These draw from authoritative methodologies, such as those in OECD reports on economic resilience, enhancing your presentations with expert-backed insights.
Use Cases: From Crisis Diagnosis to Recovery Planning
In an enterprise board meeting, utilize Slide #5's cause-effect charts to pinpoint crisis origins, customizing with data from your operations for targeted discussions. This parallels strategies at corporations like General Electric during downturns, where visuals aided swift adaptations.
For academic or policy forums, deploy Slide #18's analytical illustrations to substantiate management theories, referencing real cases from the 2008 financial crisis as per studies in The Economist.
- Gather your economic data and populate tables for accurate visualizations.
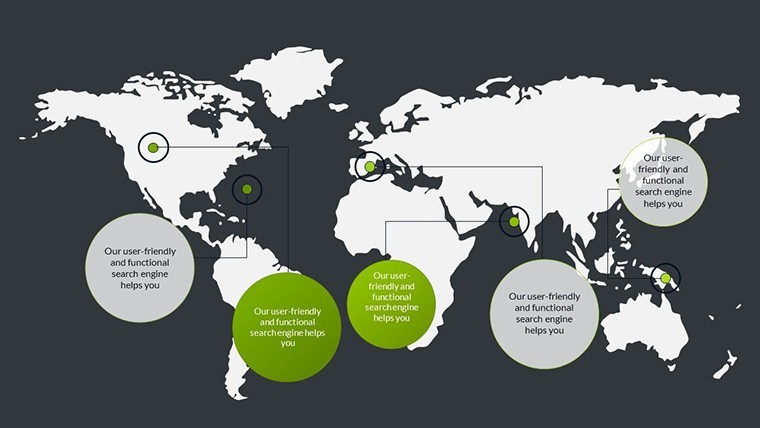
- Adjust illustrations to reflect specific crisis scenarios, like supply chain disruptions.
- Use charts to model recovery strategies, simulating outcomes.
- Share edited versions collaboratively via Keynote for team input.
Superior to generic charts, this template provides systemic depth, alleviating challenges like oversimplified analyses and enabling nuanced, evidence-based planning.
Expert Guidance for Effective Economic Narratives
Start with macro overviews before micro details, a structure recommended by economists like Paul Krugman. Add subtle analogies, such as "Crises as storms - prepare your sails," to engage without diluting analysis. Bolster credibility by embedding citations from IMF or World Bank data.
Fortify Your Economic Insights Today
This template is your beacon in economic storms, ideal for those committed to resilient management. Acquire it now to turn insights into action.
Frequently Asked Questions
What crisis aspects does the template cover?
It addresses causes, functions, impacts, and management strategies through editable charts and tables.
Can it be used for regional economic analyses?
Yes, fully customizable for global or local contexts with adaptable illustrations.
How editable are the analytical elements?
Completely editable, including data inputs, colors, and layouts for precise tailoring.
Is it suitable for non-economists?
Absolutely, with intuitive designs that simplify complex theories for broader audiences.
What compatibility does it offer?
Optimized for Apple Keynote (.key), perfect for Mac users.
How does it aid in strategy development?
Provides frameworks for diagnosing and overcoming crises, enhancing decision-making.