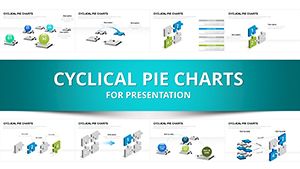
Sphere of Influence Keynote Charts: Visualize Networks and Impacts


In an interconnected world, understanding spheres of influence - whether in business networks, social dynamics, or strategic planning - is key to making informed decisions. Our Sphere of Influence Keynote charts template brings this concept to life with 20 meticulously designed, editable slides compatible with Mac's iWork Keynote. Tailored for executives, marketers, and consultants, it uses matrix layouts, arrow diagrams, and puzzle elements to depict how entities interact, overlap, and exert power. Inspired by frameworks like those in Harvard Business Review articles on network theory, this template helps you illustrate everything from stakeholder mappings to market penetration strategies with precision and flair.
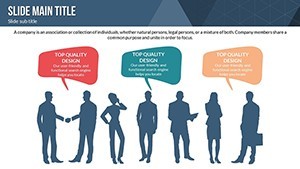
Picture this: you're pitching a partnership expansion, and instead of dense text, you reveal a sphere diagram where arrows show influence flows, puzzles snap together for synergies, and matrices highlight key players. The result? Engaged audiences who grasp your vision instantly. With full-color variations and custom animations, each slide transforms static data into a dynamic experience, fostering deeper insights and discussions.
Standout Features for Effortless Customization
This template excels in user-friendliness, allowing quick modifications to suit your needs. Change colors to align with your brand, tweak text for specific contexts, or swap photos for relevant imagery - all while maintaining professional quality.
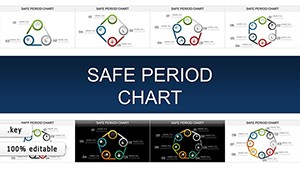
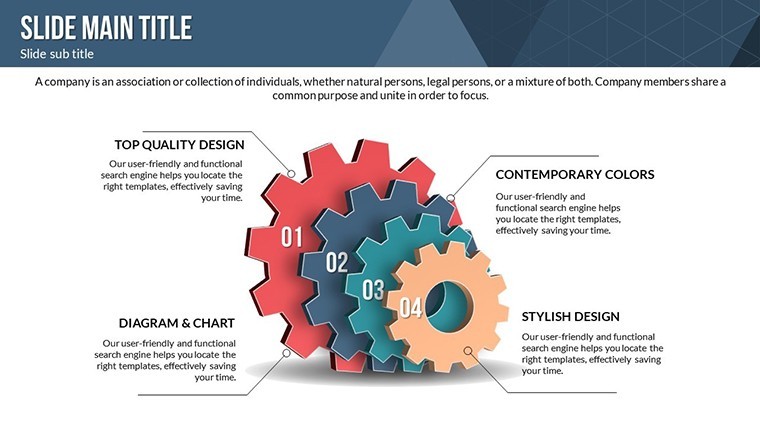
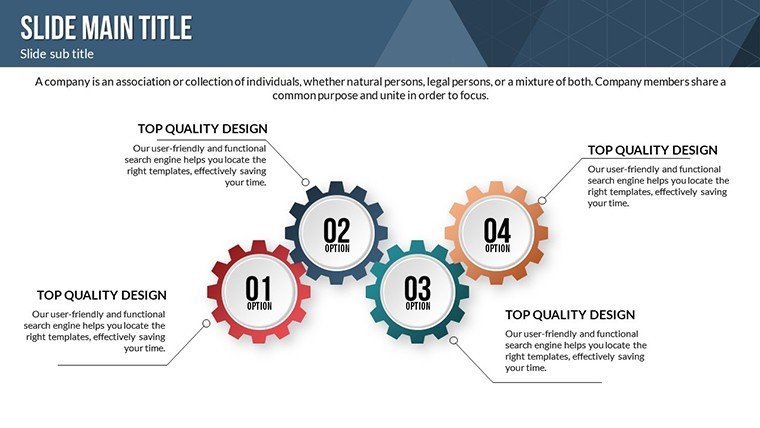
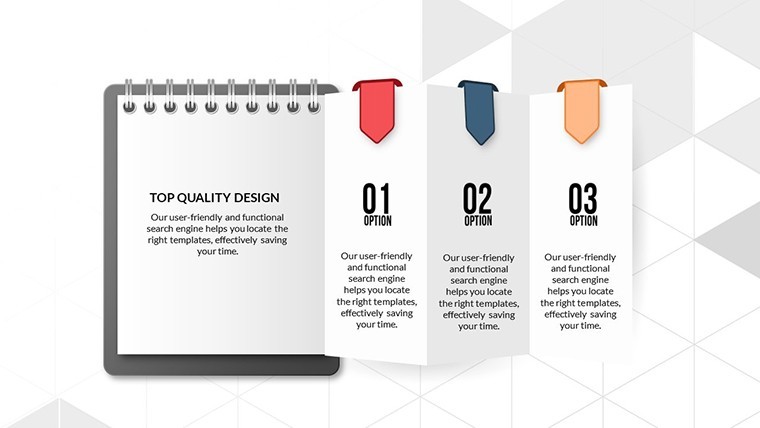
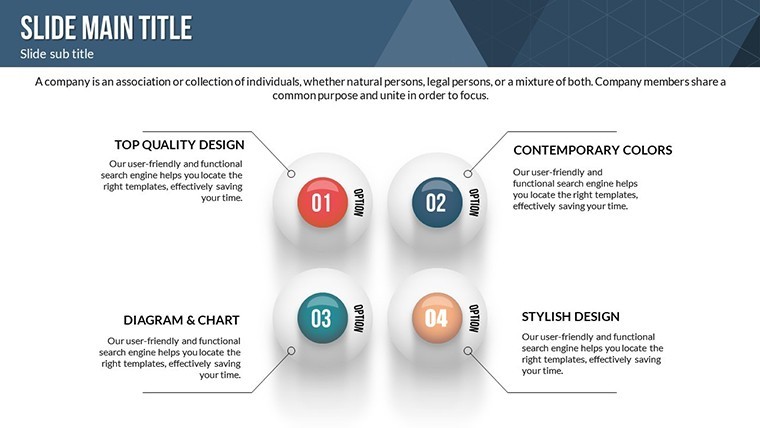
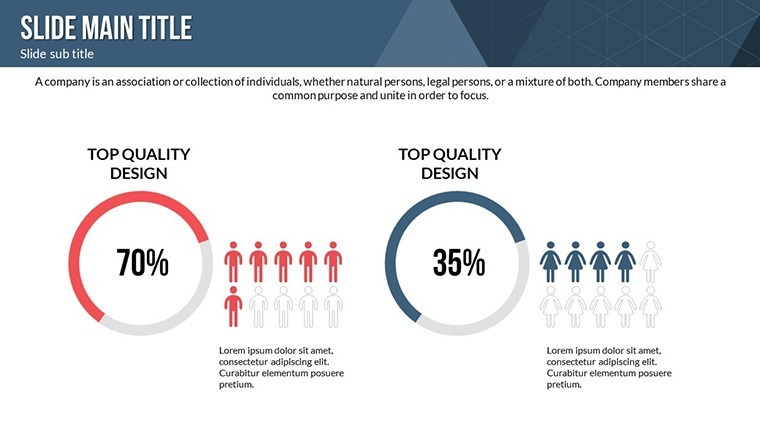
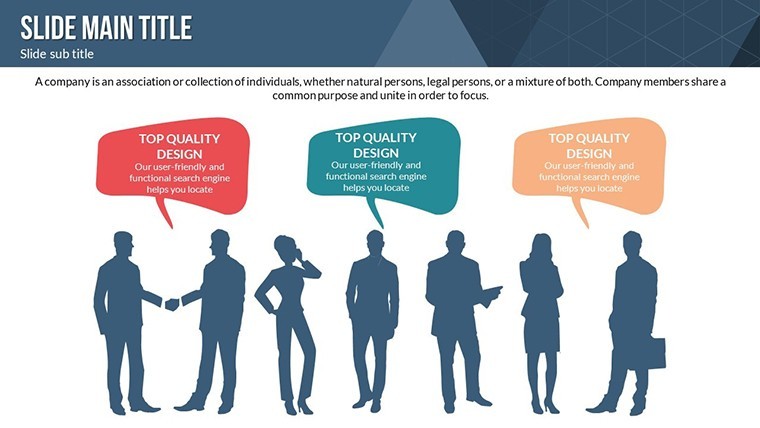
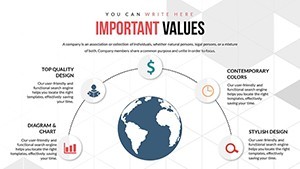
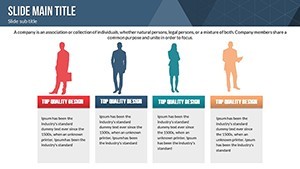
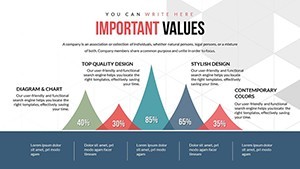
- Colorful Variations: Choose from vibrant palettes to emphasize different influence levels, such as warm tones for positive impacts and cool for challenges.
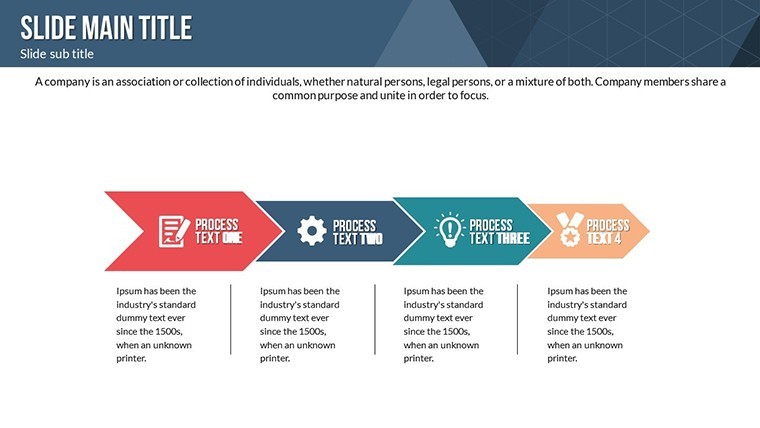
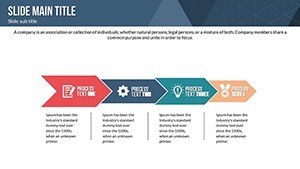
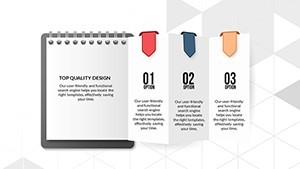
- Animated Effects: Custom animations make elements appear sequentially, ideal for building narratives around influence growth over time.
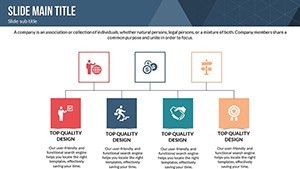
- Vector Icons and PNGs: Included assets like network nodes and connection arrows can be resized infinitely without distortion.
- Full Editability: Adjust layouts in the .key file, adding media or tables to enrich your story.
These features ensure the template integrates seamlessly into your workflow, saving time and enhancing polish compared to generic Keynote options.
Practical Applications and Value Propositions
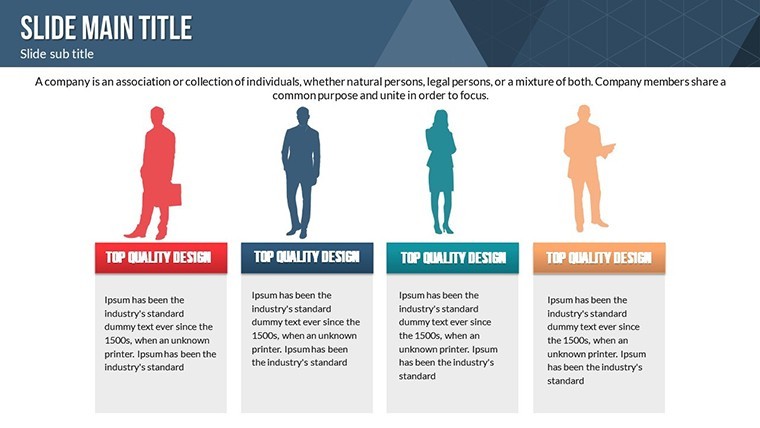
For marketing teams, use arrow charts to map customer journey influences, revealing touchpoints that drive conversions. In leadership training, puzzle slides can demonstrate team dynamics, showing how individual spheres interlock for collective success. Consider a case from McKinsey reports: companies mapping supplier influences reduced risks by identifying vulnerabilities early.
Benefits abound - clearer communication leads to better alignment, as per studies from the Project Management Institute. Entrepreneurs can leverage it for investor decks, visualizing market spheres to showcase opportunities. Educators might adapt for sociology classes, animating historical influence networks like those in global politics.
Detailed Workflow: Crafting a Network Analysis Presentation
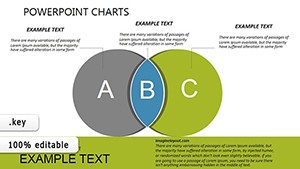
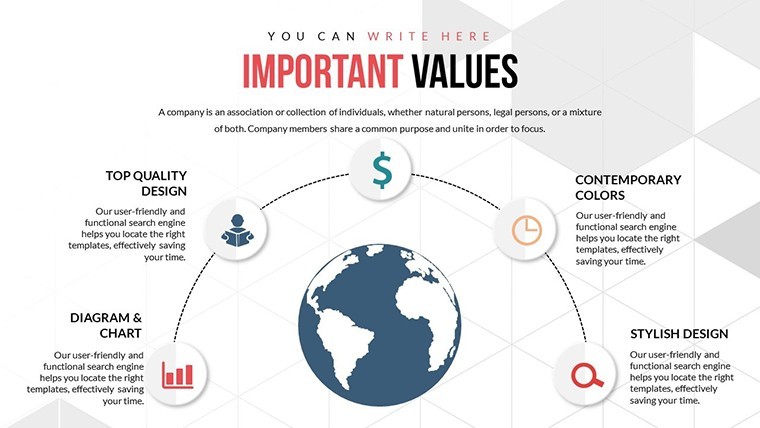
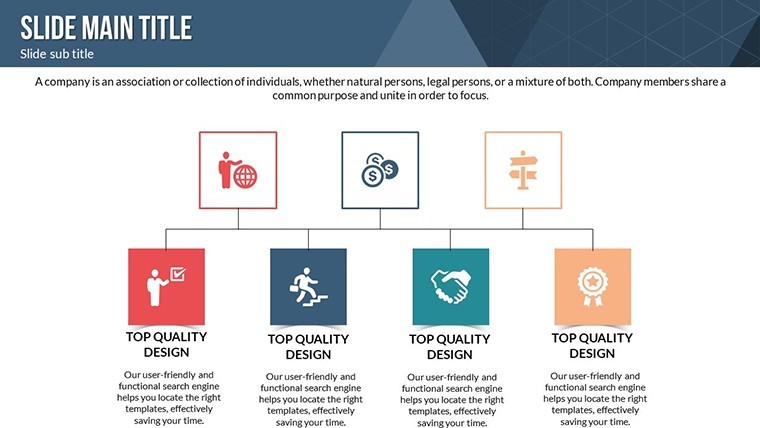
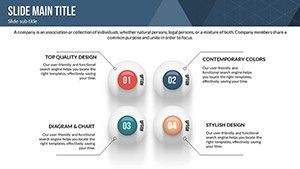
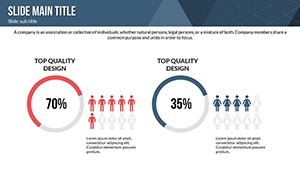
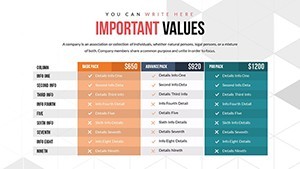
- Define Scope: Start with a matrix slide to list entities and their influence radii.
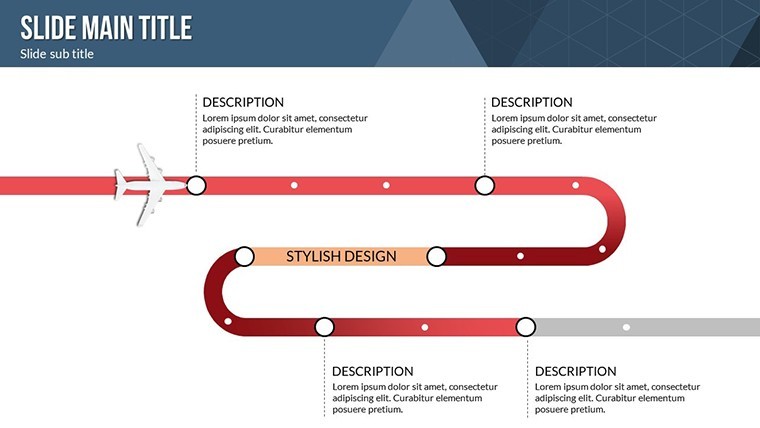
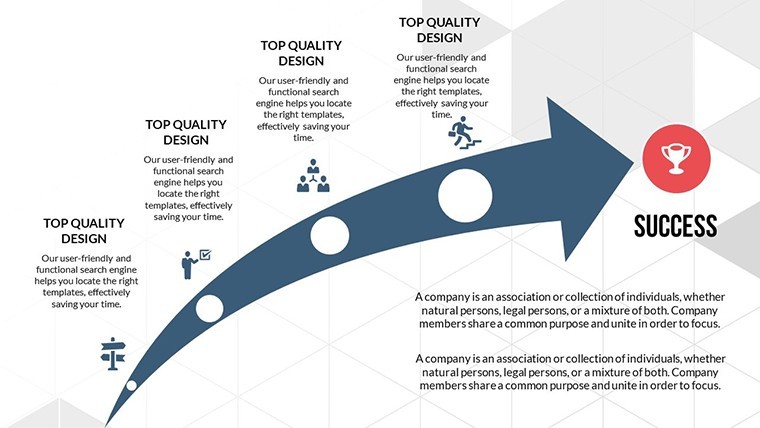
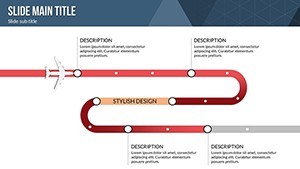
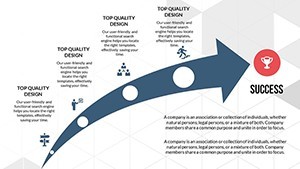
- Visualize Connections: Use arrows to draw links, animating them to show directional flows.
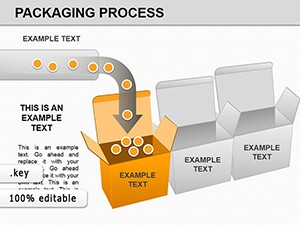
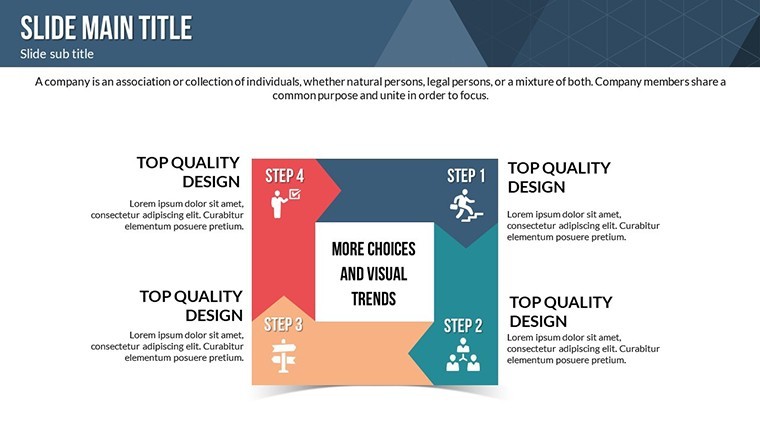
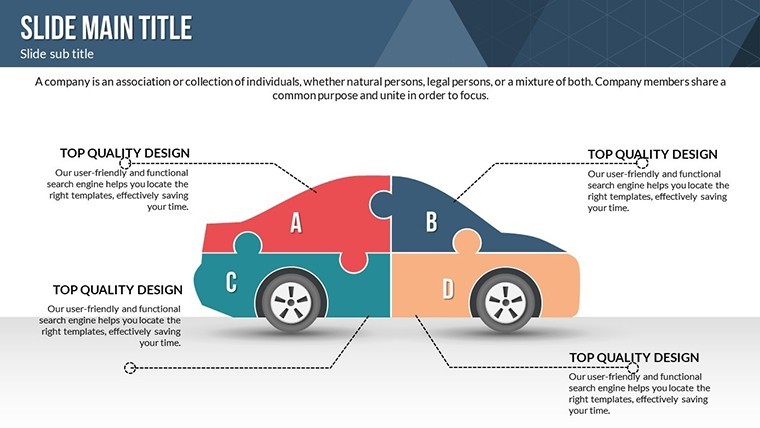
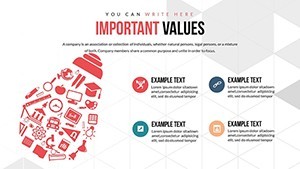
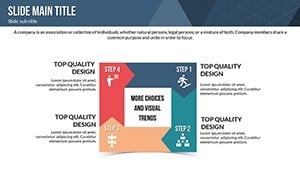
- Incorporate Puzzles: Assemble pieces for holistic views, adding text for qualitative insights.
- Enhance with Media: Embed videos of real-world examples, like TED Talks on social influence.
- Finalize and Present: Test animations for smooth delivery, exporting if needed for broader compatibility.
This step-by-step method turns abstract concepts into actionable visuals, outperforming basic tools by providing themed coherence.
Pro Tips from a Visualization Expert
Drawing on years of experience, I suggest using LSI terms like "network mapping" or "stakeholder spheres" naturally in your content. For UX, include alt texts such as "Arrow diagram of business influence spheres." If your sphere involves architecture, tie in AIA standards for site influence in urban designs. Always vary animation speeds to match pacing - quick for overviews, slow for emphasis.
Unlike plain Keynote charts, this template's puzzles add an interactive feel, boosting retention. Integrate with tools like MindMeister for imported maps, creating hybrid masterpieces.
Elevate Your Influence Narratives Now
Ready to map out success? This Sphere of Influence template is your gateway to persuasive, professional presentations that leave lasting impressions. Download and start influencing today.
Frequently Asked Questions
What makes the animations custom?
They’re tailored to each element, allowing sequenced reveals that build your story progressively.
Can I use this on Windows?
Primarily for Mac Keynote, but export to PDF or PowerPoint for cross-platform use, with some animation adjustments.
Ideal for which professions?
Marketers, strategists, and leaders in business, education, or consulting benefit most from its network-focused designs.
How do I change color schemes?
Simply select elements and apply new colors via Keynote's inspector - quick and intuitive.
Are icons editable?
Yes, all vector icons can be modified, resized, or recolored to fit your theme.