Quality Control Keynote Charts Template: Professional Visuals for Manufacturing Excellence


Type: Keynote Charts template
Category: Tables, Illustrations, Puzzles
Sources Available: .key
Product ID: KC00560
Template incl.: 28 editable slides
In the fast-paced realm of manufacturing and operations, conveying quality control metrics effectively can prevent costly errors and enhance stakeholder confidence. This Quality Control Keynote charts template, with its 28 editable slides, is crafted for managers, supervisors, and executives who demand precision in their presentations. Featuring tables, illustrations, and puzzles, it helps visualize everything from process audits to customer satisfaction scores, turning data into actionable insights.
Envision leading a team review where your slides not only display defect rates but illustrate improvement pathways through engaging puzzles. Optimized for Keynote on Mac, this template ensures high-fidelity graphics and user-friendly edits, making it a staple for professionals adhering to ISO 9001 standards in quality management.
Essential Features for Impactful Quality Presentations
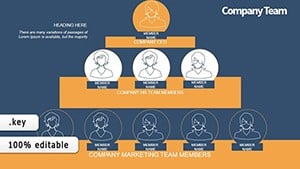
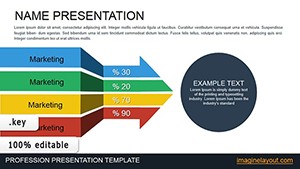
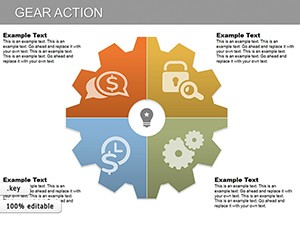
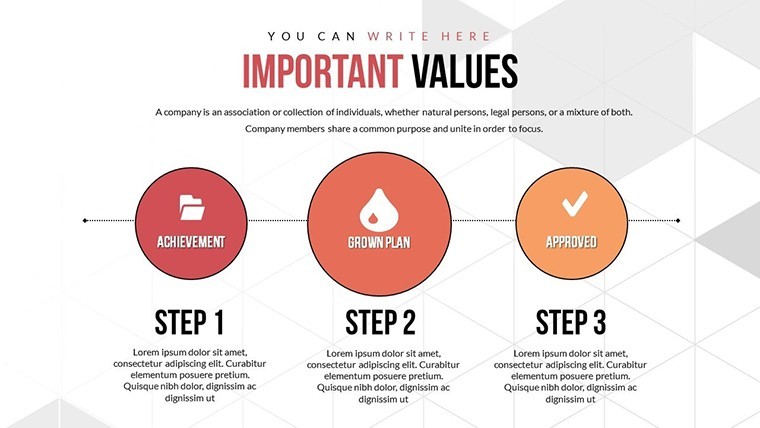
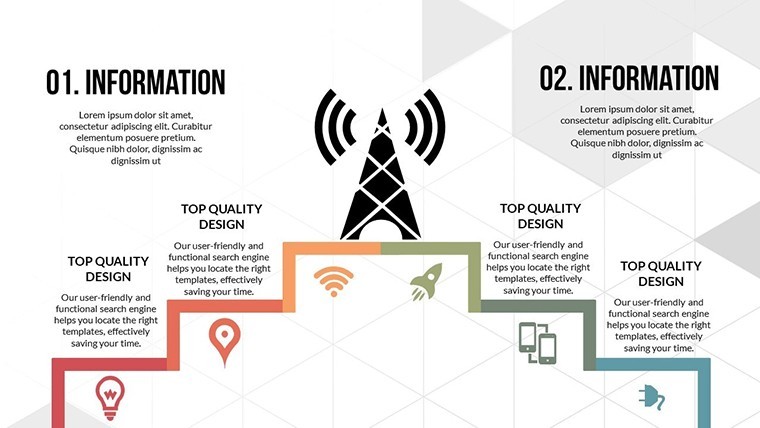
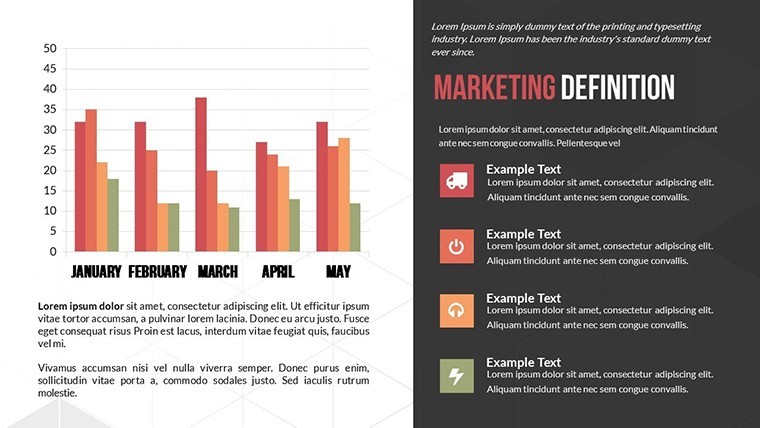
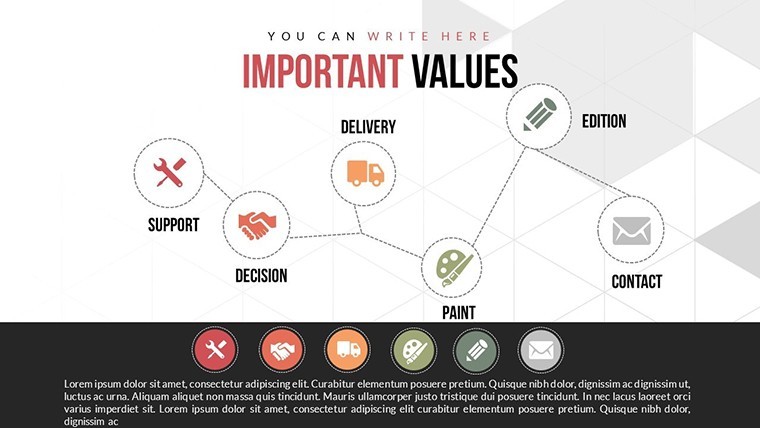
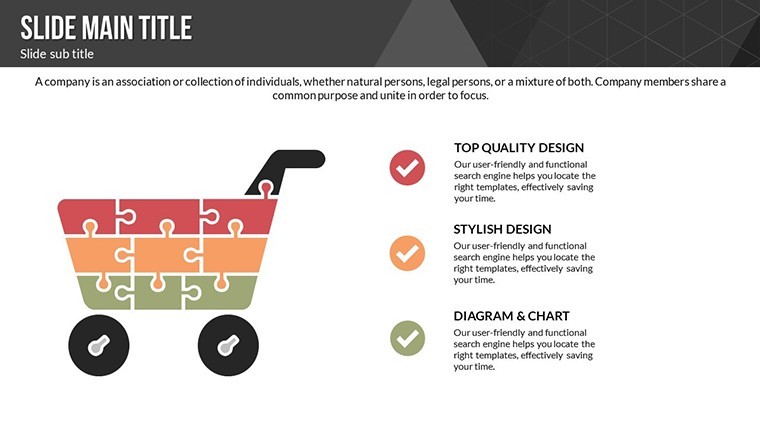
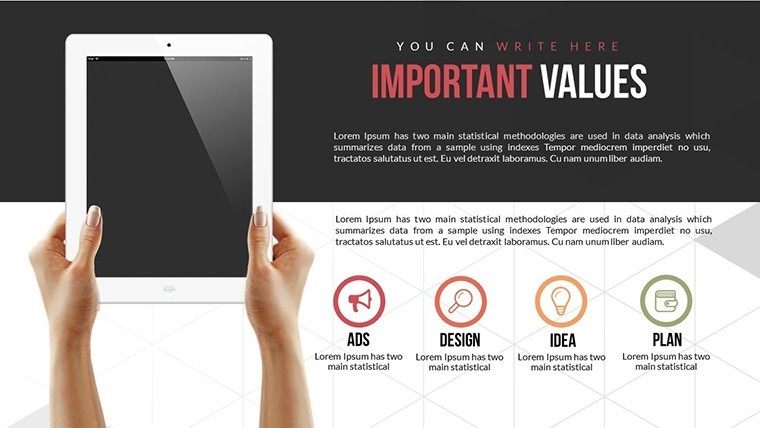
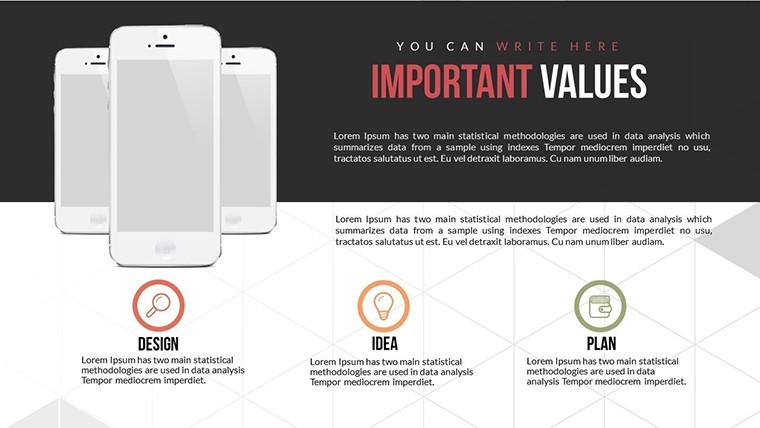
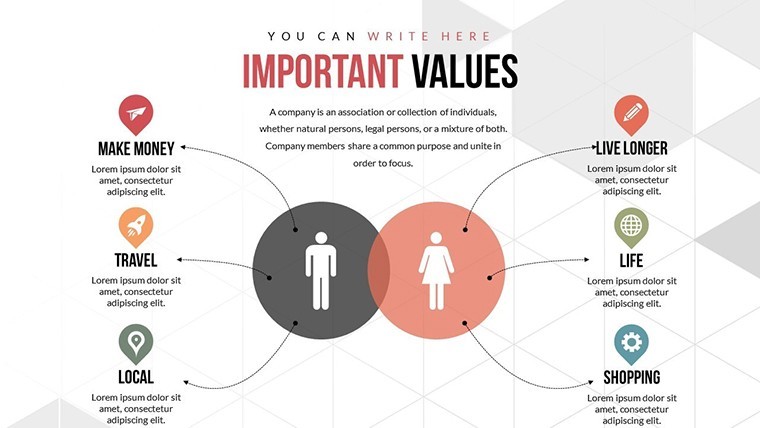
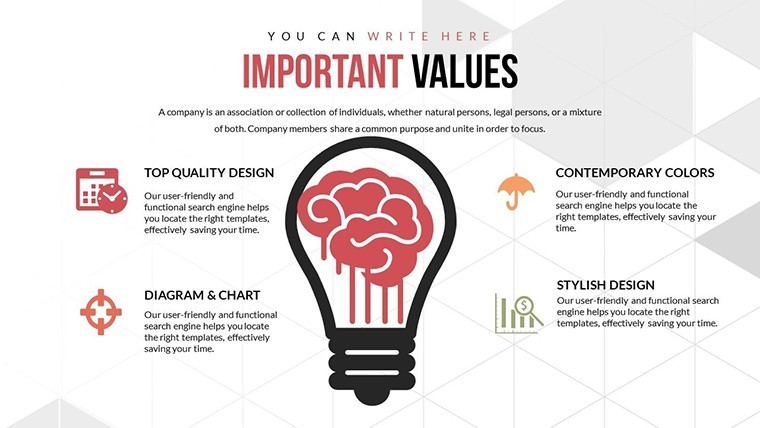
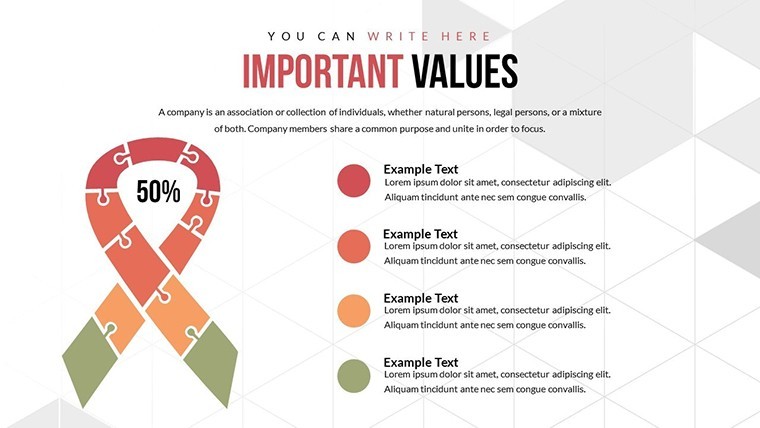
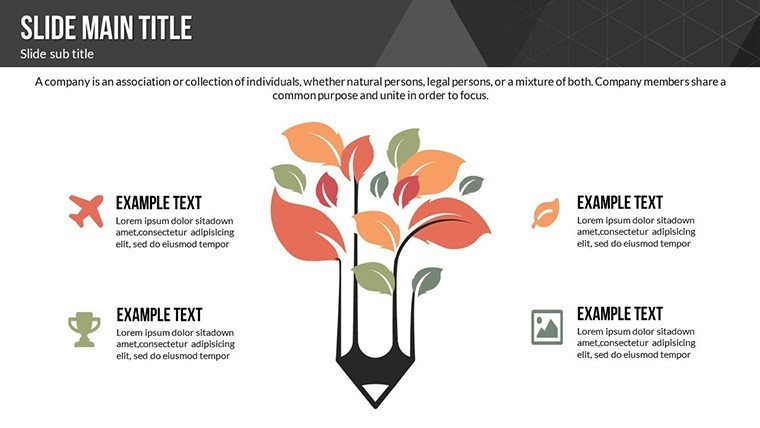
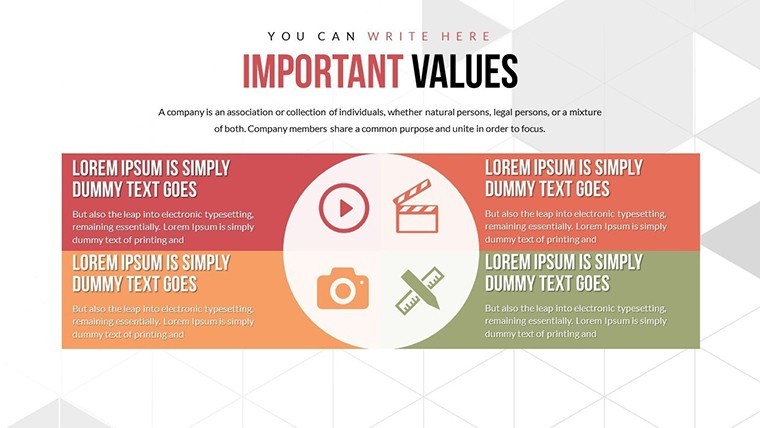
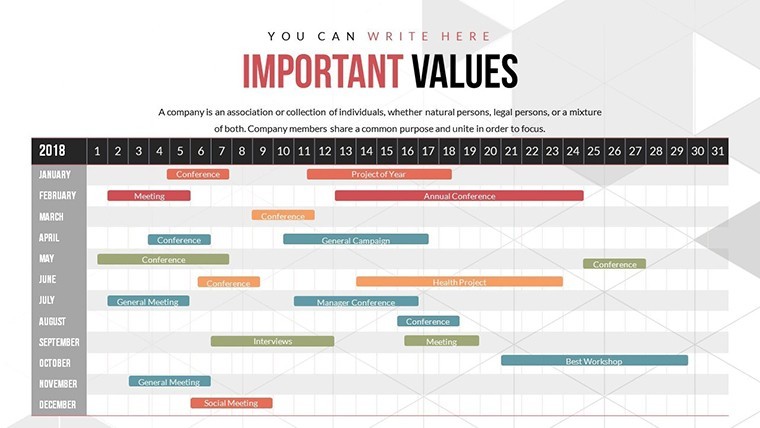
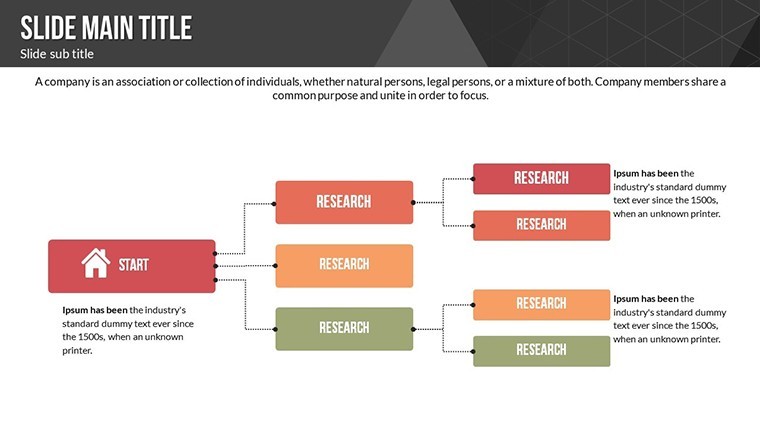
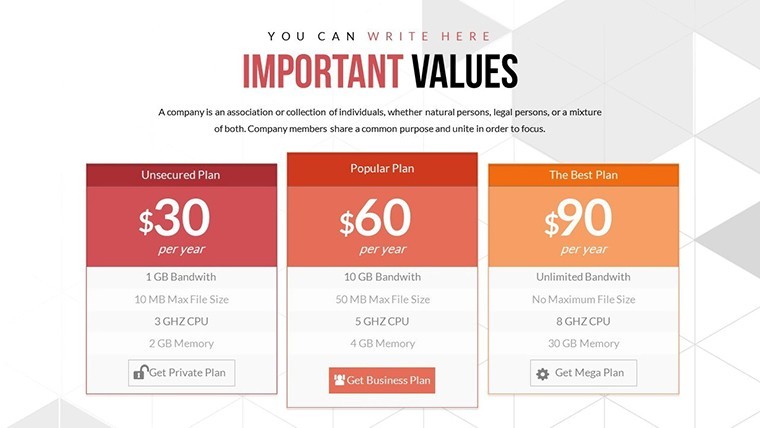
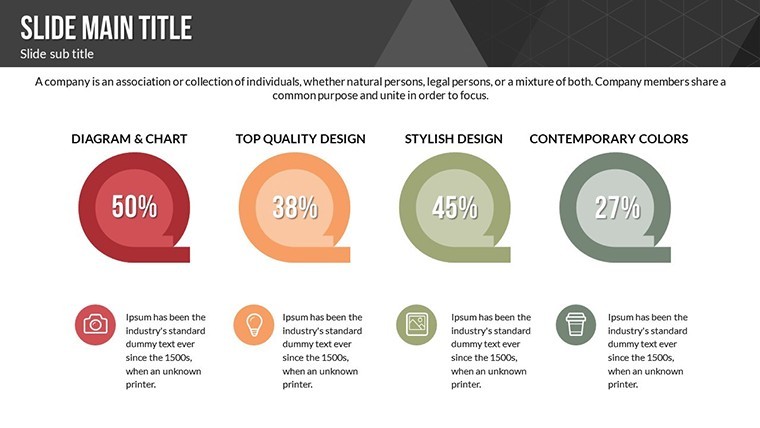
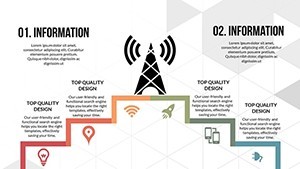
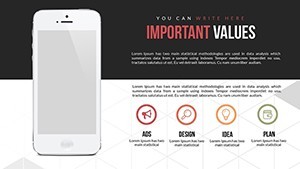
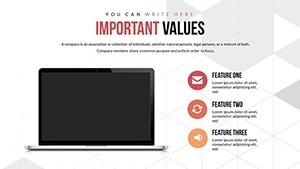
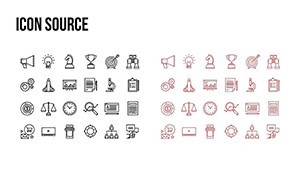
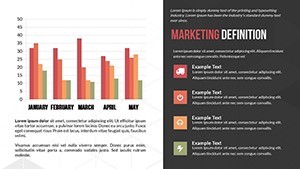
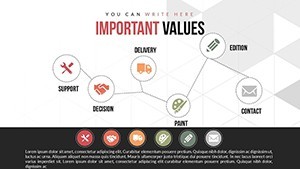
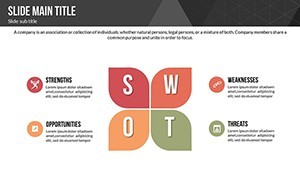
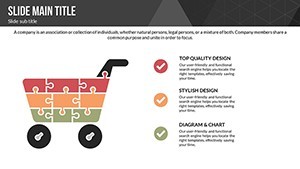
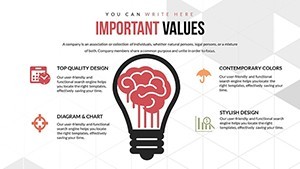
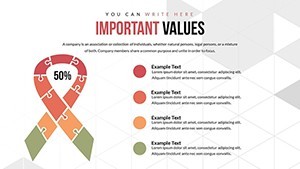
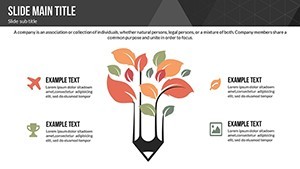
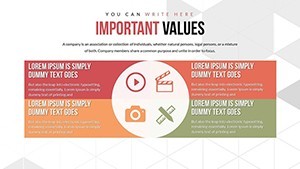
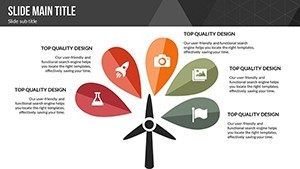
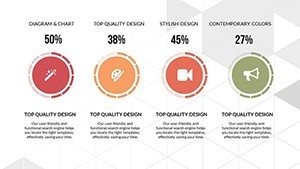
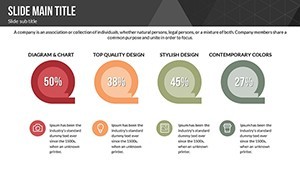
At its core, this template offers a suite of customizable elements. The 28 slides include diverse visuals: tables for metric tracking, illustrations for process flows, and puzzles for problem-solving scenarios. Adjust fonts to emphasize key stats like PPM (parts per million defects), or tweak layouts to fit your narrative on continuous improvement.
Search engine optimization is baked in, with structured designs that naturally incorporate terms like "quality assurance metrics" for better online discoverability. The interface is intuitive, allowing quick additions of logos or branding, ensuring your deck aligns with company guidelines while showcasing expertise in lean manufacturing principles.
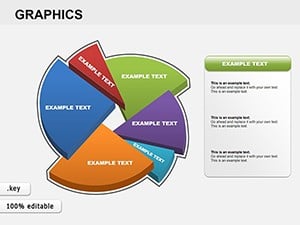
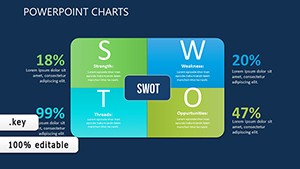
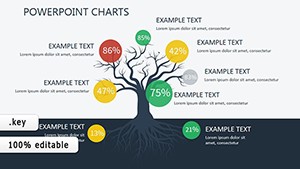
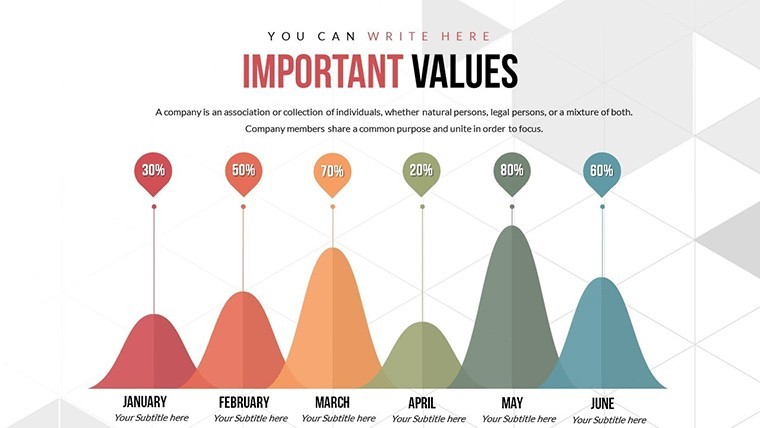
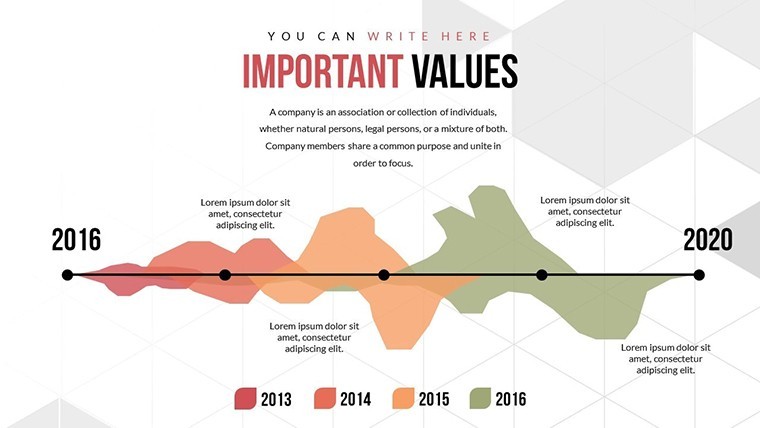
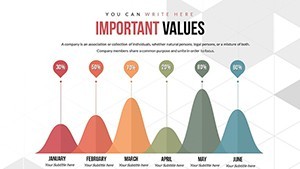
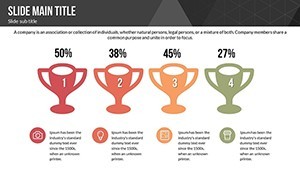
- Range of Visual Aids: Charts, graphs, and tables tailored for quality data.
- Full Customization: Change colors, fonts, and elements effortlessly.
- User-Friendly Design: No steep learning curve, even for busy supervisors.
- SEO-Optimized Structure: Enhances visibility for quality-related searches.
Drawing from authoritative sources like ASQ (American Society for Quality), the template promotes trustworthy visuals that highlight real-world benefits, such as reducing rework by 30% through better data presentation.
Diverse Use Cases in Quality Control Contexts
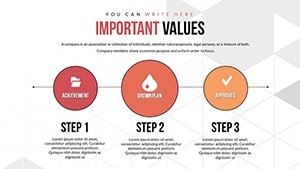
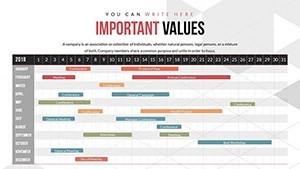
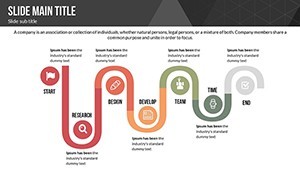
This template excels in practical applications. For production supervisors, use illustration slides to map out Six Sigma DMAIC cycles: Define issues in slide 3, Measure with tables in slides 7-10, Analyze via puzzles showing root causes, Improve with graph trends, and Control with summary visuals.
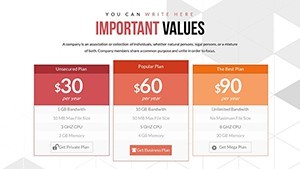
Executives presenting to boards can leverage customer satisfaction charts to demonstrate NPS (Net Promoter Score) improvements, perhaps referencing case studies from Toyota's quality circles. In pharmaceuticals, adapt for compliance reporting, using puzzles to connect regulatory requirements with internal processes, ensuring alignment with FDA guidelines.
- Gather Data: Compile your quality metrics and import into Keynote.
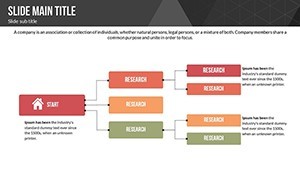
- Build Narratives: Use illustrations to flowchart inspection processes.
- Incorporate Feedback: Add images from audits for authenticity.
- Deliver with Confidence: Practice transitions to smoothly navigate complex topics.
Superior to generic options, this template's puzzle features encourage interactive thinking, potentially improving team collaboration. Integrate with tools like Minitab for statistical data, exporting charts directly into slides for up-to-date accuracy.
Pro Tips for Quality-Focused Storytelling
Incorporate LSI naturally: discuss "defect tracking systems" or "process optimization techniques." Adopt a professional yet inspiring tone - view quality control as the guardian of excellence, with each slide fortifying your message. For trustworthiness, cite general examples like how GE's quality initiatives boosted efficiency.
From automotive assembly lines to service industries, this template adapts, offering previews for quick reviews and download buttons for instant access.
Invest in Quality - Start Customizing Now
Elevate your quality control presentations to new heights with this versatile template. At $25, it's a worthwhile tool for driving operational success. Take the next step and download to begin crafting impactful decks today.
Frequently Asked Questions
What visual types are in this template?
Tables, illustrations, and puzzles for diverse quality data representation.
Is customization beginner-friendly?
Yes, with intuitive Keynote tools for easy edits.
Can it handle large datasets?
Absolutely, tables and graphs scale for comprehensive metrics.
Which sectors suit this best?
Manufacturing, pharmaceuticals, and services emphasizing quality.
Does it support branding?
Yes, add logos and colors seamlessly.