Cause and Effect Keynote Charts - Editable | ImagineLayout


Type: Keynote Charts template
Category: Business Models, Arrows
Sources Available: .key
Product ID: KC00557
Template incl.: 18 editable slides
Files and Formats Included
The download delivers a single .key file with 18 editable slides.
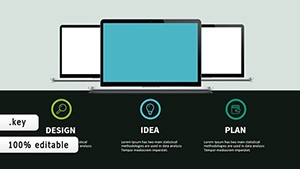
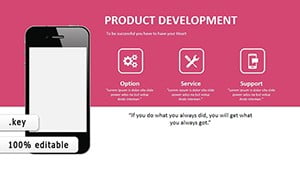
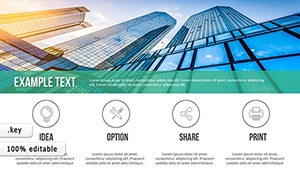
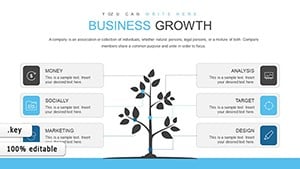
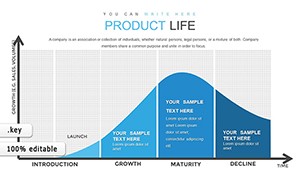
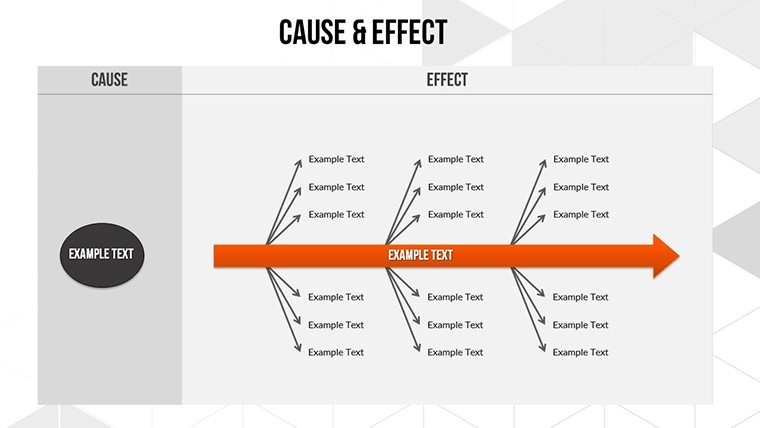
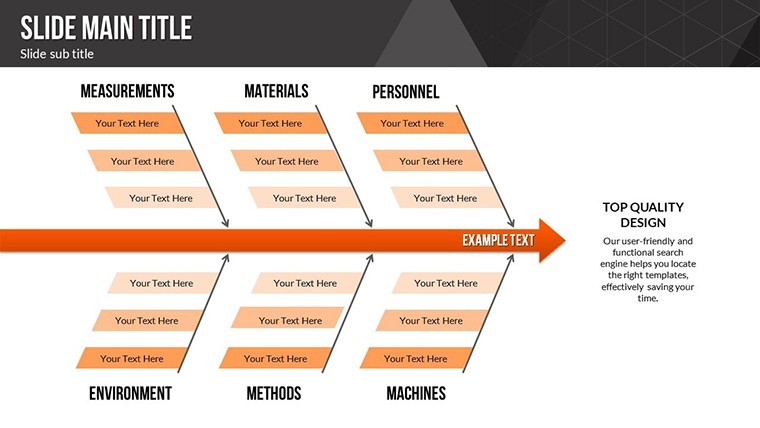
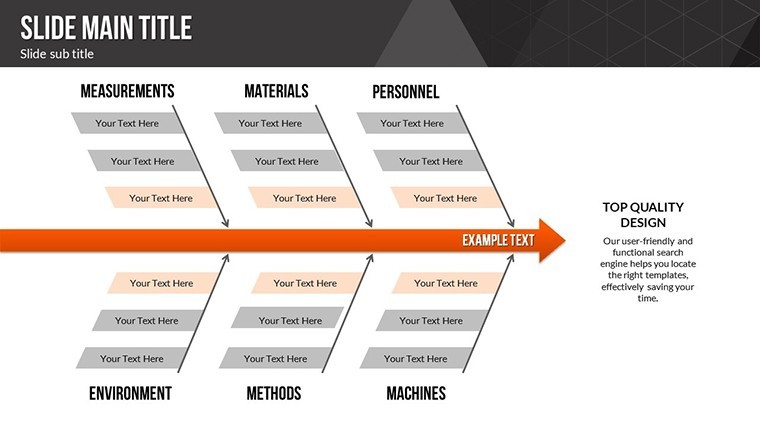
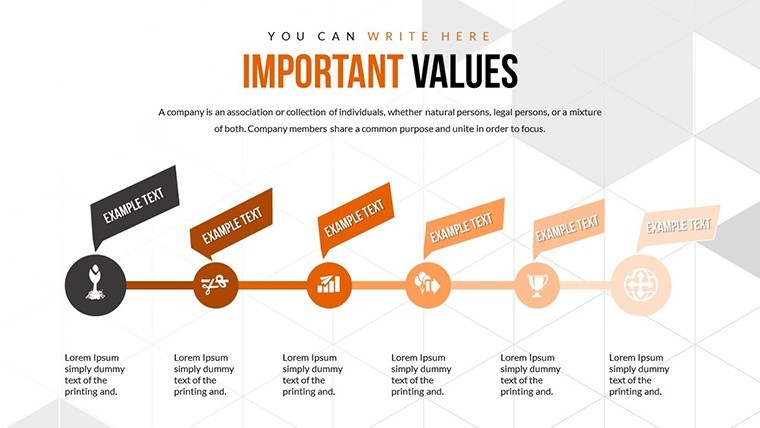
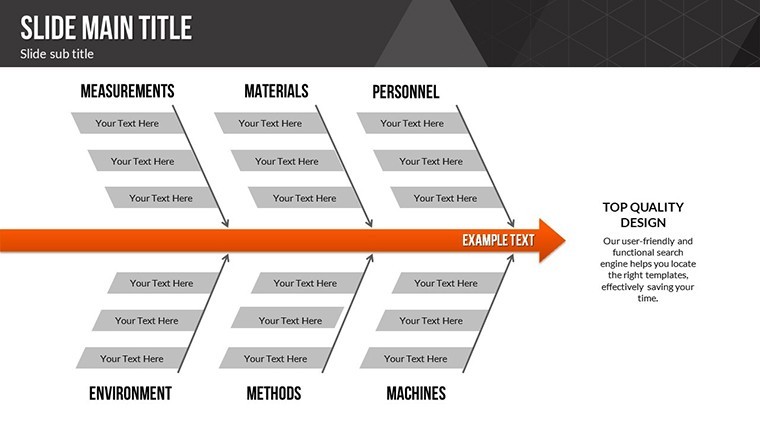
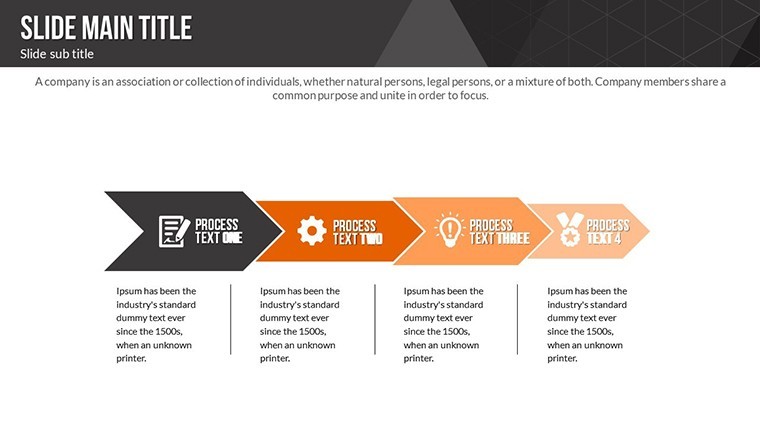
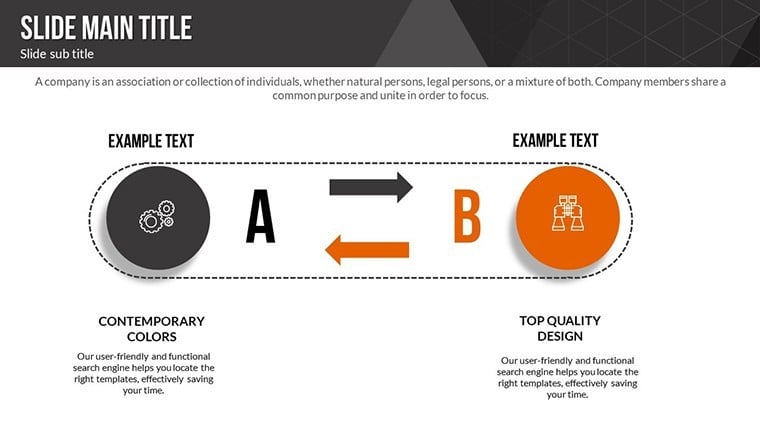
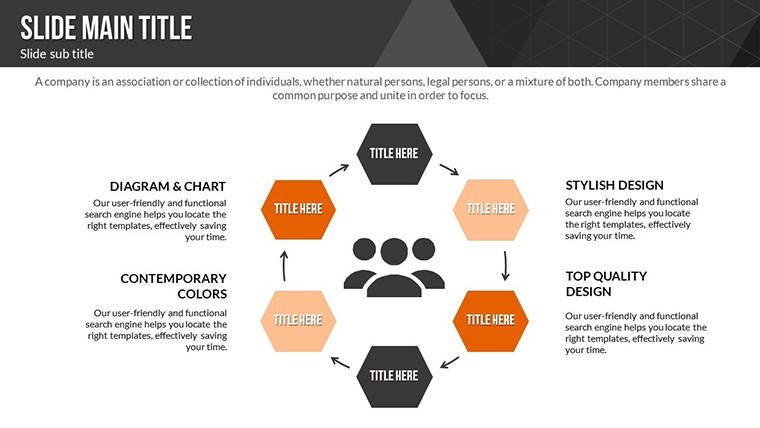
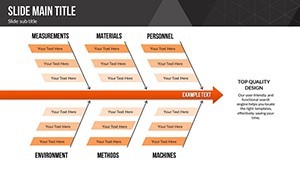
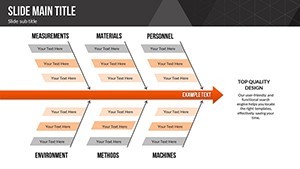
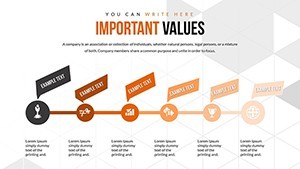
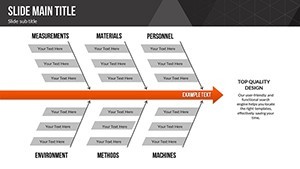
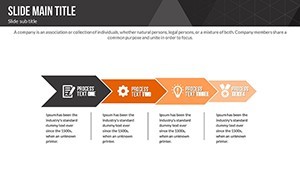
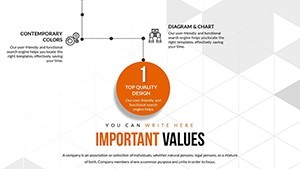
Slides focus on business models and arrow diagrams that trace cause and effect chains.
Unlike cycle sets, this one emphasizes flow direction for root cause work that fits investor decks better than neighbors.
Technical Specs
| Feature | Details |
|---|---|
| Slides included | 18 business model diagrams |
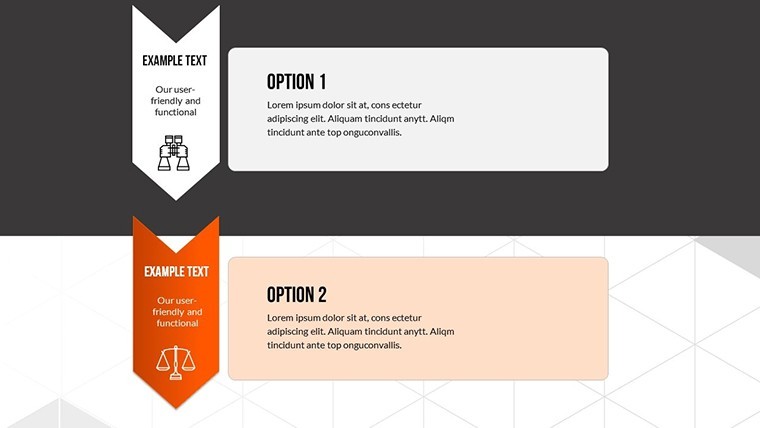
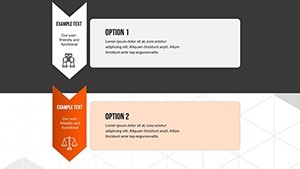
| Diagram categories | arrow cause-effect chains |
| Editable elements | arrows and labels independent |
| Aspect ratio | standard 16:9 |
| PowerPoint compatibility | Keynote only |
| Color themes | adjustable via sidebar |
From Strategy Decks to Boardroom Pitches
Financial Analyst in Banking
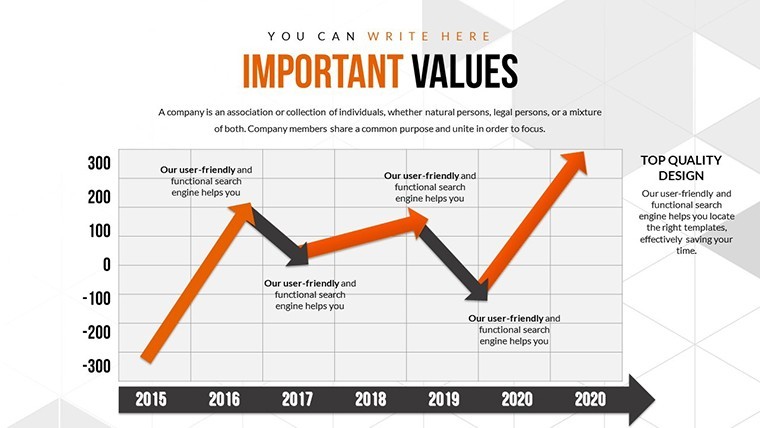
An analyst traces sales decline factors in an investor deck. The outcome reuses the file across reports with minimal changes.
Consultant in Retail
Consultants map market shifts and cut preparation time by two hours.
Download now to clarify your next root cause session.
How to Make It Yours in Under 20 Minutes
Beginner to moderate users adapt quickly in Keynote.
- Open the .key file (1 minute).
- Edit arrow directions and text (4 minutes).
- Apply brand colors (3 minutes).
- Export PDF (1 minute).
Many link it with a business models category page for broader decks.
The Cost of Not Using a Template
Manual arrow chains take hours and often misalign on screens. Ready diagrams maintain zone segmentation effortlessly.
Connectors sit outside shapes for better projection clarity during live meetings.
Get the file and trace factors instantly.
Which Keynote versions does this template support?
The file opens perfectly in Keynote 12 and newer on macOS. Older versions may need an update to unlock all editable layers. Open the .key file from Downloads to test compatibility right away. Keynote's repair tools fix most version issues in seconds.
How do I change the color scheme in Keynote?
Select any shape or arrow then open the format pane on the right. Pick a new fill color or apply a preset theme to all slides at once. The slide master updates connected elements automatically. Save a custom palette for future decks in under two minutes.
What does the license allow for client work?
You may use the slides in paid client presentations and consulting decks. The license covers commercial projects but prohibits resale or redistribution of the original .key file. Modify content freely for each engagement. Sublicensing the template itself remains forbidden.
How does the paid version differ from the free version?
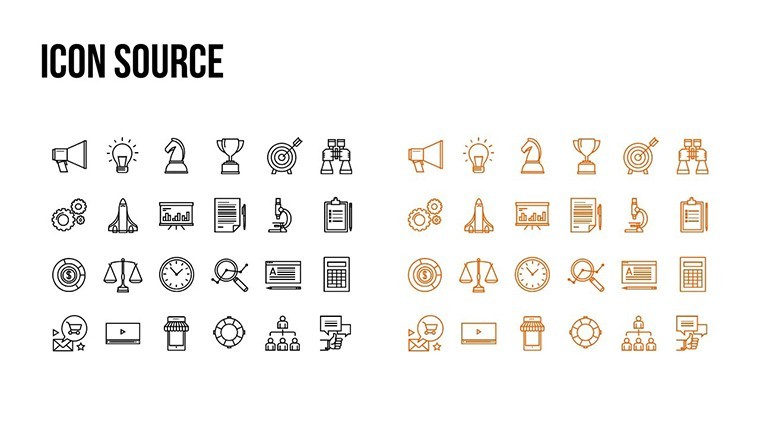
The paid version unlocks the complete 18 editable slides without watermarks. Free previews offer only three sample diagrams with locked layers. Paid buyers receive full icon layers and connector adjustments. This difference saves hours when building complete process decks.
What software is required and what formats are included?
Apple Keynote on macOS is required to open the .key file. No other formats ship with the download. Export options include PDF and images after editing. The single file structure keeps everything organized in one place.
What is the refund policy?
Refunds are available within 30 days if the file fails to open in supported Keynote versions. Contact support with your order details and a screenshot of the issue. Approved cases process within 48 hours. Technical support remains available before any refund request.