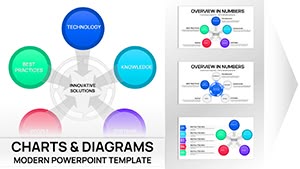
Business Slideshow Keynote Charts Template


Type: Keynote Charts template
Category: Illustrations, Analysis
Sources Available: .key
Product ID: KC00524
Template incl.: 18 editable slides
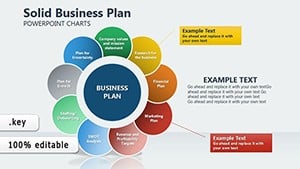
Picture this: a high-stakes boardroom where your slides don't just display data - they tell a compelling story that drives action. The Business Slideshow Keynote Charts template delivers exactly that with 18 editable slides focused on infographics and visuals for maximum impact. Aimed at entrepreneurs, corporate leaders, and educators, it tackles the frustration of bland presentations by offering dynamic tools to illustrate strategies, finances, and more. From startup pitches that secure funding to quarterly reviews that align teams, this template elevates your delivery, drawing on design best practices from firms like McKinsey to ensure every element contributes to clear, persuasive communication.
Key Features Driving Presentation Excellence
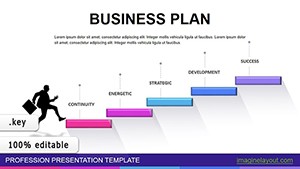
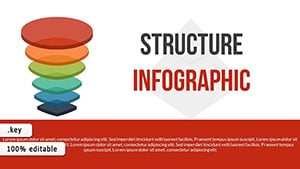
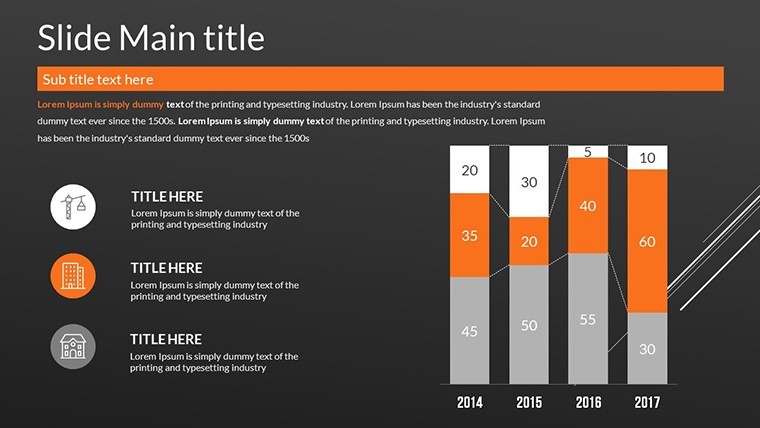
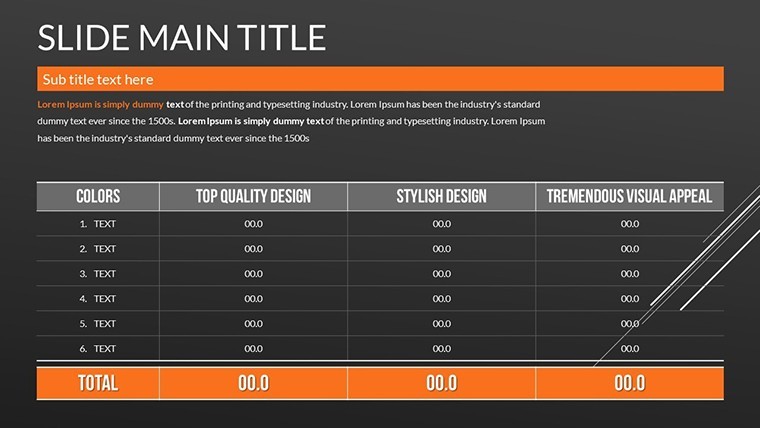
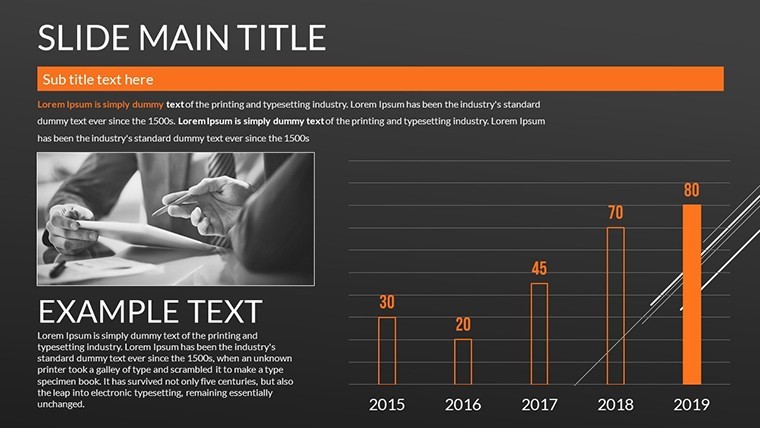
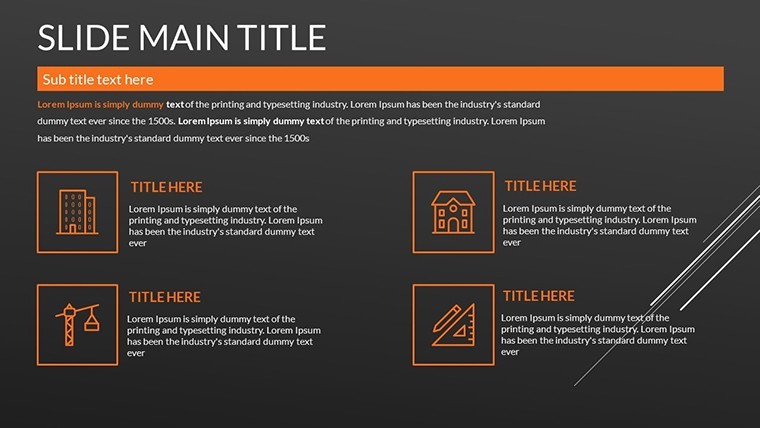
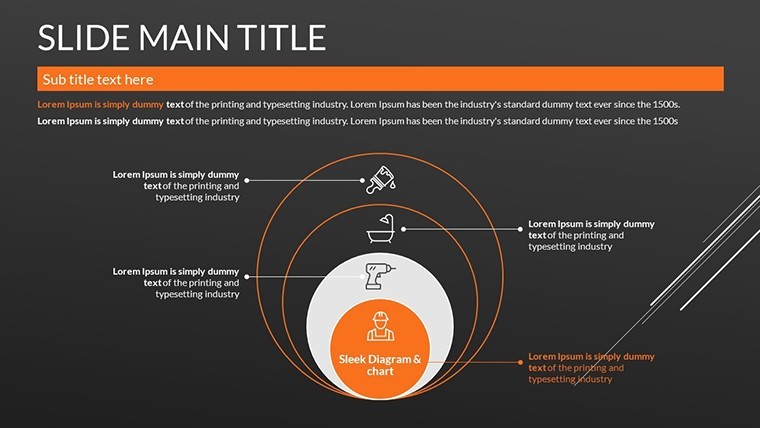
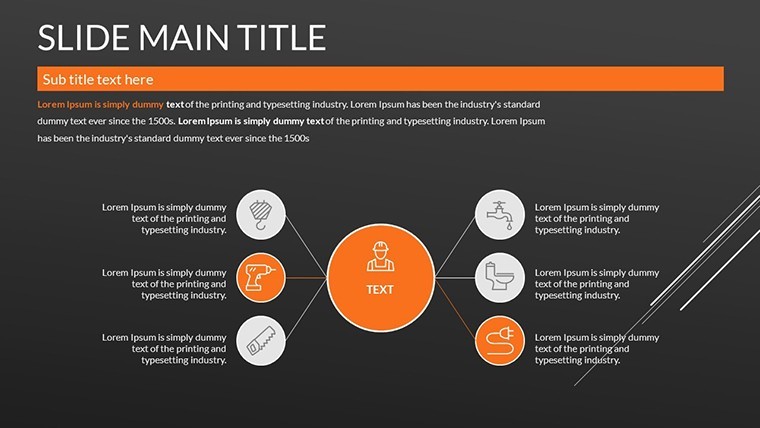
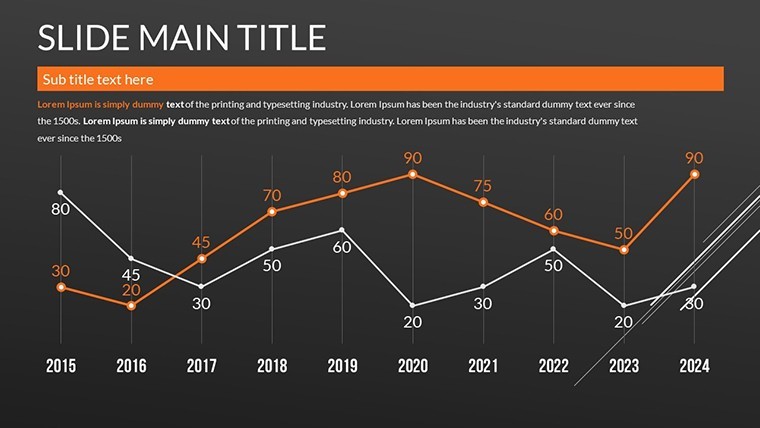
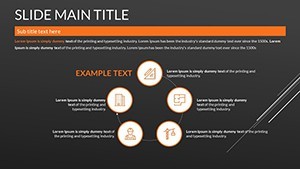
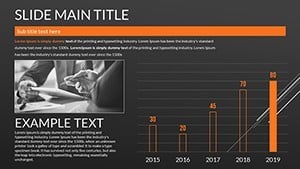
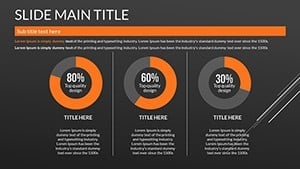
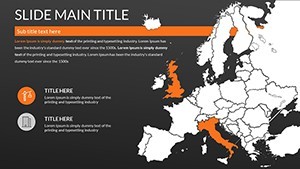
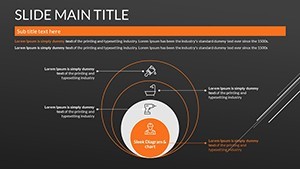
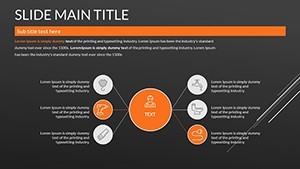
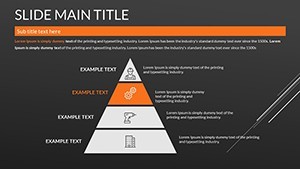
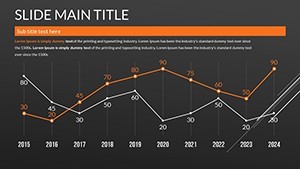
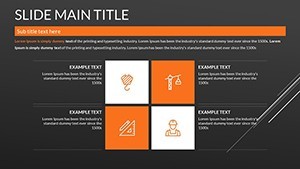
Explore the robust features that make this template a standout. The 18 slides include diverse infographics: funnel charts for sales processes, heatmap grids for risk assessments, and dashboard overviews for KPIs. Each boasts eye-catching designs with storytelling elements, like narrative arcs in sequence diagrams. Flexibility shines through - customize layouts to fit your context, such as resizing icons for emphasis or altering gradients for mood. Ease of use means no design degree required; integrate data via simple inputs, and watch charts update automatically. This surpasses basic slideshows by incorporating professional polish, reducing slide clutter and enhancing focus on core messages.
Infographics for Engaging Data Stories
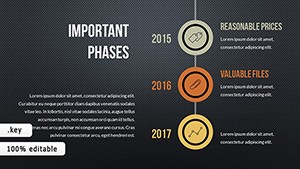
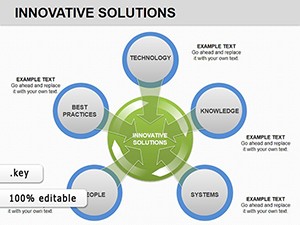
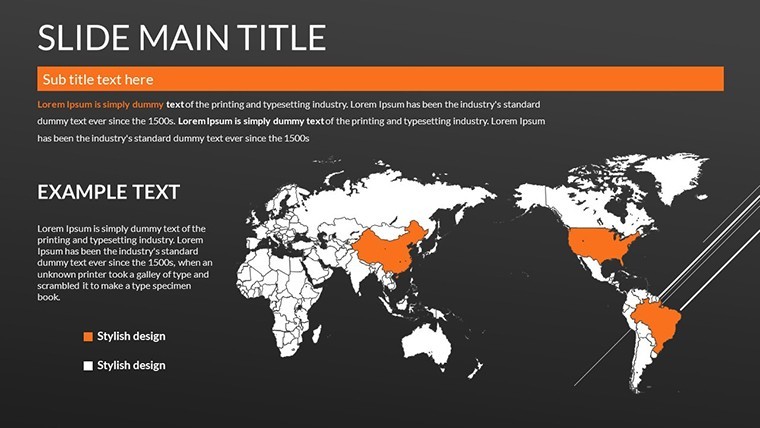
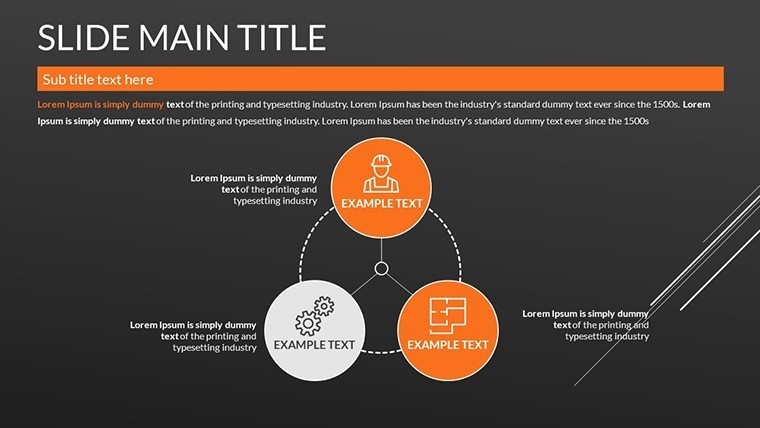
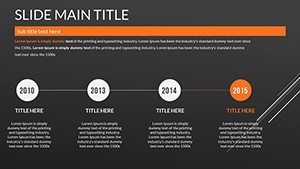
Infographics here are game-changers, transforming numbers into narratives. Use a tree diagram to map organizational hierarchies, with branches editable for team expansions. Visual appeal is key: high-contrast colors ensure legibility, while storytelling prompts like callout boxes highlight insights. Benefits include better retention - research from MIT indicates visuals boost memory by 20%. Tailor for brand alignment, perhaps using your palette in a strategy roadmap slide to visualize five-year plans, fostering strategic discussions.
Diverse Applications for Business Success
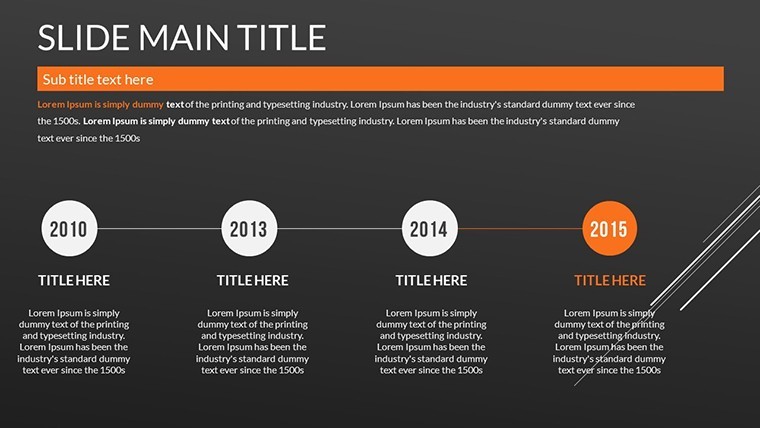
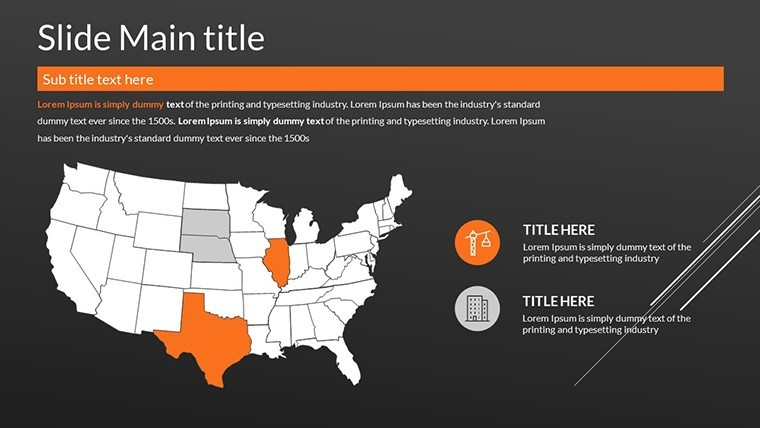
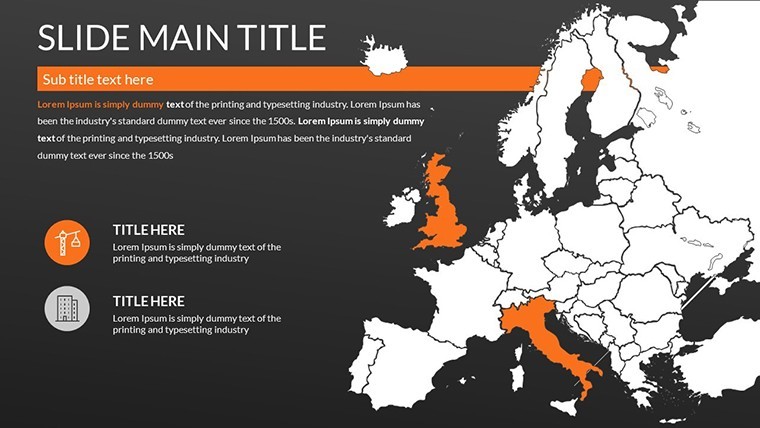
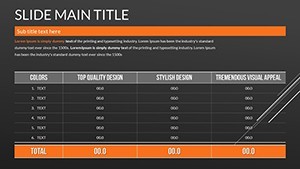
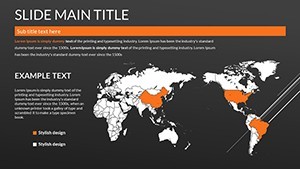
Versatility defines its use cases. In finance, deploy balance sheet infographics to clarify assets vs. liabilities, aiding investor briefings. Marketers can craft campaign timelines with milestone markers, tracking ROI visually. For educators, adapt for business simulations, like supply chain models with flow charts. A real example: a consultant used it for merger analyses, with comparative bar charts illustrating synergies, leading to swift approvals. By solving issues like information overload, it promotes concise, impactful sessions that resonate in fast-paced environments.
Integration and Enhancement Tips
- Start with data import from tools like Excel for accurate visualizations.
- Customize themes: apply filters for a cohesive look across slides.
- Add interactivity: link elements to external resources for depth.
- Test on multiple devices to guarantee cross-platform performance.
- Combine with analytics software for live updates in dynamic presentations.
Pro insights from sources like Forbes emphasize visual storytelling, which this template masters, integrating seamlessly with workflows for efficiency gains.
The Competitive Advantage in Visual Communication
This template excels with tailored features like adaptive infographics for varied sectors, outpacing generic alternatives. Build trust through clean, authoritative designs that reflect expertise. For unique twists, incorporate humor subtly - like a light-hearted icon in a risk slide - to humanize content without diluting professionalism.
Step up your slideshows - grab the Business Slideshow Keynote Charts template and lead with visual mastery now.
Frequently Asked Questions
Why choose this for business meetings?
Its 18 slides offer versatile infographics that make complex info accessible, ideal for engaging stakeholders.
How customizable are the infographics?
Fully; edit shapes, colors, and data to suit your specific business narrative.
Suitable for educational use?
Yes, adapts well for lectures on business topics with clear, visual aids.
What about compatibility with iPad Keynote?
Seamless; works on all Keynote platforms for on-the-go editing.
Can I add my own data sources?
Easily; import from spreadsheets to populate charts dynamically.
Any design tips included?
Basic guidelines in the file; expand with online resources for pro results.