Transfer Credits Keynote Charts Template: Master Financial Transfers with Dynamic Visuals


Navigating the intricacies of credit transfers requires tools that clarify rather than complicate. The Transfer Credits Keynote Charts Template is tailored for this, featuring 14 editable slides with Venn diagrams and tables to illustrate loan scenarios, debt management, and banker interactions. Perfect for financial professionals handling problem loans or bad debts, this template brings structure to situations where lenders change - be it sales to collection agencies or inter-banker shifts. With custom animations and vector icons, it transforms dense financial data into engaging narratives. Compatible with iWork Keynote on Mac, including multiple aspect ratios (16:9, 4:3, 16:10), it offers full editability for colors, text, and photos. Envision presenting a debt transfer strategy where Venn overlaps show shared risks, or tables detail repayment timelines - empowering you to advise clients with confidence and visual precision in every slide.
Essential Features for Financial Clarity
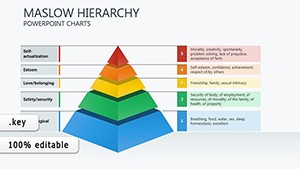
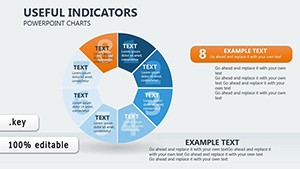
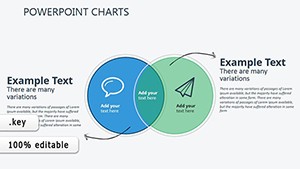
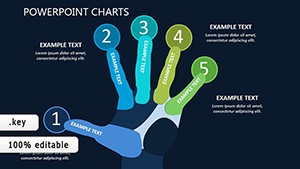
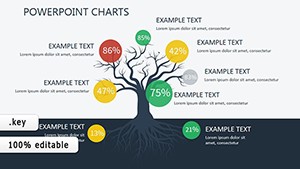
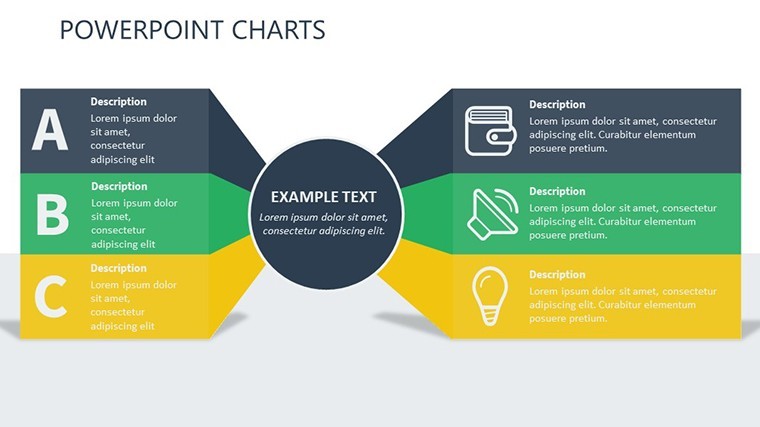
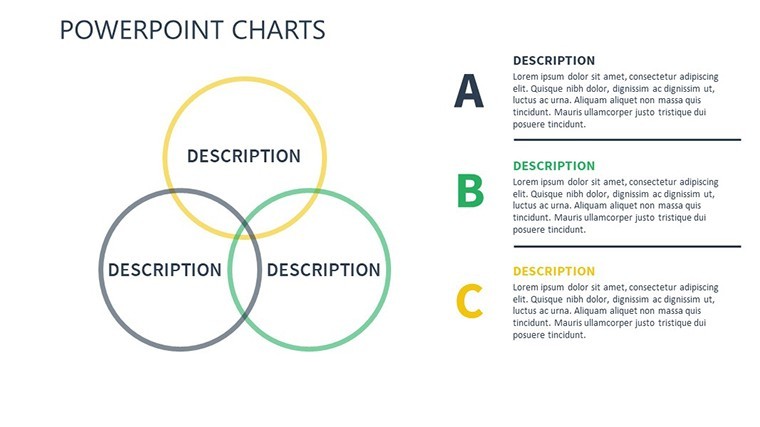
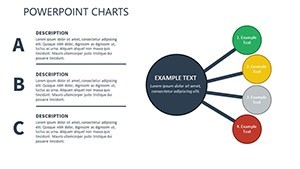
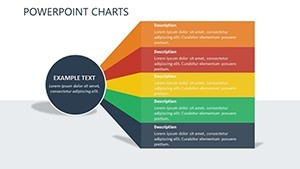
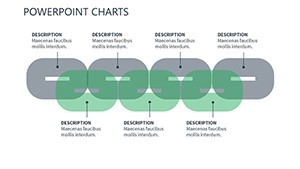
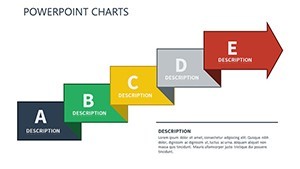
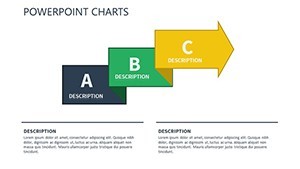
This template stands out with its focus on Venn and table formats, ideal for overlapping credit concepts and tabular data breakdowns. The 14 slides include unique custom designs with colorful variations, ensuring versatility in depicting transfer scenarios.
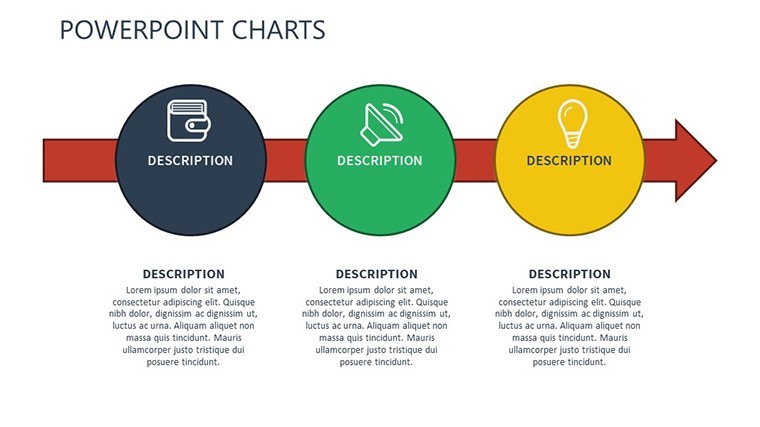
- Animated Effects: Custom transitions that animate data flows, like credit movements between entities.
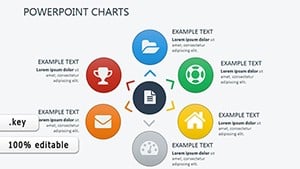
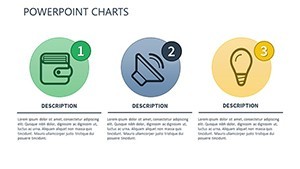
- Vector Icons and PNGs: Included assets for enhancing visuals, such as loan symbols or debt icons.
- Full Customization: Easily alter elements to fit specific financial narratives.
- Multiple Sizes: Adapt to various screens for seamless presentations.
These elements align with banking standards, such as those from the FDIC, emphasizing clear communication in credit handling to avoid misinterpretations.
Targeted Applications in Banking and Finance
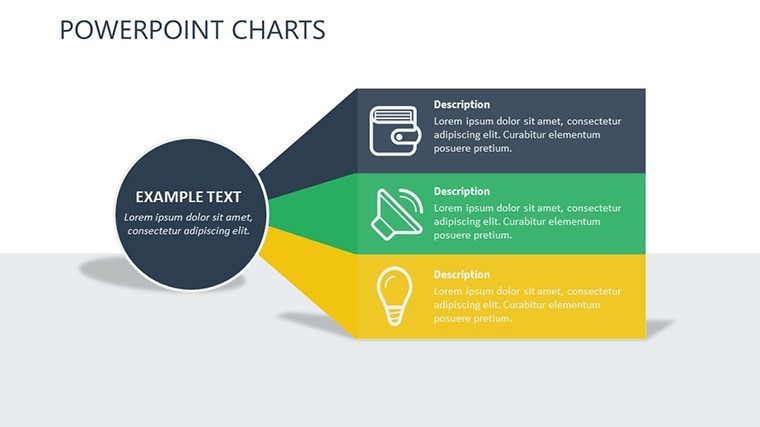
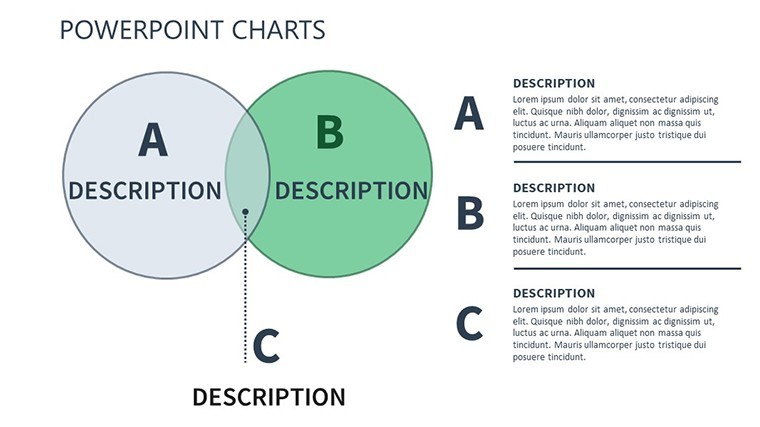
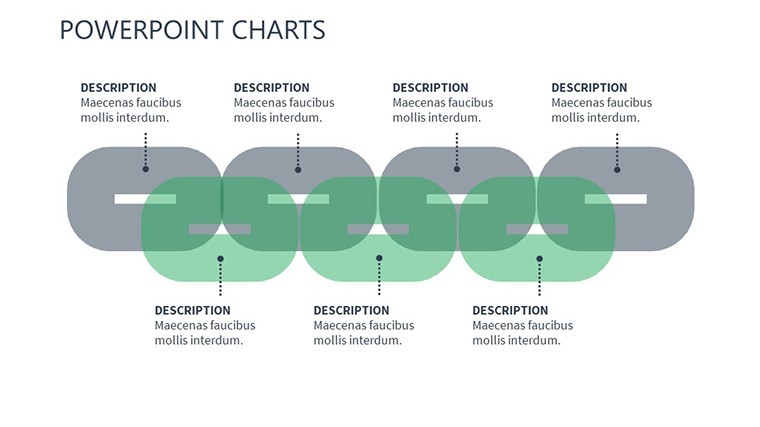
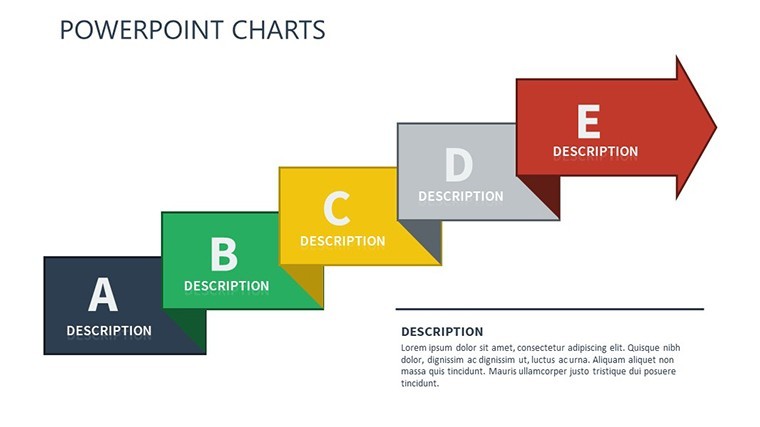
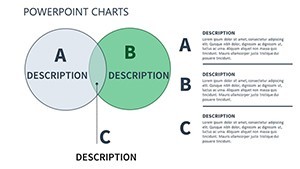
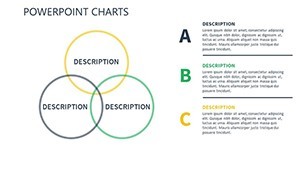
For bankers, use Venn diagrams to overlap borrower profiles with lender options, highlighting transfer viability. In debt management, tables can outline bad loan sales, showing steps from identification to agency handover.
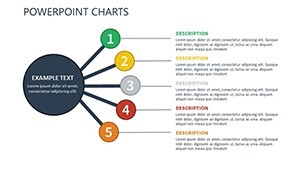
Consultants benefit by visualizing inter-banker transfers, using slides to map impacts on portfolios. Beyond finance, educators in business schools can demonstrate credit dynamics, making abstract theories concrete.
Case Study: Streamlining Debt Recovery
A regional bank adopting similar Venn-table templates reduced presentation prep time by 60%, per a study in the Journal of Banking & Finance. This template achieves similar efficiency by providing ready frameworks for complex transfer discussions.
In compliance training, use charts to illustrate regulatory aspects of credit sales, ensuring teams grasp nuances per CFPB guidelines.
Pro Tips for Effective Customization
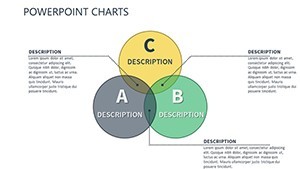
Start by selecting Venn for conceptual overlaps, like shared debts, and tables for quantitative details. Use animations to simulate transfer processes, adding engagement.
- Map your scenario: Identify key entities and use Venn to show intersections.
- Color-code risks: Red for problem loans, green for successful transfers.
- Add data layers: Incorporate icons for visual emphasis.
- Test on devices: Ensure compatibility across aspect ratios.
These strategies, rooted in financial visualization best practices, enhance trustworthiness in your deliverables.
Edges Over Basic Tools
Keynote defaults lack the thematic animations; this $18.40 template, with 900 ratings, delivers polished, finance-specific designs. It's superior to free options by including editable assets, crucial for professional credibility.
Compared to general charts, its credit-focused elements provide niche value for targeted audiences.
Easy Integration into Financial Workflows
Open in Keynote, input loan data, and customize for reports or meetings. For teams, share via iCloud; pair with matrix templates for deeper analyses.
In client sessions, use for interactive transfer simulations.
Secure Your Financial Presentation Edge Today
Don't settle for unclear credit visuals. Download the Transfer Credits Keynote Charts Template now and master transfers with style.
Frequently Asked Questions
How do Venn diagrams aid credit transfers?
They illustrate overlaps in lender-borrower relationships, clarifying transfer complexities.
Are animations easy to edit?
Yes, Keynote's interface allows simple adjustments to timing and effects.
Suitable for non-bankers?
Yes, adaptable for education or consulting in finance-related fields.
What icons are included?
Vector and PNG files for loans, debts, and transfers, fully editable.
Does it support widescreen?
Yes, includes 16:9, 4:3, and 16:10 ratios for flexibility.
Can I add photos?
Absolutely, slides support easy photo insertion and editing.