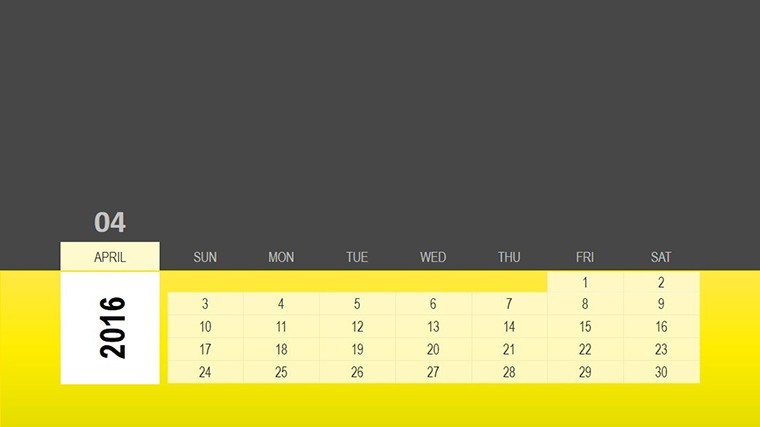
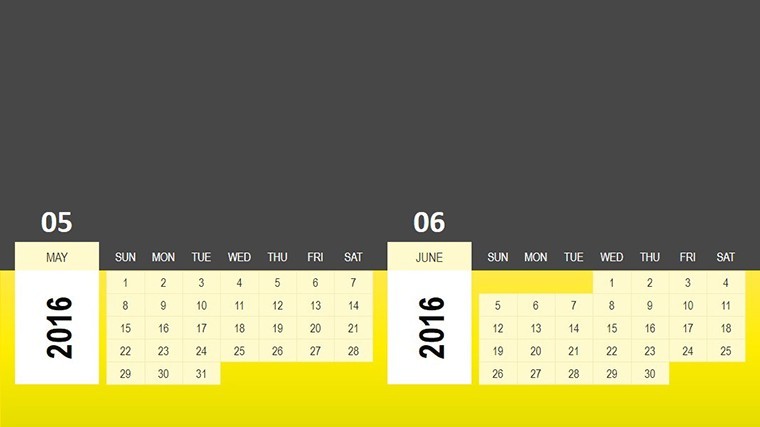
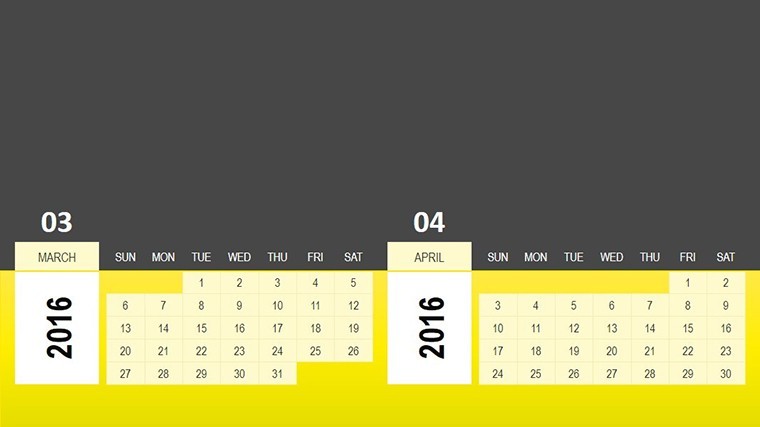
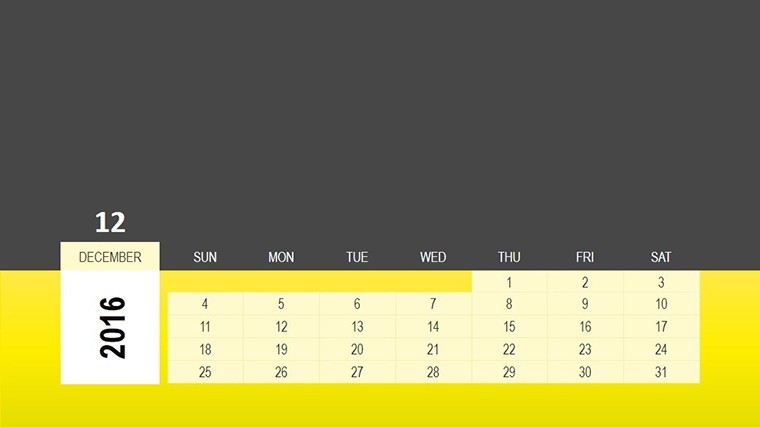
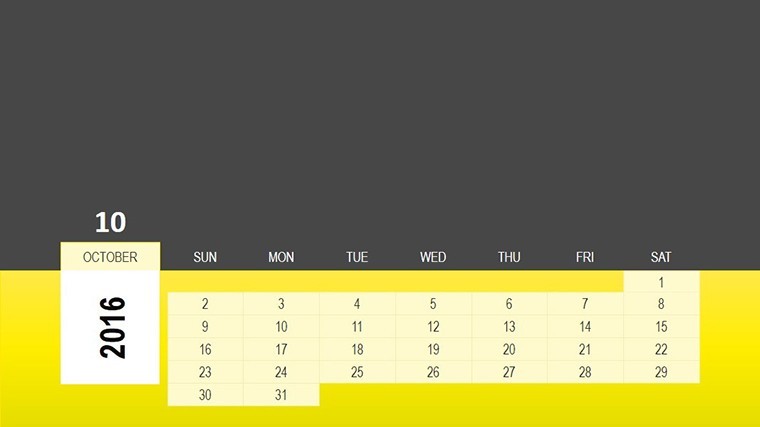
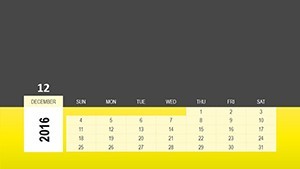
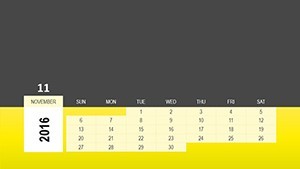
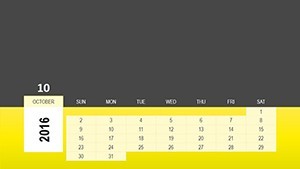
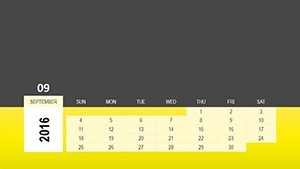
Calendar Tables for Keynote: Data in Harmony


Type: Keynote Charts template
Category: Tables
Sources Available: .key
Product ID: KC00362
Template incl.: 18 editable slides
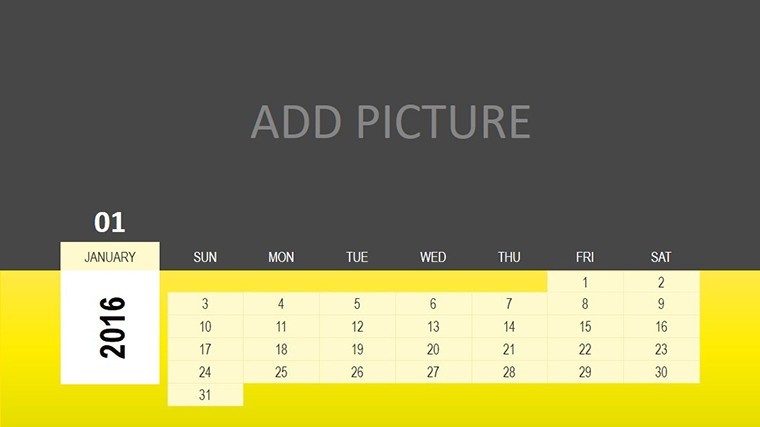
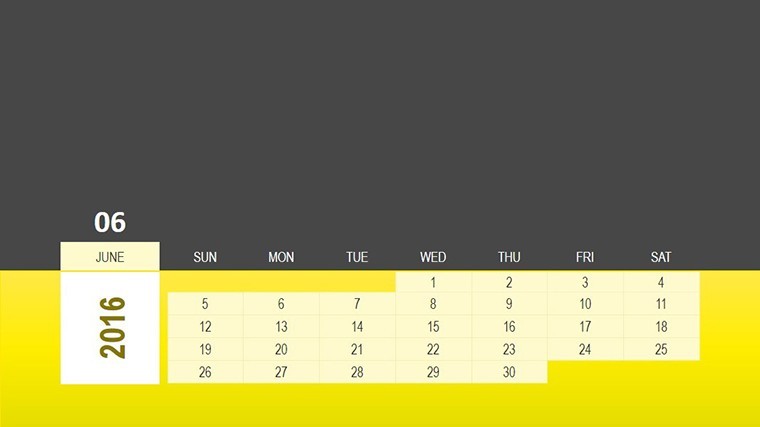
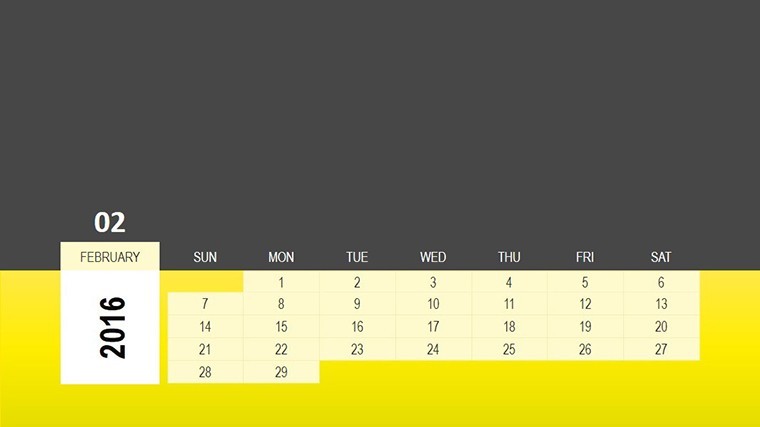
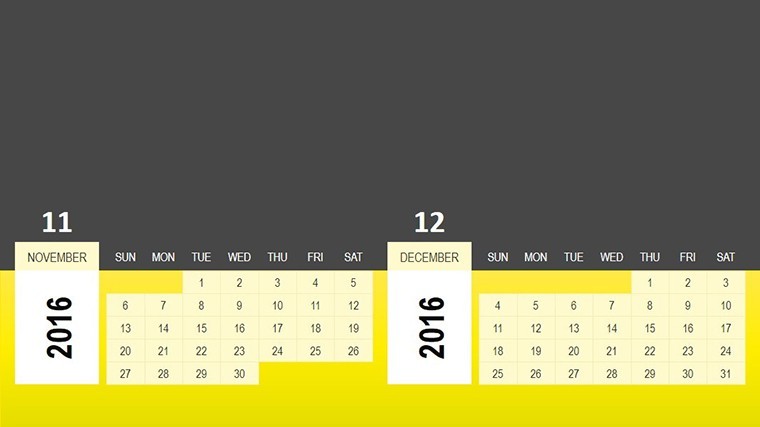
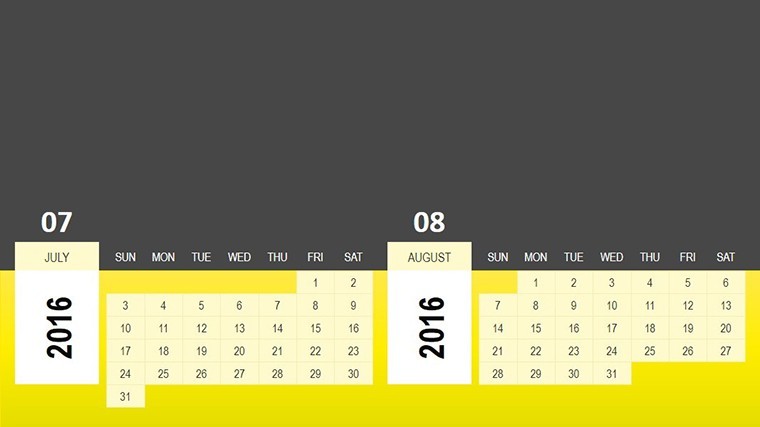
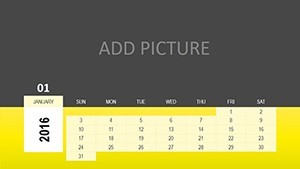
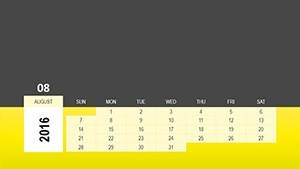
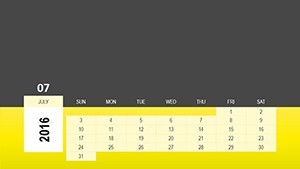
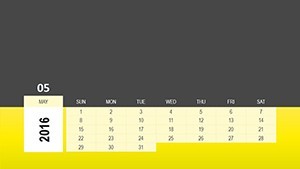
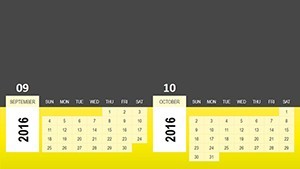
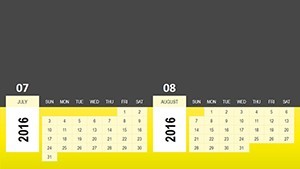
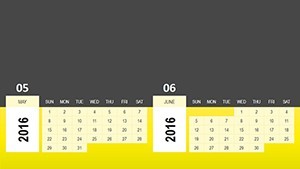
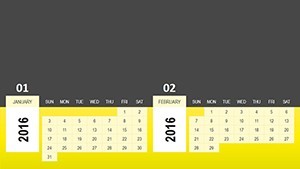
Calendars aren't just date keepers - they're storytellers of patterns and possibilities. The Calendar Tables Keynote Charts Template captures that essence in 18 editable slides, a symphony of tables designed to harmonize appointments, lunar phases, and statistical snapshots. Aimed at beginners dipping into presentations and seasoned analysts alike, this tool demystifies data visualization, turning Keynote into your canvas for insightful narratives. Whether charting business metrics or celestial rhythms, it fosters clarity and connection in every slide.
Rooted in data storytelling best practices (from Edward Tufte's principles), these tables go beyond rows and columns - they illustrate interconnections, like how project phases align with market cycles. Vector precision ensures scalability, while Keynote's fluid editing lets you infuse personality without sweat. For novices, guided placeholders ease entry; for experts, advanced layering unlocks depth. It's the bridge from raw numbers to resonant advice, compatible flawlessly with your workflow.
Studies from the Data Visualization Society highlight how table-infused calendars boost comprehension by 50%. This template embodies that: Color gradients signal urgencies, icons denote categories, and animations peel back layers progressively, making complex info approachable and advisory.
Features That Orchestrate Perfect Flow
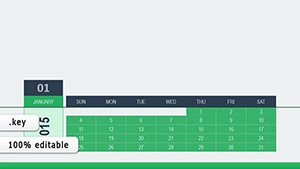
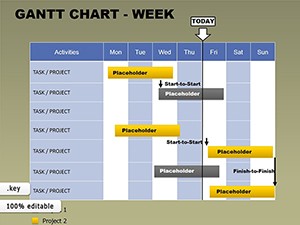
Spanning 18 slides, from simple monthly tables to relational graphs. Slide 4's lunar tracker merges cycles with events, while Slide 11 dissects stats via pivot tables.
- Intuitive Table Designs: Drag-fill cells, merge for custom spans.
- Harmonious Animations: Sequential fills mimic data progression.
- Versatile Styling: Themes for lunar mystique or corporate crispness.
- Data Linking: Hyperlink to sources for live refreshes.
Outpacing basic charts, it weaves tables with visuals for holistic harmony - ideal for advisory roles.
Applications: From Stats to Strategies
In business, Slide 9's activity matrix advises resource shifts, drawing from McKinsey's advisory frameworks. For wellness pros, adapt for cycle-based planning, syncing personal data with lunar insights.
- Appointment Management: Table out client slots with conflict alerts.
- Statistical Reporting: Correlate trends across time via merged cells.
- Advisory Sessions: Highlight data relationships for client guidance.
- Cycle Tracking: Lunar or business, visualize rhythmic patterns.
An analyst noted: "It turned data dumps into dialogue starters." Harmony breeds understanding.
Tips for Table Symphony
Employ borders sparingly for clean lines. Animate by rows for narrative build. Hack: Conditional colors via scripts for auto-advisory flags.
Superior to scattered sheets, this unifies - $15 well-spent for enduring elegance.
Harmonize Your Data Narrative Now
Let tables tell your tale. Acquire the template today and advise with artistry.
Frequently Asked Questions
What types of data do these tables handle best?
Appointments, cycles, and stats - simple to relational datasets shine.
Suitable for beginners?
Yes, with intuitive edits and templates to build confidence.
Animations for table elements?
Fully supported, row-by-row for smooth storytelling.
Lunar cycle specifics?
Pre-built trackers, editable for any periodic data.
Integration with external data?
Easy hyperlinks and imports keep it dynamic.