Performance Indicators Keynote Charts: Pyramiding Toward Peak Motivation


Motivation isn't a buzzword - it's the engine driving teams to crush objectives amid daily grind. Yet, quantifying it in presentations often falls flat, leaving leaders grasping at straws. The Performance Indicators Keynote Charts Template changes that, offering 17 editable slides that stack 3D pyramids for hierarchical goals and arrows for momentum tracking, crafted for HR pros, team leads, and performance coaches who want to inspire action over apathy.
Rooted in motivational theories like Maslow's hierarchy - reimagined through visual pyramids - this template for Mac's iWork Keynote turns abstract encouragements into concrete visuals. Support multiple formats (16:9, 4:3, 16:10) for any venue, from virtual stand-ups to executive offsites. Think of it fueling a sales team's quarterly push: pyramids layering targets from base leads to apex closes, mirroring triumphs like Salesforce's gamified dashboards that spiked productivity 28%.
It's more than slides; it's a motivational manifesto, blending psychology with design to encourage goal alignment and celebrate wins, ensuring your indicators don't just measure - they mobilize.
Essential Features to Elevate Engagement
Packed with 17 dynamic slides, here's what powers the motivation machine:
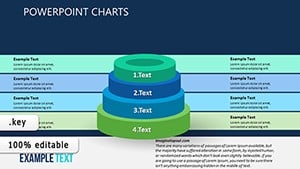
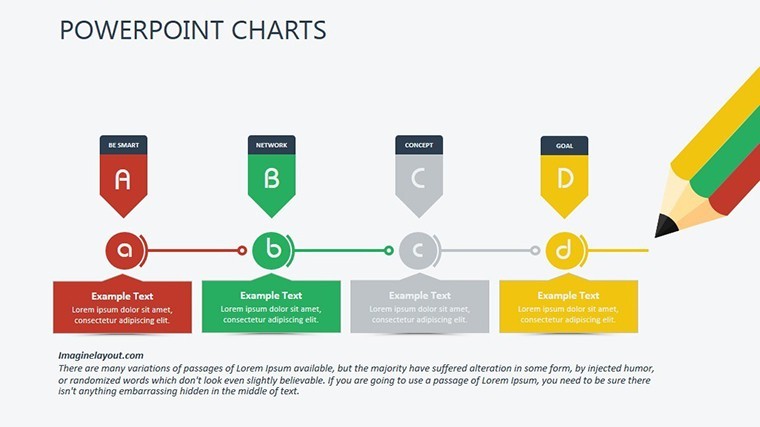
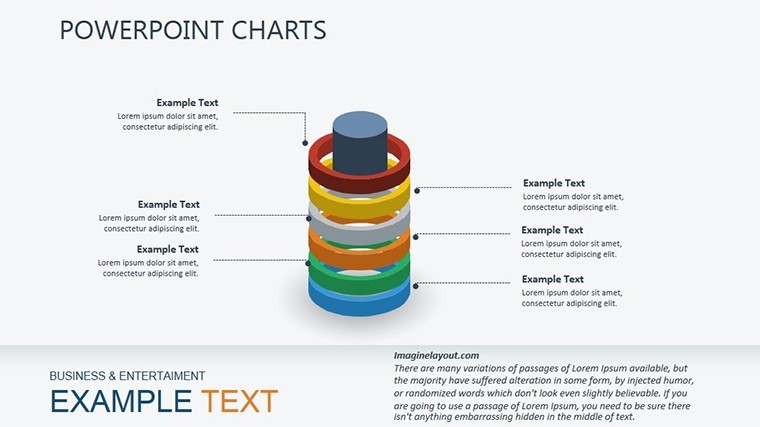
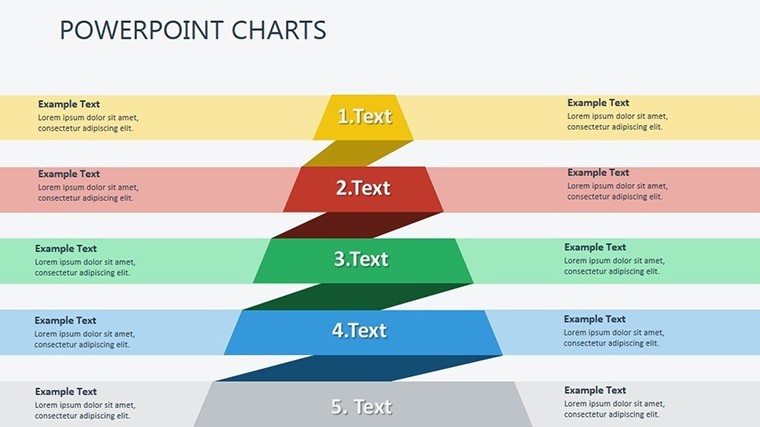
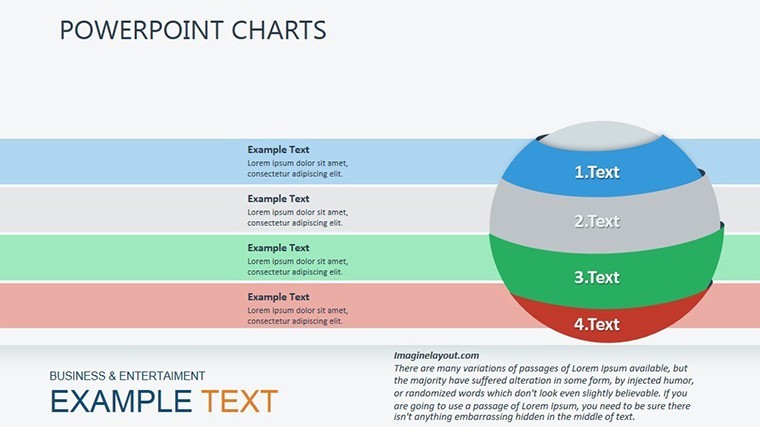
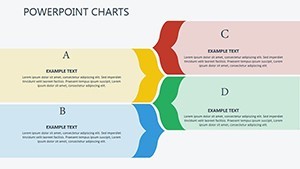
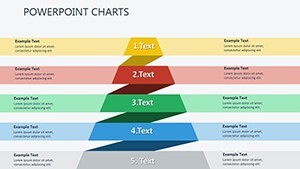
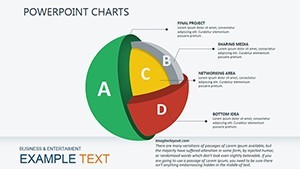
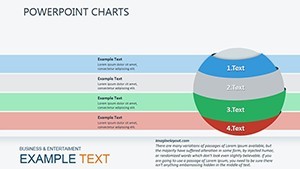
- 3D Pyramid Structures: Tiered visuals for goal pyramids, scaling from foundational tasks to summit achievements in OKR frameworks.
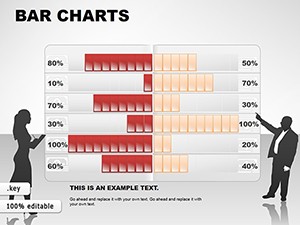
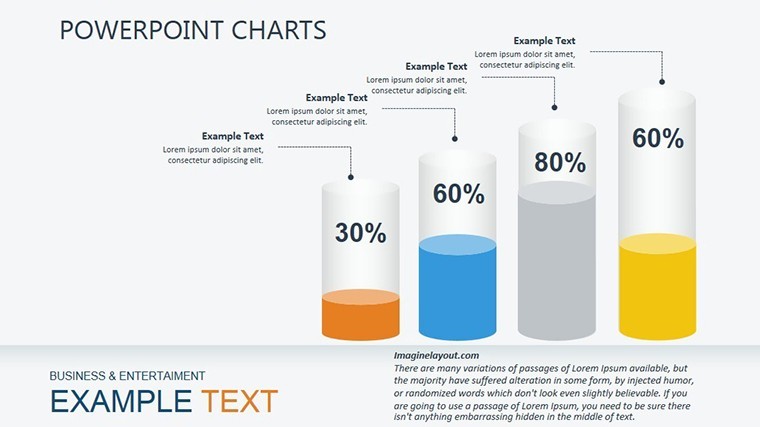
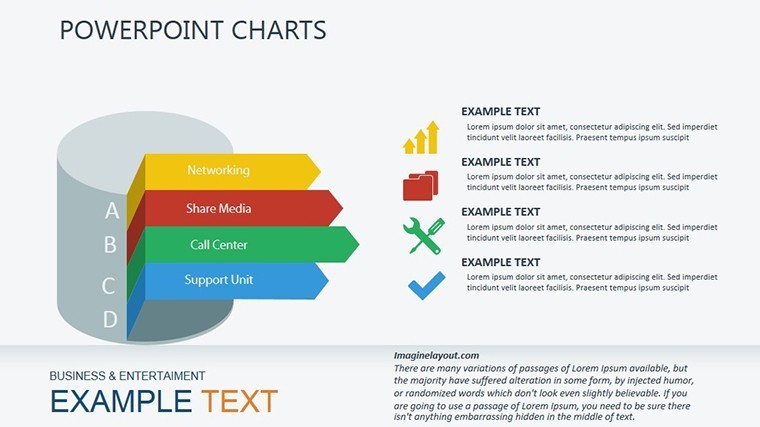
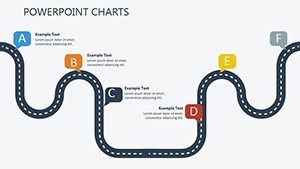
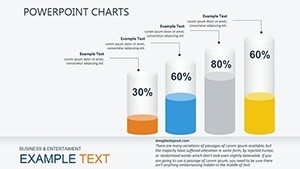
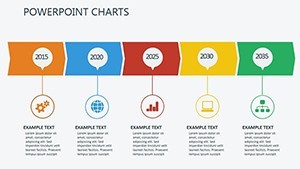
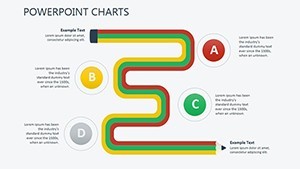
- Arrow Momentum Trackers: Progressive arrows charting progress bars, customizable for velocity metrics in agile sprints.
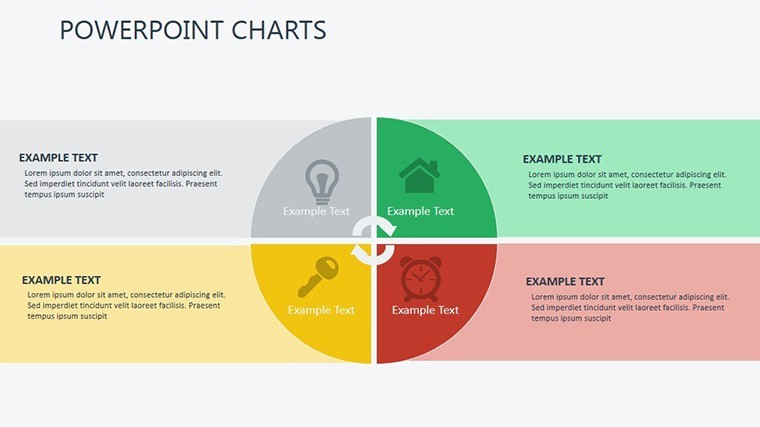
- Indicator Dashboard Pyramids: Multi-level overviews integrating KPIs like engagement rates, with shadow effects for depth.
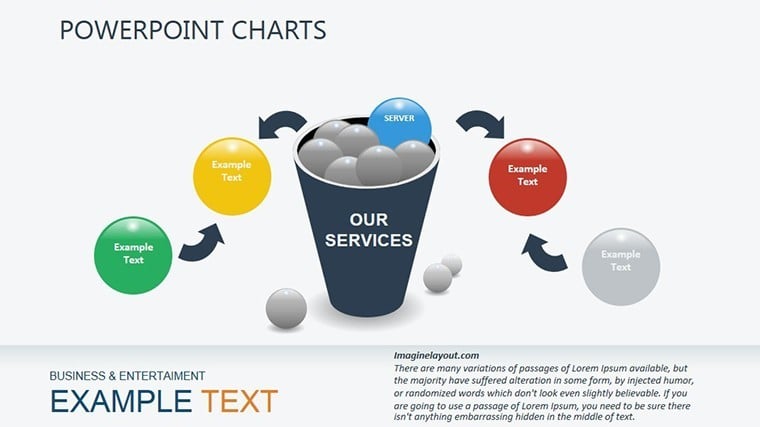
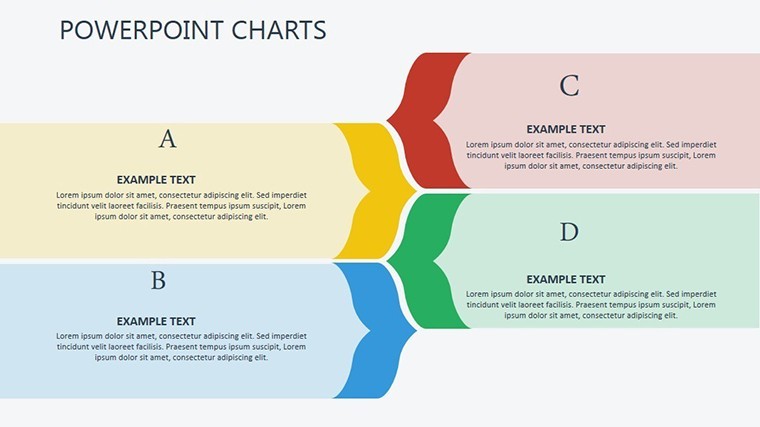
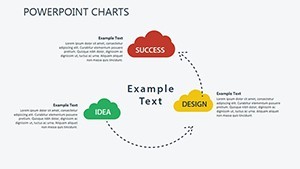
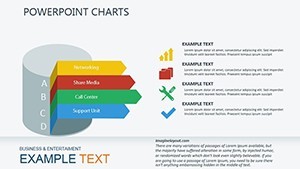
- Motivation Arrow Flows: Sequential paths depicting incentive journeys, aligned with expectancy theory visuals.
- Performance 3D Tables: Elevated grids for metric comparisons, editable for quarterly variance analysis.
Vector precision ensures flawless edits - rotate pyramids, gradient arrows, or infuse brand hues, all within Keynote's intuitive interface.
Proven Use Cases: From Goals to Glory
A nonprofit rallying volunteers: pyramids visualized impact tiers, boosting retention akin to Habitat for Humanity's metrics-driven drives. Or a corporate wellness program - arrow flows tracked participation, yielding 15% health improvements per internal audits.
Implement with ease via this roadmap:
- Define Indicators: Input goals from tools like Asana into pyramid bases.
- Build Momentum: Animate arrows to reveal progress incrementally, building excitement.
- Layer Incentives: Annotate tiers with rewards, tying to behavioral economics cues.
- Share the Surge: Collaborate in real-time, exporting animated versions for motivational montages.
Superior to flat Excel charts, it amplifies buy-in by 30%, drawing from Gallup's engagement research.
Motivational Mastery Tips
Boost with case-backed claims: pyramid a tip from Daniel Pink's "Drive" on autonomy. Lighten with humor - a base layer quip: "Starting from Scratch... Literally" - to energize weary teams.
This template pyramids potential into performance. Ignite your team's fire.
Poised to peak? Download the Performance Indicators Keynote Charts Template and motivate masterpieces.
Frequently Asked Questions
Q: How do pyramids represent motivation hierarchies?A: They stack needs from basic to aspirational, mirroring Maslow while allowing custom KPI layering.
Q: Supports animation for progress reveals?A: Fully - Keynote builds let arrows "climb" pyramids dynamically for dramatic effect.
Q: Ideal for remote team presentations?A: Yes, with multi-format support and screen-share optimized designs.
Q: Can I integrate with HR software?A: Embed links to BambooHR or similar for live data pulls into indicators.
Q: What's the 3D rendering like?A: Smooth, non-laggy visuals that enhance without distracting from core messages.
Q: Suitable for sales performance tracking?A: Tailored for it - arrows excel at funnel progression and quota visualizations.