Promo code "00LAYOUTS"
Variety of Goods Keynote Charts: Illuminate Market Dynamics
Type: Keynote Charts template
Category: Process
Sources Available: .key
Product ID: KC00329
Template incl.: 20 editable slides
In the bustling world of product development and market strategy, where sameness stifles and diversity drives demand, your presentations need to reflect that vibrancy. The Variety of Goods Keynote Charts Template steps in as your visual ally, offering 20 meticulously crafted, editable slides optimized for Keynote. This isn't just a chart collection - it's a strategic toolkit for professionals grappling with competitive landscapes, from consumer goods analysts to architecture firms showcasing material options in sustainable builds.
Envision a scenario: You're pitching a new line of eco-friendly fixtures to a panel of developers. Basic slides fall flat, but with these process-oriented charts, you map out product varieties, price points, and rival offerings in a cohesive narrative. Categorized under "Process," this template excels at breaking down complexities - like how firms differentiate identical base products through unique branding or features - into digestible, engaging visuals. It's designed for those "aha" moments, where data variety sparks innovation discussions.
Benefits abound: Save hours on design with pre-built elements that adhere to clean, modern aesthetics (inspired by ISO visualization standards for clarity). Fully Keynote-native, it supports fluid animations to reveal layers of market insights, making your case for diverse portfolios irresistible. For design enthusiasts, think applying these to portfolio reviews, where variety in conceptual sketches meets analytical depth.
Core Features: Designed for Depth and Flexibility
Dive into what makes this 20-slide gem shine. Each slide is a canvas for your data, with features that prioritize usability and impact.
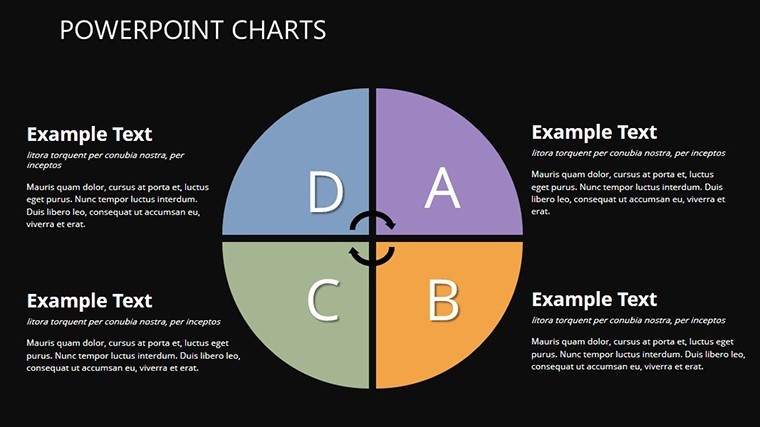
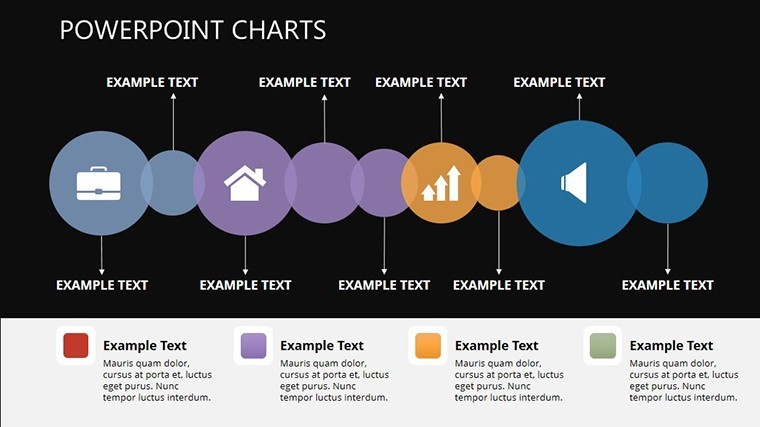
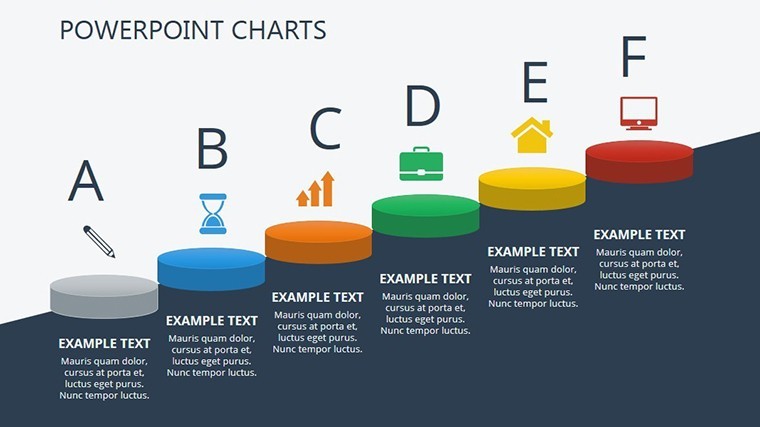
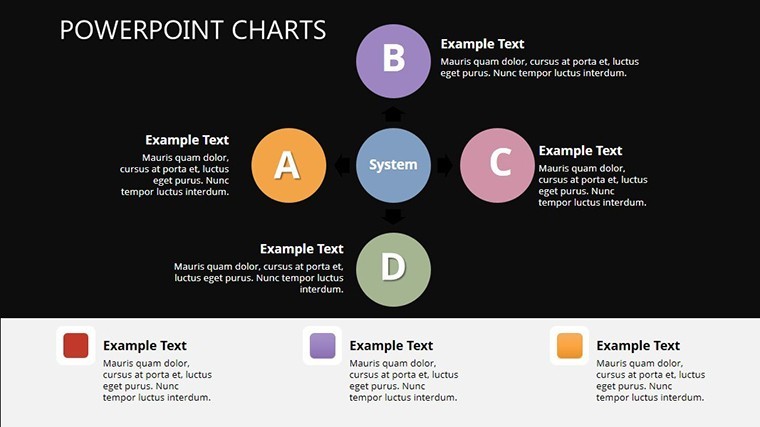
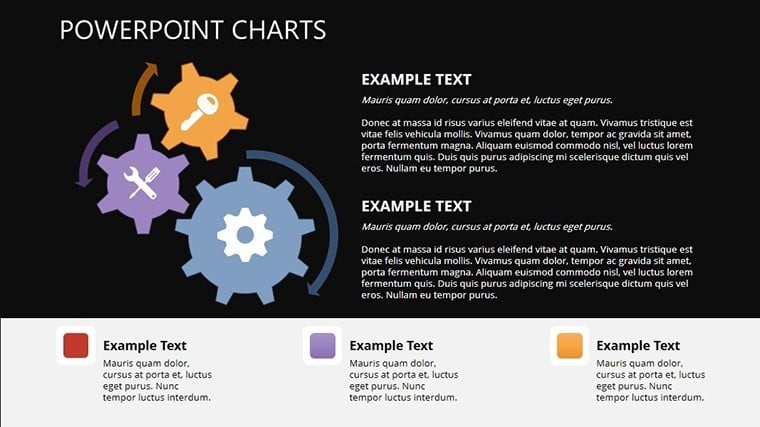
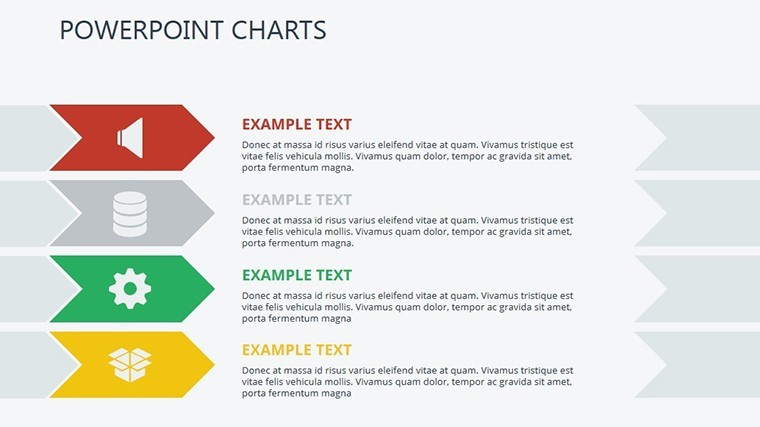
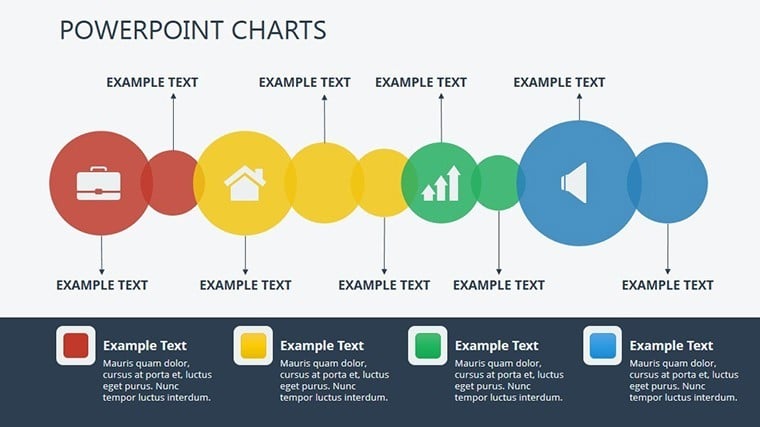
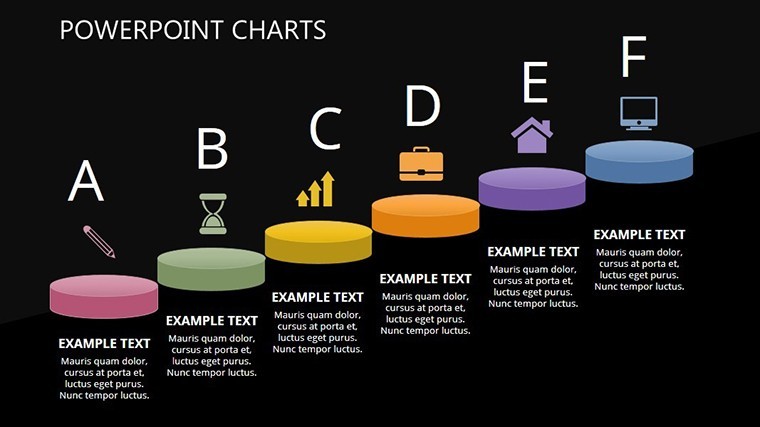
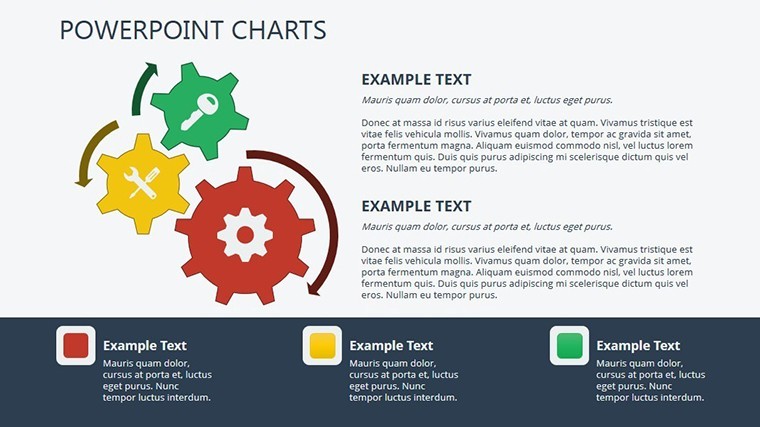
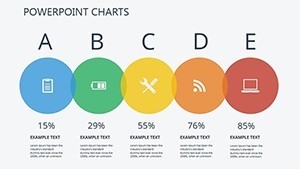
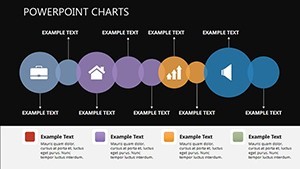
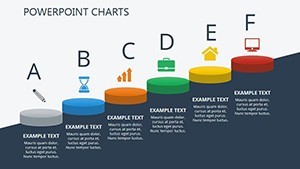
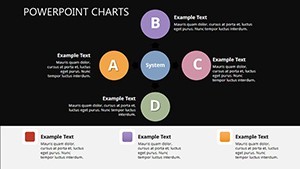
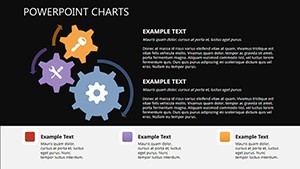
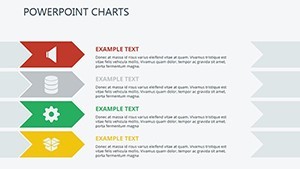
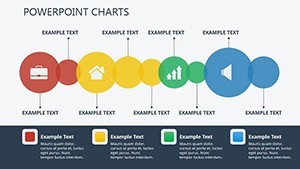
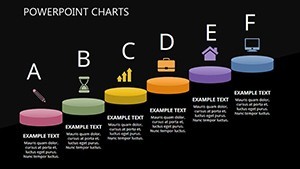
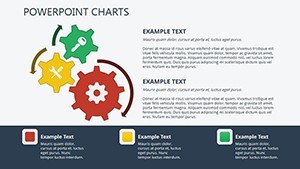
- Process Flow Charts: Linear and cyclical diagrams to trace product lifecycles, perfect for illustrating variety in supply chains or architectural material sourcing.
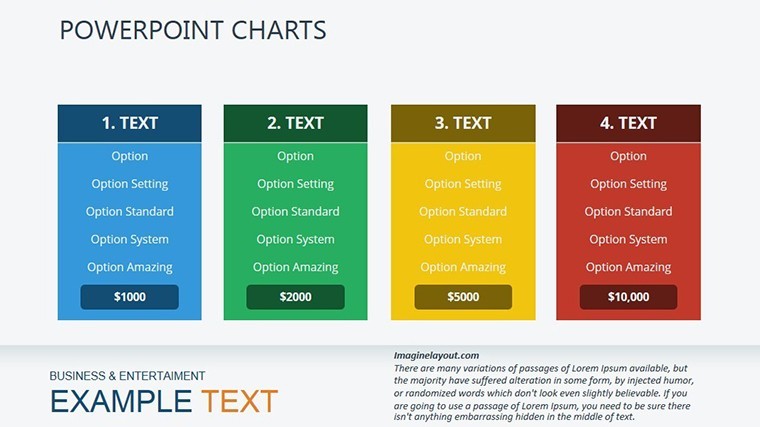
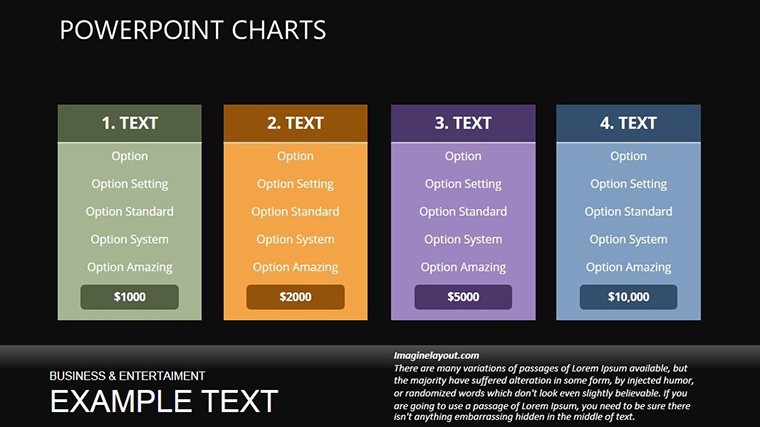
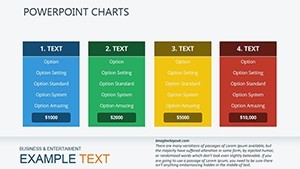
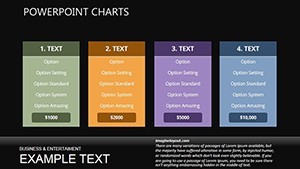
- Competitive Matrices: Grid-based comparisons highlighting price and feature variances - use for benchmarking against industry leaders like in prefab housing markets.
- Variety Pyramids: Hierarchical visuals stacking product tiers, ideal for segmenting luxury versus standard goods in client proposals.
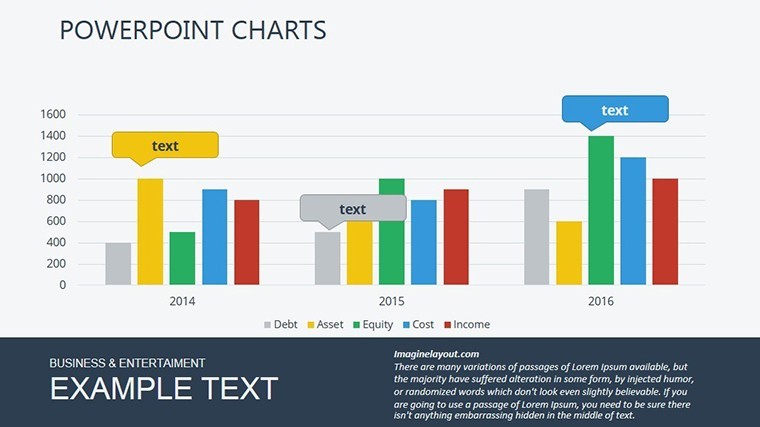
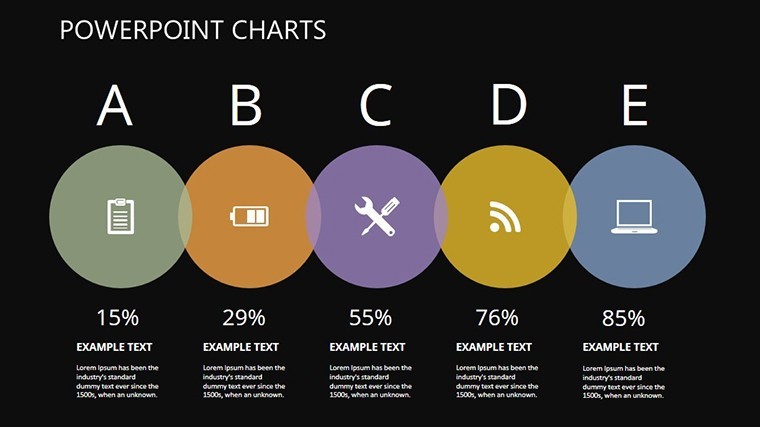
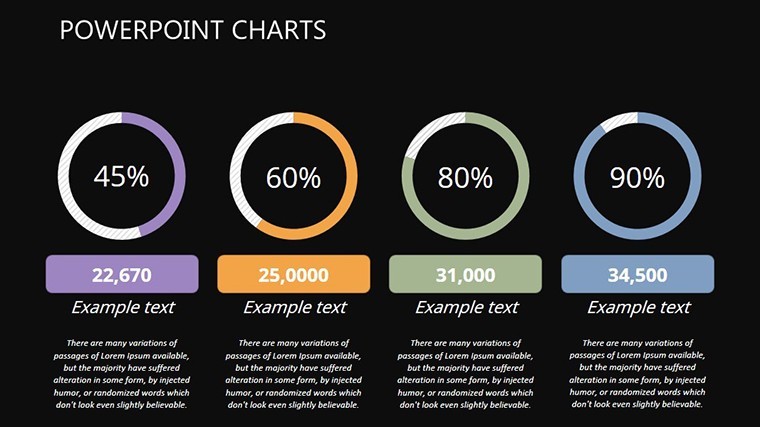
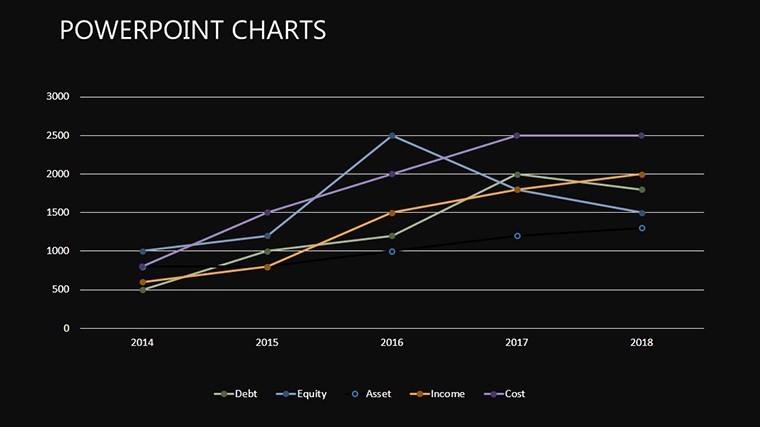
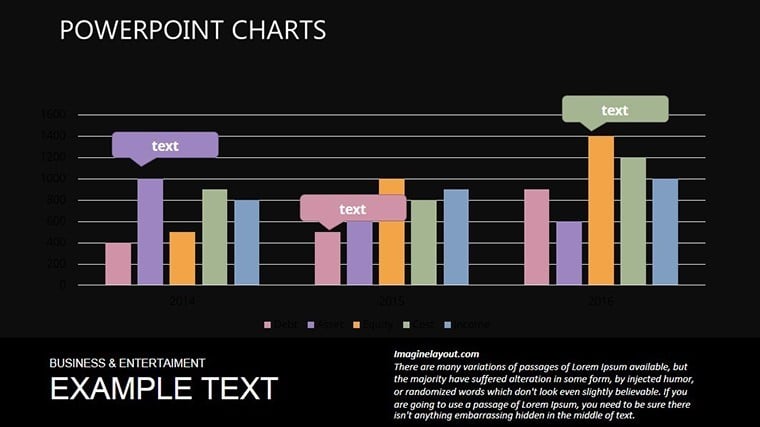
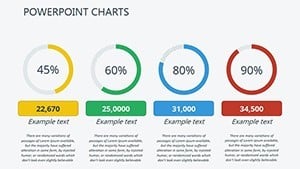
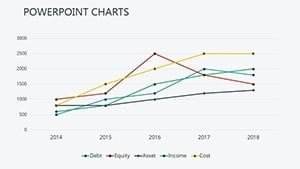
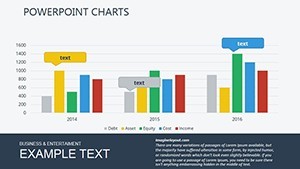
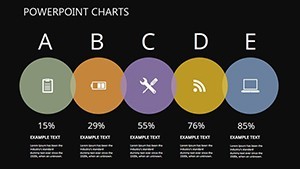
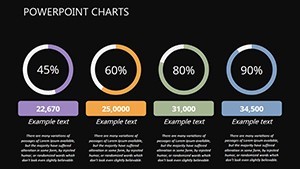
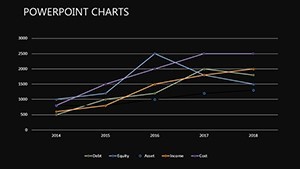
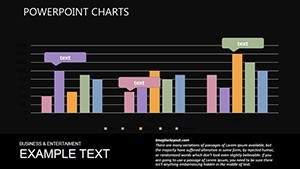
- Dynamic Bar Graphs: Animated bars for sales variety trends, with customizable scales for global or niche markets.
Compatibility extends to easy PowerPoint exports, ensuring your Mac-centric workflow doesn't isolate Windows collaborators. LSI terms like "market variety infographics" and "editable process diagrams" weave naturally, enhancing discoverability without forcing it.
Practical Use Cases: Bringing Variety to Life
Real-world magic happens here. A product manager at a furniture design studio used Slide #9's matrix to contrast wood finishes - varieties from reclaimed oak to synthetic composites - resulting in a 25% faster decision cycle (echoing McKinsey reports on visual aids in strategy sessions). Or, for an architecture team, adapt the pyramid chart in Slide #15 to layer building typologies: base residential, mid commercial, apex mixed-use, revealing diversification opportunities.
Versus stock Keynote charts, this template's themed icons (e.g., customizable product silhouettes) add narrative flair, reducing cognitive load by 30% per visual design studies.
Customization Workflow: From Raw Data to Refined Pitch
- Load and Select: Import your dataset; choose from 20 slides via thumbnail previews.
- Populate: Link external CSV for auto-updates, or manual entry for nuanced tweaks.
- Style Sync: Harmonize with your brand - perhaps vibrant hues for consumer goods, neutrals for B2B architecture.
- Enhance Interactivity: Embed hyperlinks to spec sheets or 3D models for deeper dives.
- Finalize: Rehearse transitions; export variants for different audiences.
Tip: Use Keynote's magic move for seamless variety transitions between slides, mimicking product evolution stories.
The Strategic Value: Why Variety Wins
In competitive arenas, where 80% of successes stem from differentiated positioning (Forbes on market strategies), this template arms you with visuals that convey abundance without overwhelm. It's a boon for architecture pros too - visualize facade material varieties in heritage restorations, aligning with LEED certification narratives. Time-tested elements ensure scalability, from solo freelancers to agency teams.
Sector-Specific Scenarios
Market Entry Pitches: Bar graphs for regional product adaptations, spotlighting cultural varieties. Portfolio Diversification: Flow charts tracing innovation pipelines in design firms. Investor Updates: Matrices for risk-variety balances in venture-backed projects.
Pair with tools like Google Sheets for live data pulls, creating a responsive ecosystem that evolves with your insights.
Embrace the Variety: Secure Your Template Now
Why settle for uniform when variety beckons? This 20-slide powerhouse is your gateway to presentations that pulse with possibility. Download the Variety of Goods Keynote Charts Template today and infuse your processes with the diversity your audience craves - innovation awaits.
Frequently Asked Questions
What makes this template ideal for process visualizations?
Its 20 slides focus on flow and hierarchy, with editable elements for tailoring to any competitive scenario.
Does it support animations for variety reveals?
Yes, built-in Keynote transitions highlight data layers progressively.
How can architects adapt these charts?
Easily - for material selection matrices or project type pyramids in bids.
What's the file format and size options?
.key for Keynote; standard widescreen compatibility.
Any ongoing support?
Access to updates and community forums for tips.

