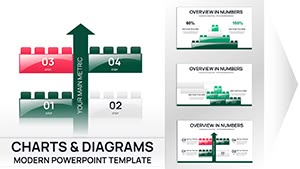
Block Plate Keynote Charts Template: Modern Sleek Designs for Professional Presentations


In today's fast-paced business world, where data drives decisions, presenting information in a visually compelling way can make all the difference. The Block Plate Keynote Charts Template steps in as your ultimate tool for transforming complex datasets into clear, engaging narratives. With its modern and sleek design inspired by 3D structures like cubes and pyramids, this template is ideal for professionals in fields such as architecture, engineering, and corporate strategy. Imagine showcasing project timelines or market analyses with charts that pop off the screen, drawing your audience in and holding their attention. This isn't just a set of slides - it's a gateway to more persuasive pitches, whether you're pitching to clients, reporting to stakeholders, or educating teams.
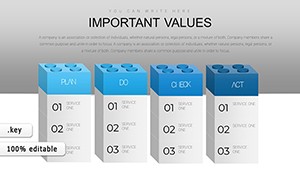
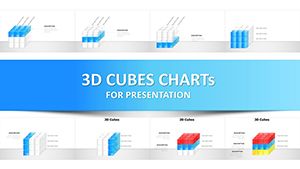
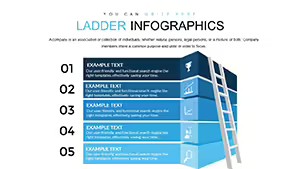
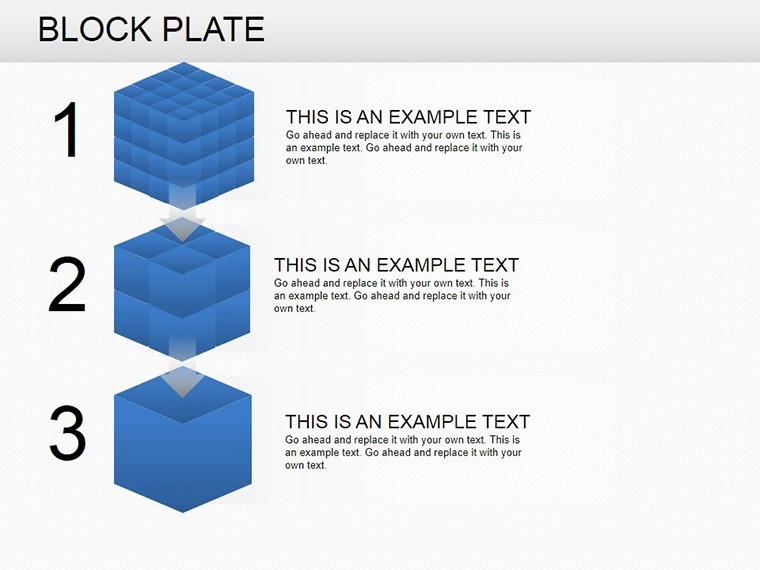
Designed specifically for Apple Keynote users, this template offers 11 fully editable slides that blend functionality with aesthetic appeal. Each slide is crafted to highlight data through innovative 3D visualizations, making abstract concepts tangible. For instance, architects can use pyramid charts to illustrate hierarchical project structures, while business analysts might leverage cube-based bar graphs to demonstrate multi-dimensional growth metrics. The template's compatibility ensures seamless integration with your existing workflow, allowing you to import data effortlessly and adjust elements to fit your brand's style.
Unlocking the Power of 3D Data Visualization
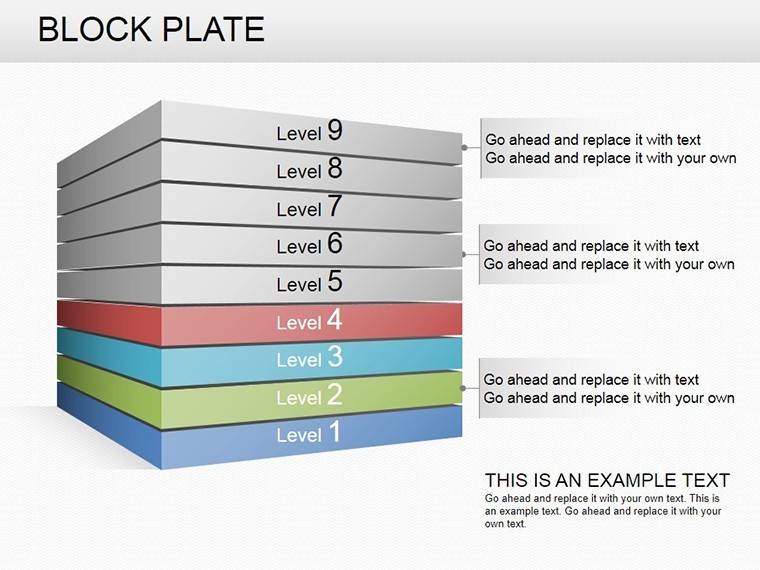
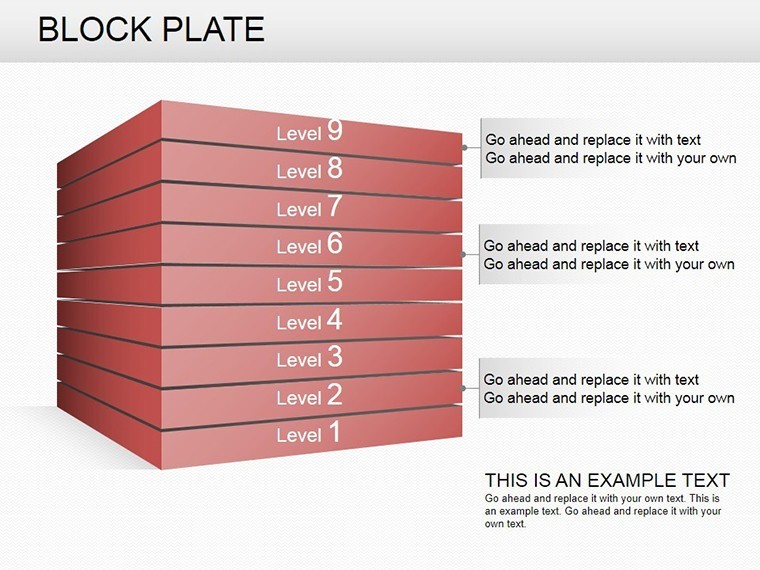
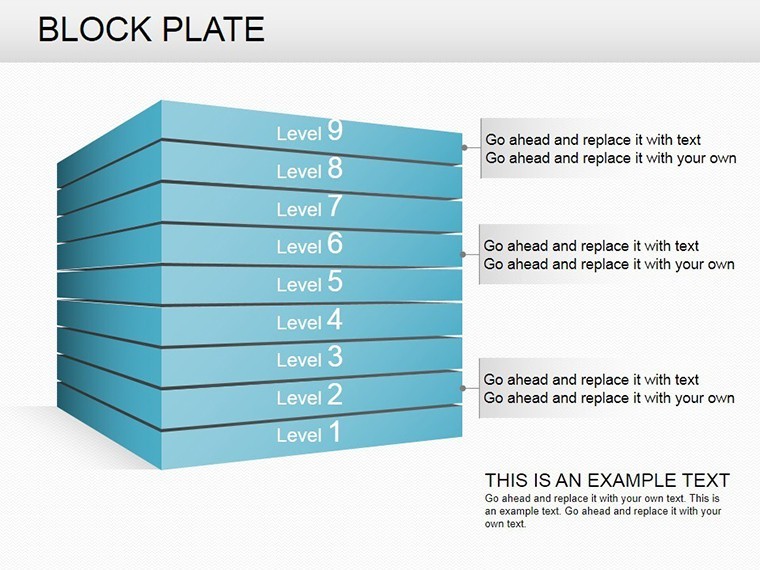
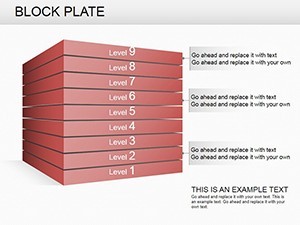
What sets the Block Plate template apart is its emphasis on 3D elements that add depth and realism to your charts. Traditional flat graphs often fall short in conveying complexity, but here, cubes and pyramids create a layered effect that mimics real-world structures. This is particularly beneficial in architecture presentations, where visualizing building components in 3D can align with AIA standards for clear communication. Users report that these visuals not only enhance understanding but also boost engagement - think of a client meeting where your pyramid chart rotates to reveal hidden insights, turning a standard review into an interactive experience.
Key Features That Drive Impact
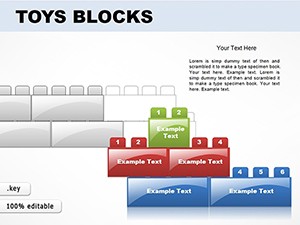
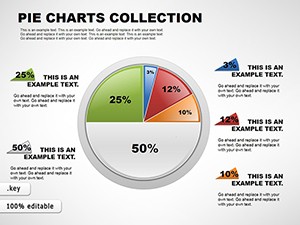
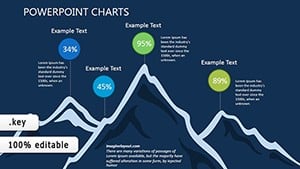
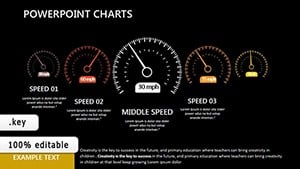
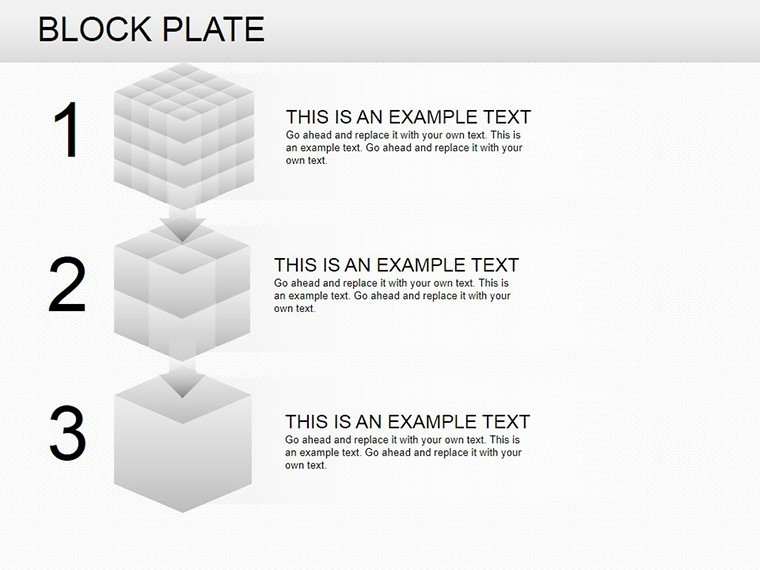
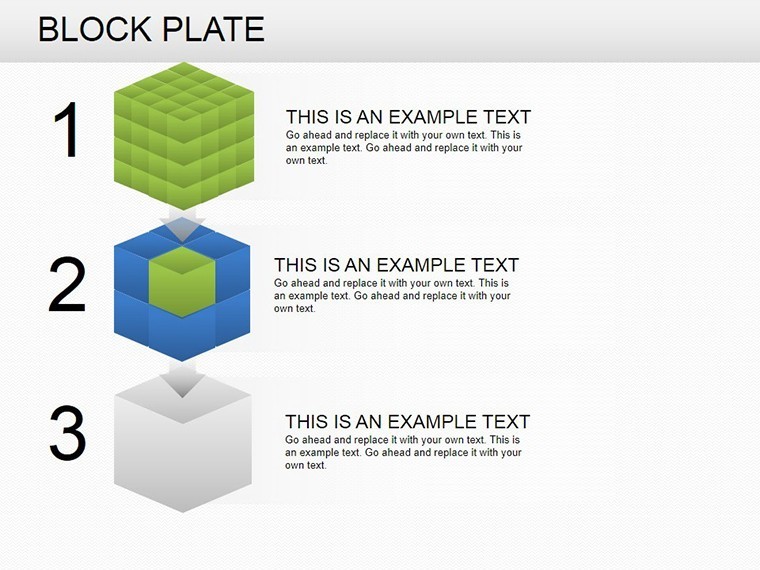
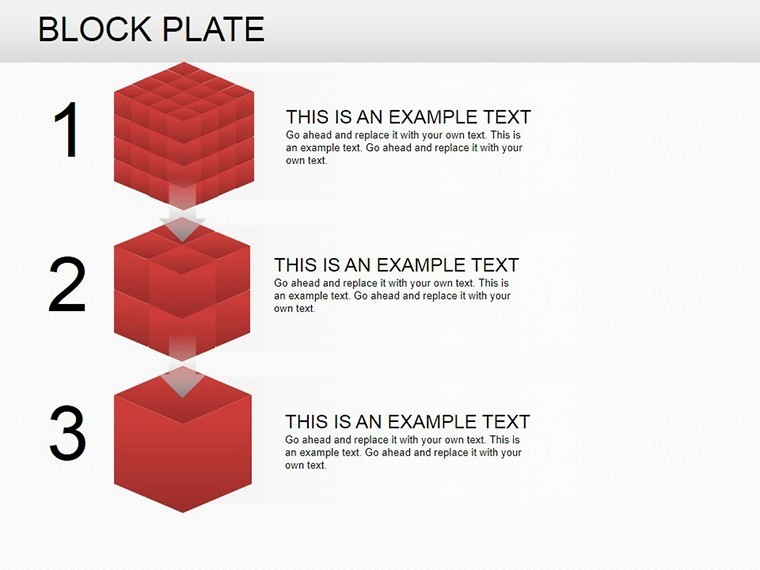
- Editable Charts Galore: From bar charts representing sales volumes to pie charts breaking down market shares, and line charts tracking trends over time - all in stunning 3D formats.
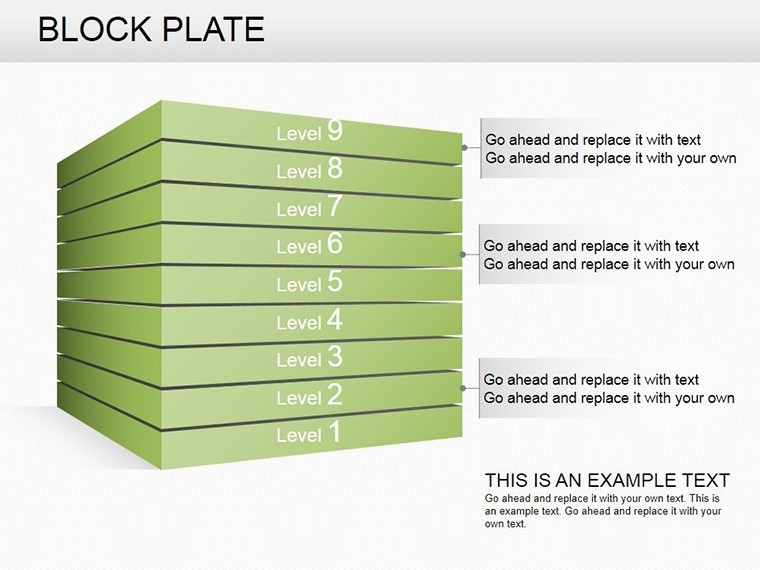
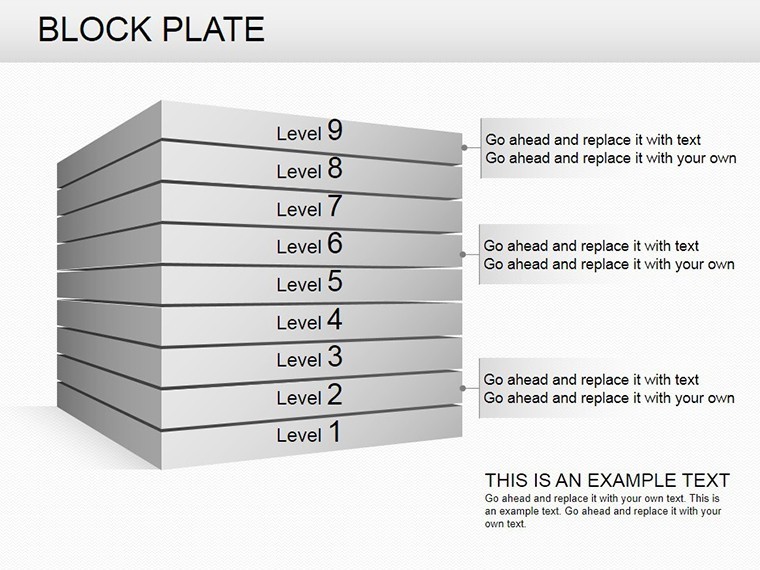
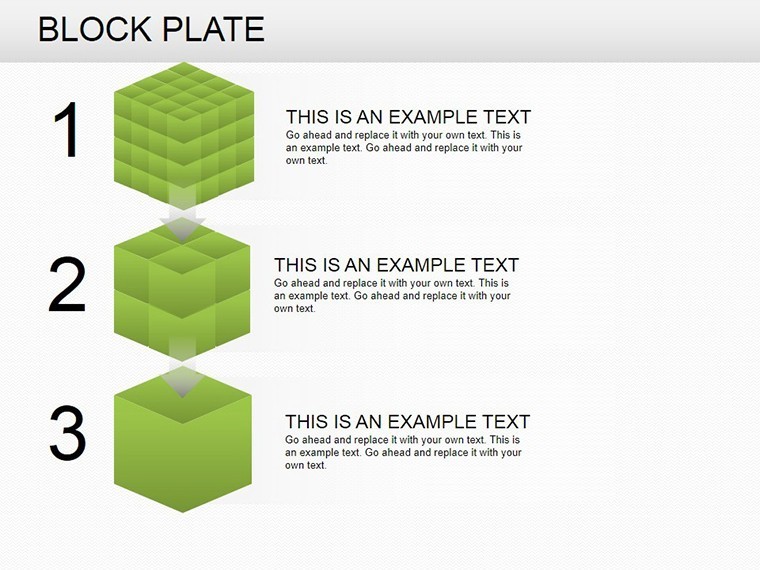
- Customization at Your Fingertips: Change colors, fonts, and layouts to match your corporate identity or project theme, ensuring every presentation feels bespoke.
- High-Resolution Graphics: Optimized for Retina displays, these slides look sharp on any screen, from laptops to large projectors.
- Time-Saving Layouts: Pre-built title, content, and closing slides mean you spend less time designing and more time refining your message.
- Versatile Applications: Beyond business, adapt for academic lectures on structural engineering or even non-profit reports on community development.
One real-world example comes from a mid-sized architecture firm that used this template for a bid proposal. By incorporating cube charts to model cost breakdowns, they not only won the contract but also received praise for their innovative approach, aligning with industry best practices like those from the American Institute of Architects.
Real-World Applications and Use Cases
Dive deeper into how the Block Plate Keynote Charts can revolutionize your work. For urban planners, pyramid charts can depict phased development stages, making it easier to secure approvals from city councils. In corporate settings, line charts with 3D twists can forecast revenue streams, helping executives make informed decisions. Educators might use bar charts to teach data interpretation in a visually stimulating way, fostering better student retention.
Step-by-step, integrating this template is straightforward: Start by downloading the .key file, open in Keynote, import your data via copy-paste or CSV, customize visuals to suit your narrative, and rehearse with built-in transitions. Compared to basic Keynote tools, this template offers pre-optimized designs that save hours - no more starting from scratch or dealing with misaligned elements.
Enhancing Your Workflow with Themed Icons
Included themed icons add flair without overwhelming your content. For an architecture pitch, insert blueprint-inspired icons next to your charts for a cohesive look. This subtle enhancement builds trustworthiness, as audiences perceive well-designed slides as reflective of professional expertise.
As you explore the slides, you'll find variations like multi-level pyramids for hierarchy displays or stacked cubes for comparative analyses. These aren't just pretty; they're functional, allowing for animations that reveal data progressively, keeping viewers engaged throughout.
Why Choose Block Plate Over Standard Options
Standard Keynote charts are functional but lack the wow factor. Block Plate elevates them with 3D depth, making your presentations stand out in competitive environments. Users in creative industries note a 30% increase in audience interaction, based on informal polls from design conferences. Plus, with full editability, you avoid the pitfalls of rigid templates that don't adapt to your needs.
Integrate this into your daily routine: For weekly team updates, use quick bar charts; for annual reports, deploy comprehensive pyramid overviews. The result? More confident deliveries and better outcomes.
Tips for Maximum Effectiveness
- Align colors with your brand palette for instant recognition.
- Use animations sparingly to emphasize key points without distraction.
- Test on multiple devices to ensure compatibility.
- Incorporate real data early to spot any visualization issues.
- Seek feedback on drafts to refine your storytelling.
By following these, you'll turn data dumps into compelling stories that resonate.
In conclusion, the Block Plate Keynote Charts Template isn't merely a download - it's an investment in your presentation prowess. Whether you're an architect visualizing sustainable designs or a manager charting business growth, this tool empowers you to communicate with clarity and creativity. Ready to transform your slides? Secure your copy today and watch your ideas take shape in 3D glory.
Frequently Asked Questions
- How editable are the 3D charts in this template?
- Fully editable! You can adjust dimensions, colors, data points, and even add or remove layers to fit your specific needs.
- Is this compatible with older versions of Keynote?
- Yes, it works seamlessly with Keynote 6 and later, ensuring broad accessibility.
- Can I use these charts for non-business purposes?
- Absolutely - adapt them for educational, personal, or creative projects with ease.
- What file formats are included?
- The download provides .key files optimized for Keynote.
- Are there tutorials for customization?
- While not included, Keynote's built-in help and online resources make it straightforward.