Business Process Flow Keynote Charts Template


In the bustling world of business operations, clarity is king. The Business Process Flow Keynote Charts template brings that clarity to life with 16 meticulously crafted, editable slides tailored for Keynote. If you're tired of convoluted flowcharts that confuse more than they clarify, this is your go-to solution. Aimed at managers, consultants, and team leads, it transforms opaque processes into crystal-clear visuals, helping you identify inefficiencies, communicate strategies, and drive decisions with confidence.
Picture this: You're preparing a deck for executive review on supply chain optimizations. Instead of dense text walls, you unveil a flowing diagram where each step - from procurement to delivery - links seamlessly, highlighting potential chokepoints with color-coded alerts. This template's strength lies in its intuitive design, leveraging Keynote's vector tools for smooth, scalable graphics that adapt to any screen size. Whether mapping customer onboarding or product launches, these charts make complex workflows feel straightforward, saving you time and impressing your audience.
Mastering Workflow Visualization with Precision
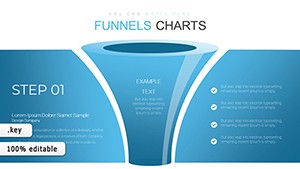
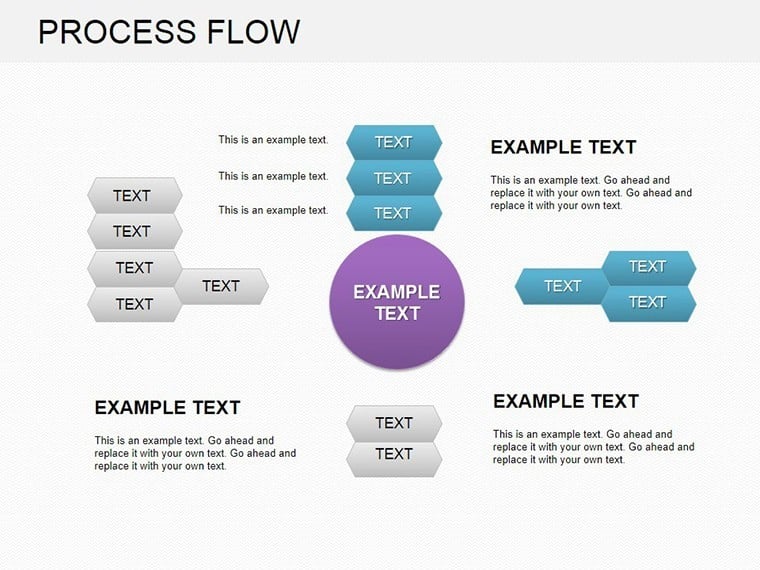
Effective process mapping isn't just about drawing arrows; it's about storytelling. This template excels by incorporating modern design elements like curved flows and icon integrations, turning mundane diagrams into compelling narratives. For instance, in a sales pipeline presentation, slides can depict lead generation funneling into conversion stages, with metrics overlaid for real-time impact. Business leaders using similar visuals report faster buy-in, as stakeholders quickly spot optimization opportunities - like automating redundant approvals.
Drawing from lean management principles, the charts emphasize efficiency, allowing you to simulate 'what-if' scenarios by duplicating and tweaking flows. This interactivity, powered by Keynote's build features, lets you reveal processes layer by layer, building suspense and understanding progressively.
Standout Features for Seamless Integration
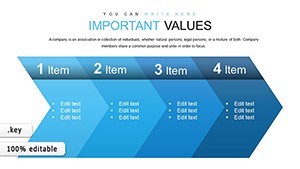
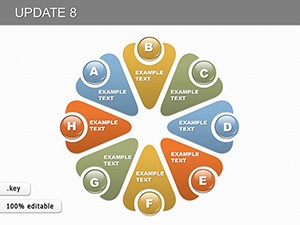
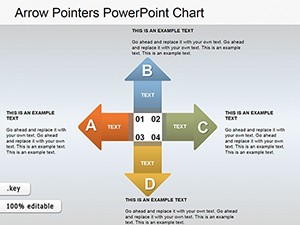
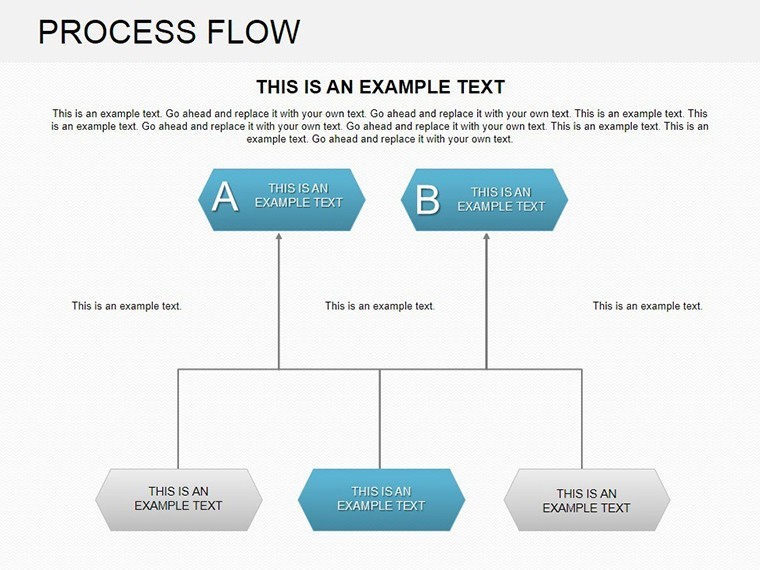
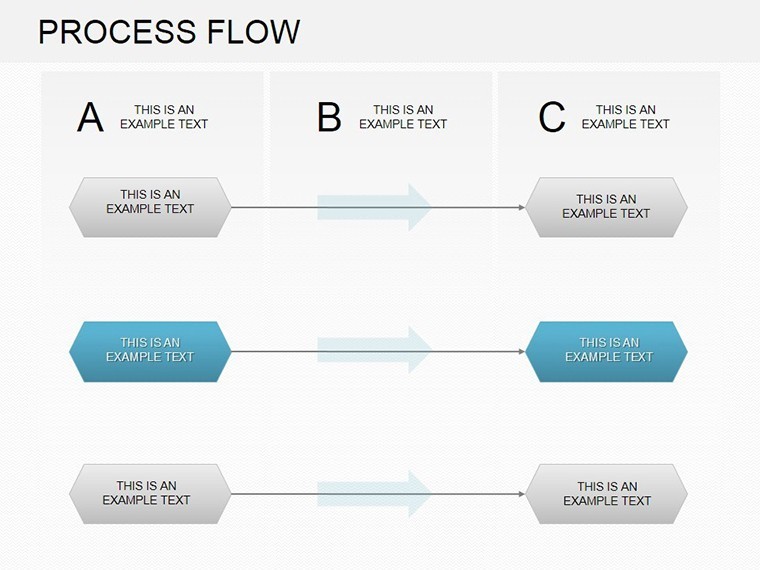
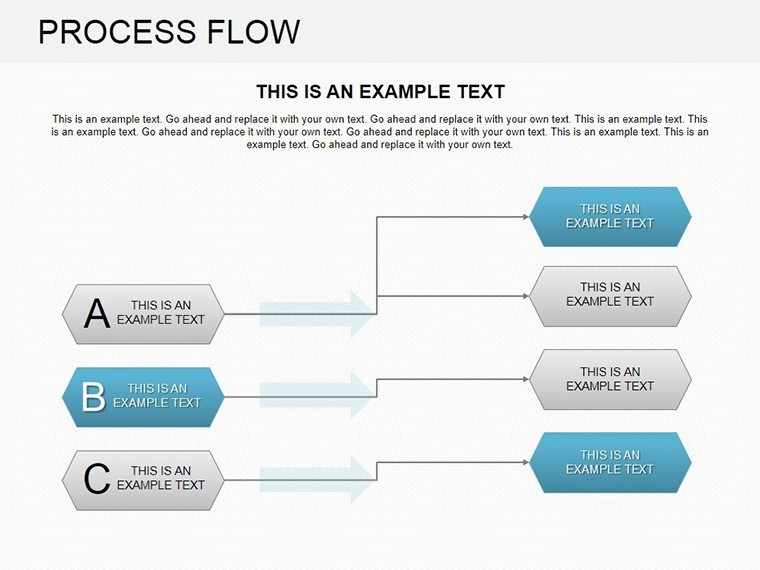
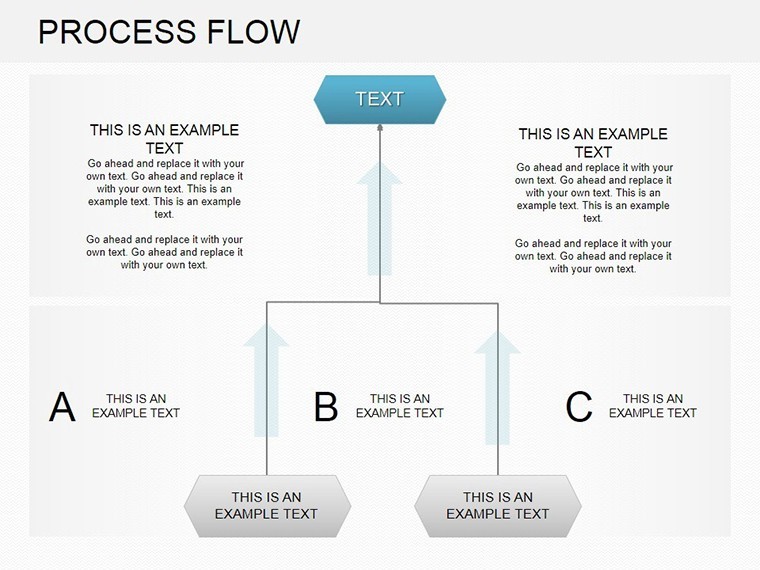
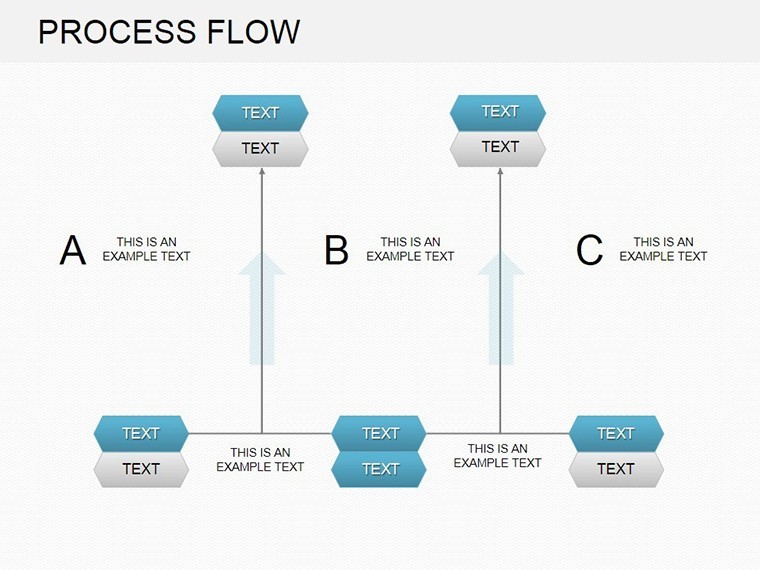
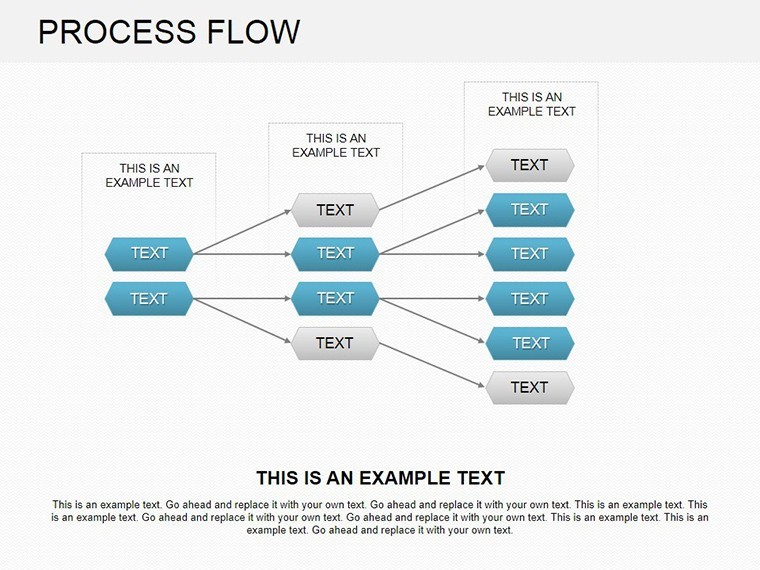
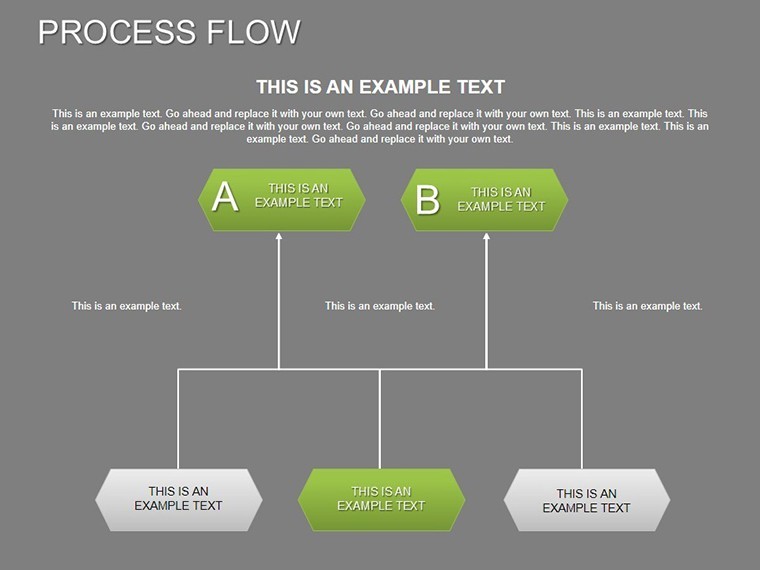
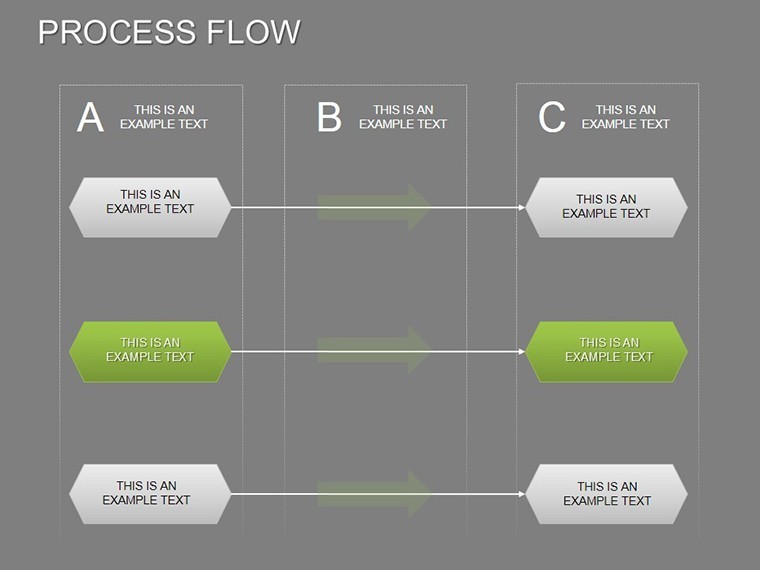
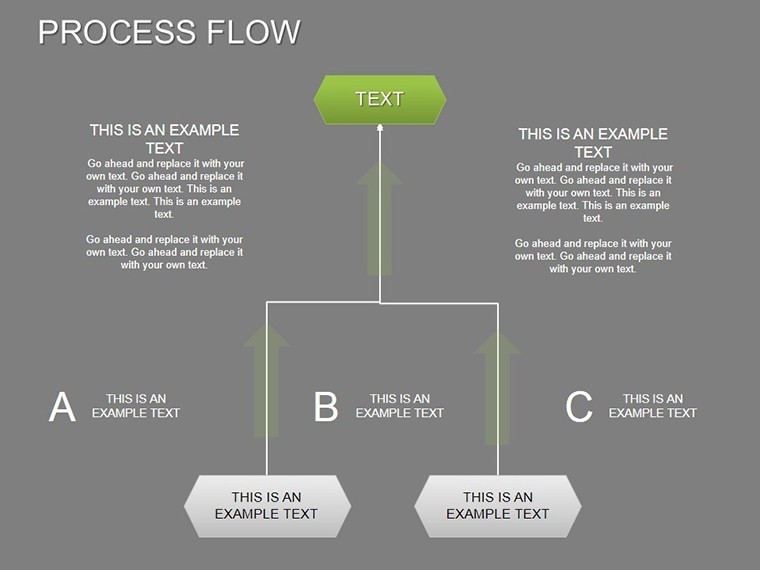
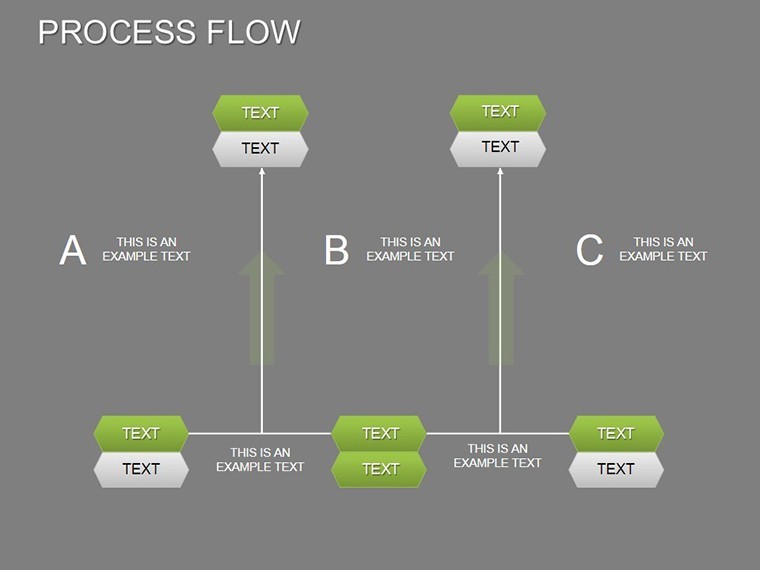
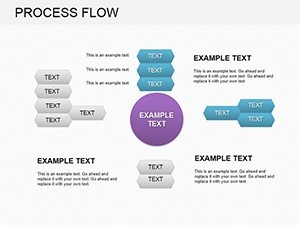
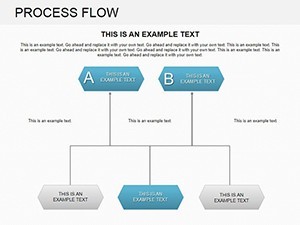
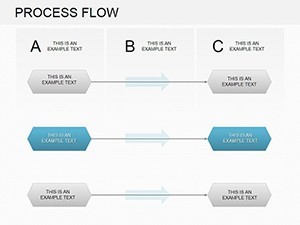
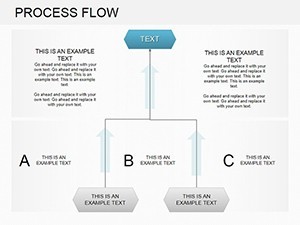
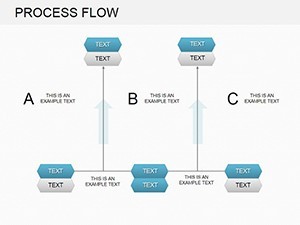
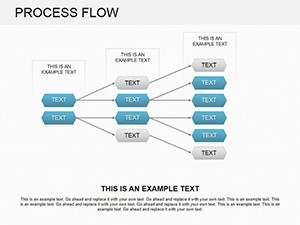
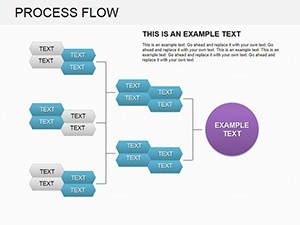
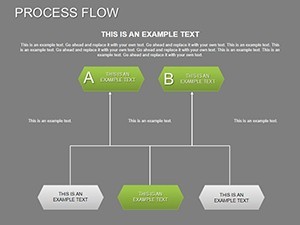
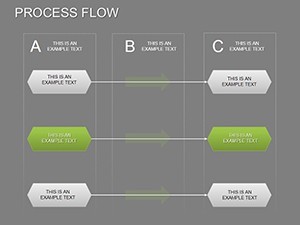
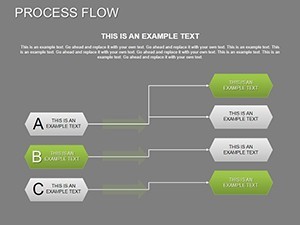
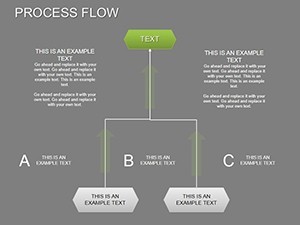
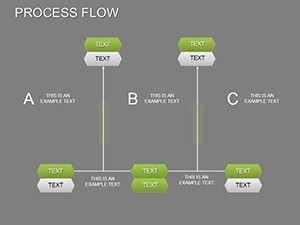
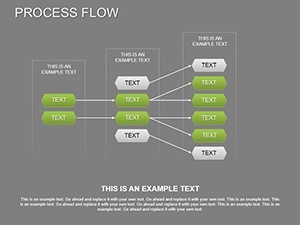
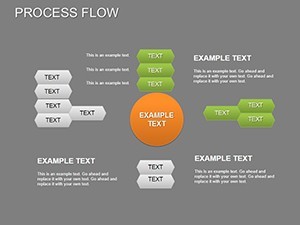
- 16 Customizable Slides: Diverse layouts including linear flows, decision trees, and circular processes for comprehensive coverage.
- Brand-Aligned Customization: Adjust hues, icons, and fonts effortlessly to reflect your company's visual identity.
- Animation-Ready: Pre-set transitions that guide the eye along the flow, enhancing presentation dynamics.
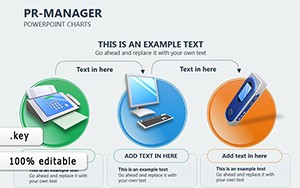
- Icon Library Included: Over 50 process-specific icons, from gears for operations to checklists for compliance.
- Export Flexibility: Generate PDFs, images, or animated GIFs for reports beyond Keynote.
The ease of use is a game-changer. No design degree required - simply drag-and-drop elements, input your steps via text boxes, and watch Keynote auto-align for perfection. It's optimized for collaboration too, with iCloud syncing for team feedback loops.
Practical Use Cases Across Industries
Let's explore how this template shines in action. In manufacturing, a operations director might use it to overhaul assembly lines. One slide breaks down the sequence: raw materials intake, machining, quality checks, packaging. By animating bottlenecks - like delayed inspections - teams collaborate on solutions, potentially cutting production time by 15-20%, as seen in case studies from industry leaders.
Service sectors benefit equally. HR professionals can map recruitment flows, from job postings to onboarding, ensuring compliance with standards like ISO 9001. For tech startups, it's ideal for agile sprints: Visualize user story backlogs flowing into development and testing phases, aligning devs and product owners effortlessly.
Even in healthcare administration, these charts clarify patient journey maps, from intake to discharge, helping reduce wait times and improve satisfaction scores. The template's adaptability makes it indispensable for any process-driven environment.
Your Step-by-Step Customization Roadmap
- Launch the Template: Open the .key file in Keynote and browse the 16 slides to select your starting point.
- Define Your Process: Outline steps in a sidebar note, then populate the first slide with shapes representing each phase.
- Connect the Dots: Use Keynote's line tools to link elements, adding arrows for directionality and labels for details.
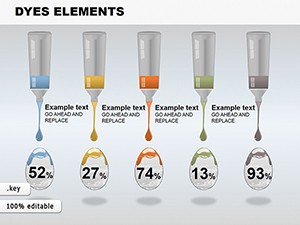
- Enhance with Data: Integrate charts or metrics beside flows, using smart shapes for dynamic updates.
- Polish and Animate: Apply themes, test animations, and rehearse to ensure logical progression.
- Share and Iterate: Export for review, incorporate changes, and present with poise.
Bonus tip: Use Keynote's magic move for fluid transitions between related slides, creating a cinematic flow that captivates.
Elevating Beyond Standard Diagramming
Why settle for clunky Visio exports or basic shapes when this template offers native Keynote excellence? It surpasses free alternatives by providing pre-vetted layouts that comply with visual best practices, reducing cognitive load for viewers. Consultants often pair it with tools like Lucidchart for initial sketches, then refine in Keynote for polished delivery.
The value extends to ROI: Streamlined processes lead to tangible gains, like the 30% efficiency boost reported by firms adopting visual mapping. Your presentations become tools for change, not just information dumps.
Don't let tangled processes hinder progress - grab the Business Process Flow Keynote Charts template now and chart a clearer path forward. Transform your workflows today!
Frequently Asked Questions
How do these charts help identify bottlenecks?
By visually sequencing steps with color highlights and animations, they pinpoint delays, allowing quick analysis and fixes during presentations.
Is the template compatible with team collaboration?
Yes, via Keynote's iCloud features, multiple users can edit simultaneously for real-time refinements.
What industries is this best suited for?
It's versatile for manufacturing, services, tech, healthcare - anywhere processes need clear visualization.
Can I add my own icons?
Absolutely; import custom SVGs or use the built-in library, with easy scaling in Keynote.
How editable are the flow elements?
Fully - reshape, recolor, and reposition every component without losing alignment.
What's the slide count and variety?
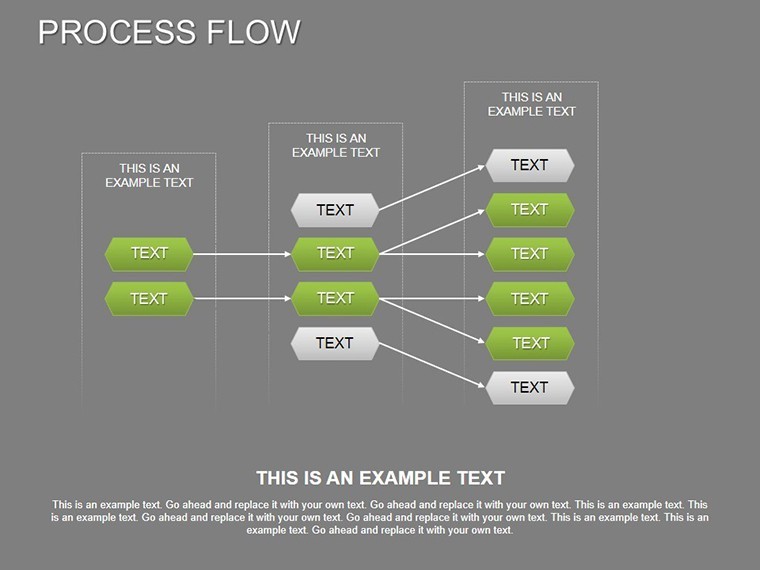
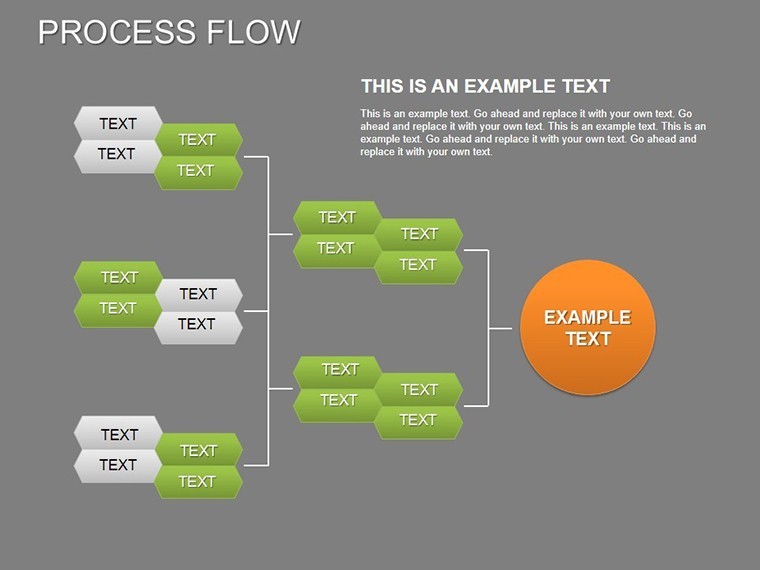
16 slides, ranging from simple linear to branched decision flows for diverse needs.