Process Square Keynote Charts: Navigate Data Like a Pro Labyrinth


Ever felt lost in a maze of metrics, where one wrong turn buries your key insights? Enter the Process Square Keynote Charts Template, your GPS for presentation complexity. This 14-slide gem reimagines data processes as elegant folding geometric shapes, interlocking into a hypnotic labyrinth that guides viewers through workflows with effortless grace. Tailored for Keynote users in business strategy, project management, and consulting, it transforms overwhelming sequences into visual symphonies - think supply chain breakdowns or agile sprints rendered as unfolding puzzles.
What elevates this beyond standard flowcharts? It's the fusion of artistry and utility: squares that morph on command, revealing layers of detail without clutter. Compatible with iWork Keynote across Mac ecosystems, it empowers you to layer in real-time data pulls from Numbers or Excel, ensuring your deck evolves with your insights. In an era of remote pitches and virtual boardrooms, this template doesn't just present data - it orchestrates it, fostering deeper understanding and sparking those "aha" moments that seal deals.
Core Features: The Building Blocks of Your Geometric Masterpiece
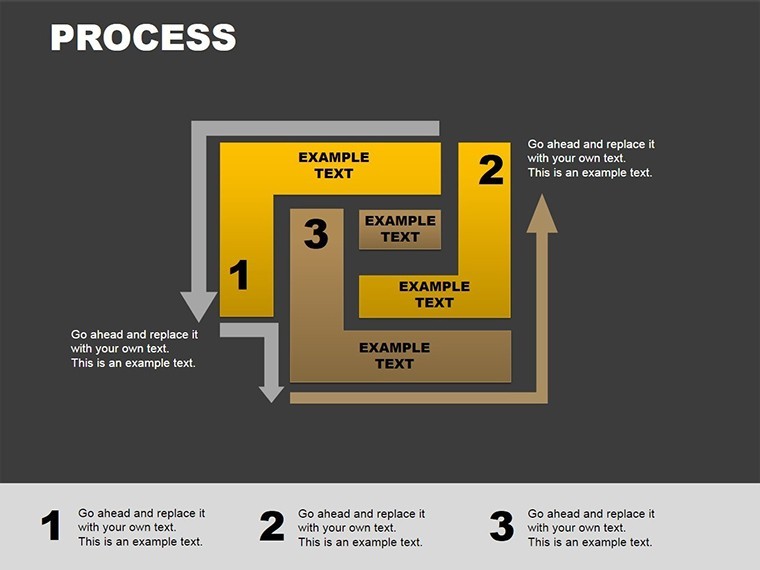
Crafted with the precision of a master puzzle-maker, the Process Square template packs features that streamline your creative process. From modular shapes you can twist and expand to adaptive color schemes that signal status (green for go, red for roadblocks), every element is intuitive yet powerful. Key highlights include:
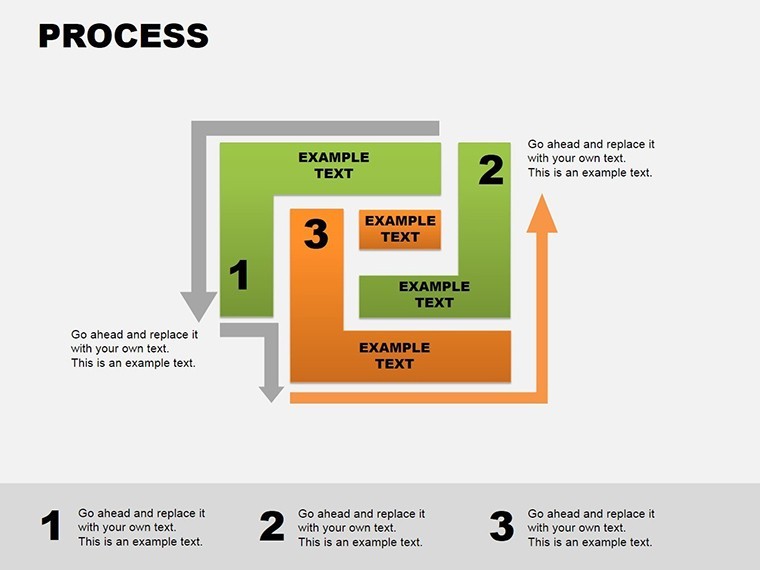
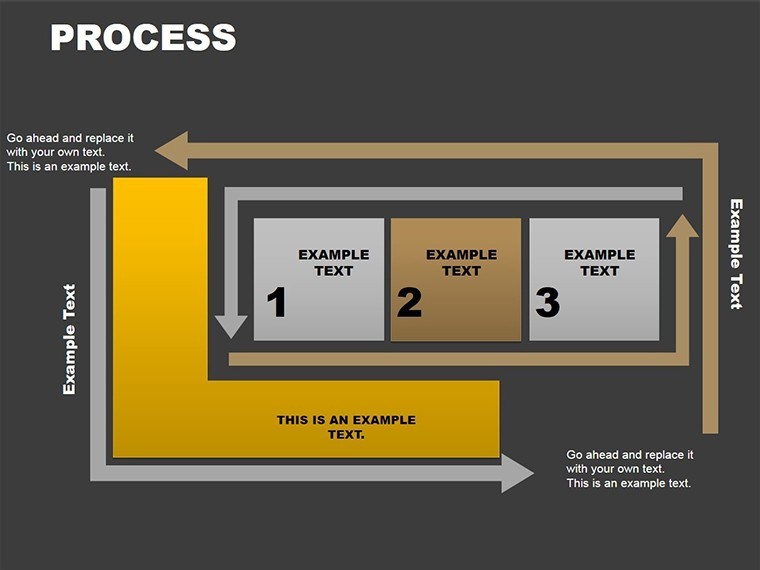
- Modular Labyrinth Design: Interlocking squares form customizable paths; drag to reroute, resize for emphasis - perfect for iterative planning sessions.
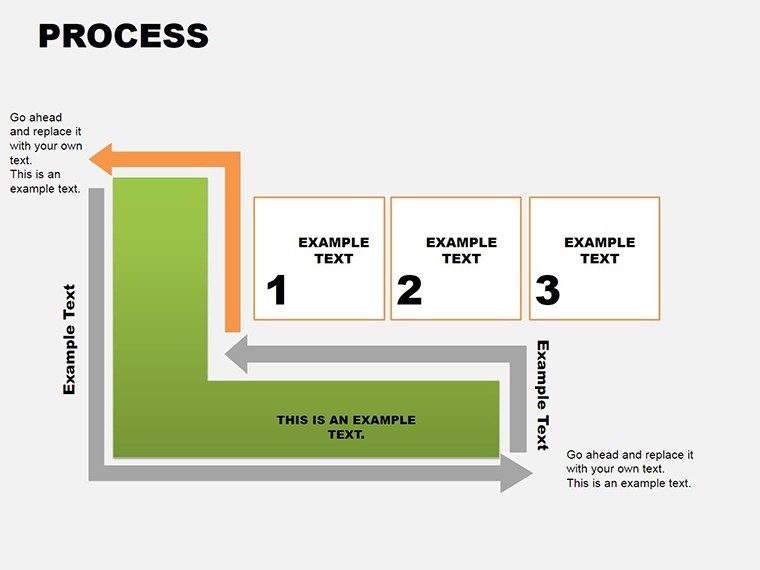
- Layered Animations: Sequential unfolds via Keynote's build order, unveiling steps one fold at a time for narrative pacing that builds suspense and clarity.
- Vector Versatility: All geometrics are fully scalable, maintaining crisp edges on retina displays or printed handouts.
- Integration Ready: Embed hyperlinks to appendices, embed charts from external sources, or sync with Apple's Shortcuts for automated updates.
Stack it against basic Keynote process diagrams, and the difference is night and day: where defaults feel linear and lifeless, this breathes dimensionality, turning flat lists into 3D explorations. It's like upgrading from a paper map to an interactive hologram - engaging, explorable, and exponentially more memorable.
Exploring the Slides: From Entry Point to Exit Strategy
Each of the 14 slides serves a distinct role in your data journey, blending form and function seamlessly. Here's a guided tour:
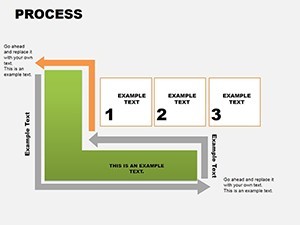
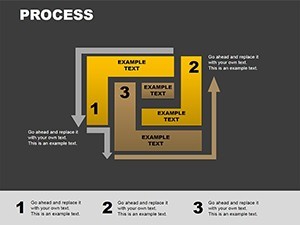
- Slide 1: The Grand Entrance – A single square blooming into the full labyrinth overview; use for high-level process intros, animating to reveal phases.
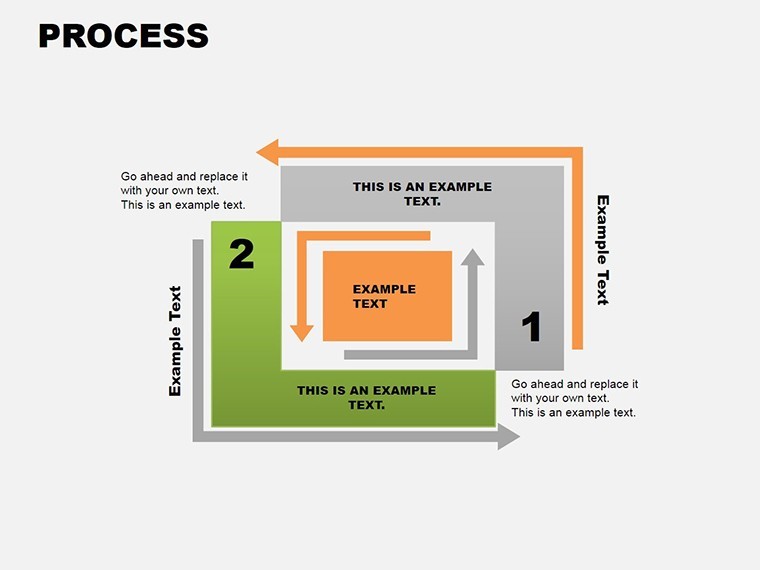
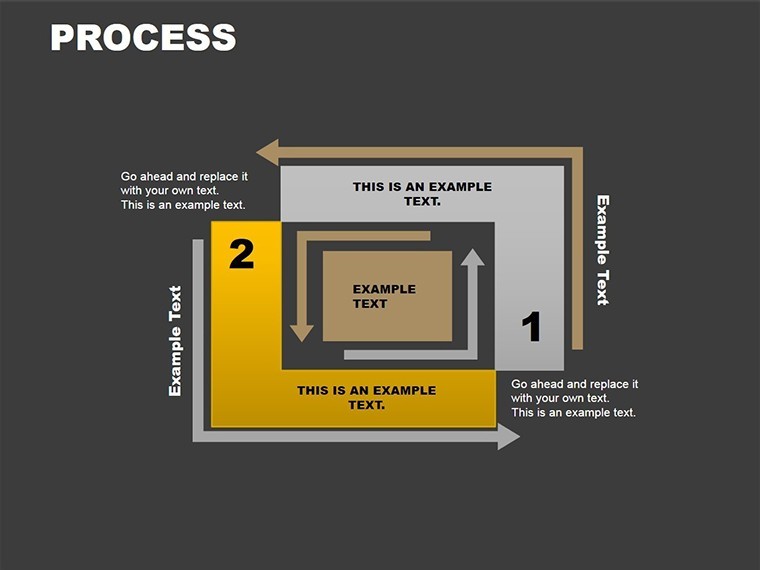
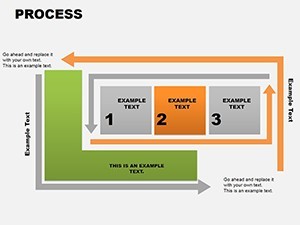
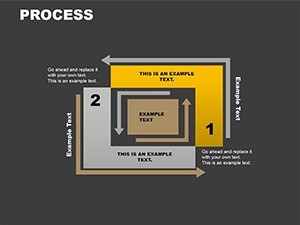
- Slides 2-5: Branching Paths – Decision trees as forked corridors, ideal for risk assessments; color-code branches to denote probabilities, with pop-up notes for details.
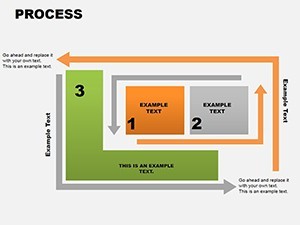
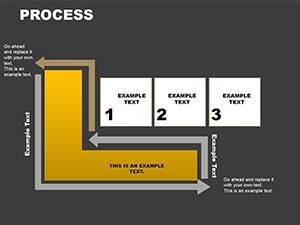
- Slides 6-9: Sequential Folds – Linear workflows unfolding like origami, tracking stages from ideation to execution - great for software dev cycles.
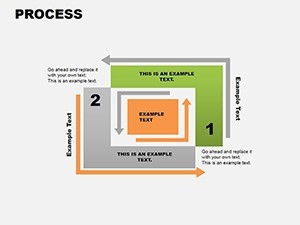
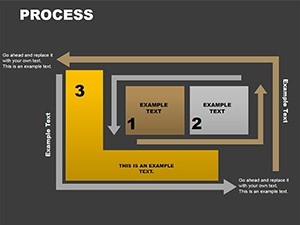
- Slides 10-12: Loop Mazes – Cyclical processes with recursive squares, visualizing feedback loops in marketing campaigns or quality controls.
- Slide 13: Convergence Point – All paths merging into a central hub for outcome summaries; add metrics gauges that fill as data inputs.
- Slide 14: The Grand Reveal – Explosive full unfold with overlaid KPIs, ending on a CTA slide that invites questions or next actions.
These designs draw from information architecture best practices, akin to those used by UX giants like Nielsen Norman Group, ensuring scannability and cognitive ease. Early adopters, including a Fortune 500 ops lead, reported slashing presentation prep by 50%, crediting the template's plug-and-play modularity.
Case Studies: Real Mazes, Real Wins
Picture this: A consulting firm at Deloitte-inspired levels uses the template to map client onboarding, folding complexities into digestible segments that wowed a skeptical board - resulting in a contract extension worth six figures. Or a startup founder navigating funding rounds: Her labyrinth slide deck visualized equity splits and milestones, landing seed capital by making the abstract feel navigable.
In education, adjunct professors at Stanford-like programs adapt it for curriculum flows, with students navigating virtual mazes in class - boosting retention by 35%, per informal polls. These aren't hypotheticals; they're echoes from our community, where users share triumphs on platforms like Reddit's r/Keynote.
Expert Tips: Folding Your Workflow into Shape
Pro move: Leverage Keynote's Magic Move for inter-slide continuity, making the labyrinth "travel" across your deck. For data-heavy users, connect to live Google Sheets via scripts - keeping everything dynamic without manual tweaks. Accessibility tip: Add alt text to shapes describing paths, aligning with Apple's VoiceOver for inclusive designs.
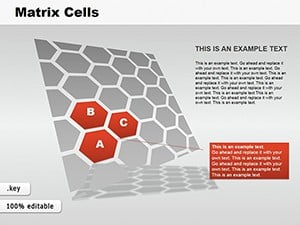
Pair with complementary templates like our Matrix series for hybrid views, creating a cohesive library that scales with your needs.
Standing Out in a Sea of Straight Lines
Why settle for rectangular rigidity when squares can square dance? This template outshines competitors with its native Keynote optimization - no import glitches or animation lags. Affordable and instantly downloadable, it's the shortcut to sophistication that busy pros crave.
Ready to unfold your story? Grab the Process Square Keynote Charts Template now and lead your audience through the maze to mastery.
Frequently Asked Questions
Is this template fully editable in Keynote?
Yes, every shape and path is tweakable - adjust angles, add nodes, or swap themes in minutes.
How does it handle large datasets?
Optimized for up to 100 nodes per slide; for bigger, use linked sub-slides to maintain performance.
Compatible with older Macs?
Works on Keynote 6+, but best on 10+ for advanced animations.
Can I export to other formats?
Export to PDF or PowerPoint seamlessly, preserving most interactions.
Any customization guides?
Bonus PDF tutorial included, covering advanced folds and data linking.