Agile Development Keynote Charts: Fuel Business and Team Growth


In an era where agile methodologies dominate, bridging the gap between personnel development and business expansion is crucial. Our Agile Development Keynote charts template, featuring 14 editable slides, rises to this challenge. Targeted at HR professionals, project managers, and business leaders, it transforms discussions on training and growth into visual journeys using process, pie, and arrow charts. Move beyond simplistic education to holistic development, as highlighted in frameworks from the Agile Alliance.
Consider a tech firm adopting these charts to map skill progression, inspired by Google's Project Oxygen studies on effective management. This template not only illustrates but empowers, turning abstract concepts into actionable plans that compete with business school resources.
Core Features Enhancing Agile Visuals
Built for impact, the template combines functionality with flair, offering tools that adapt to your narrative.
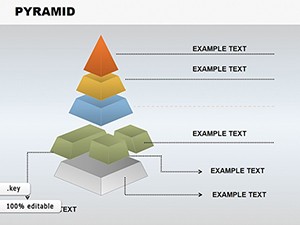
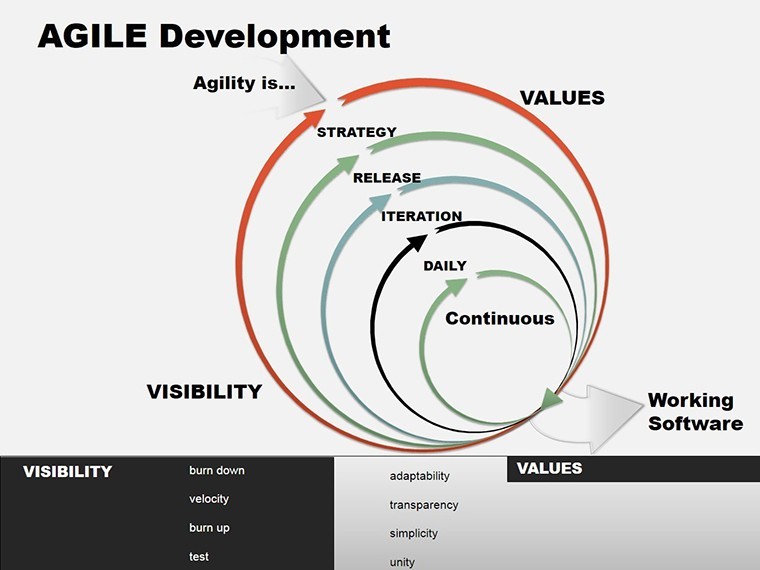
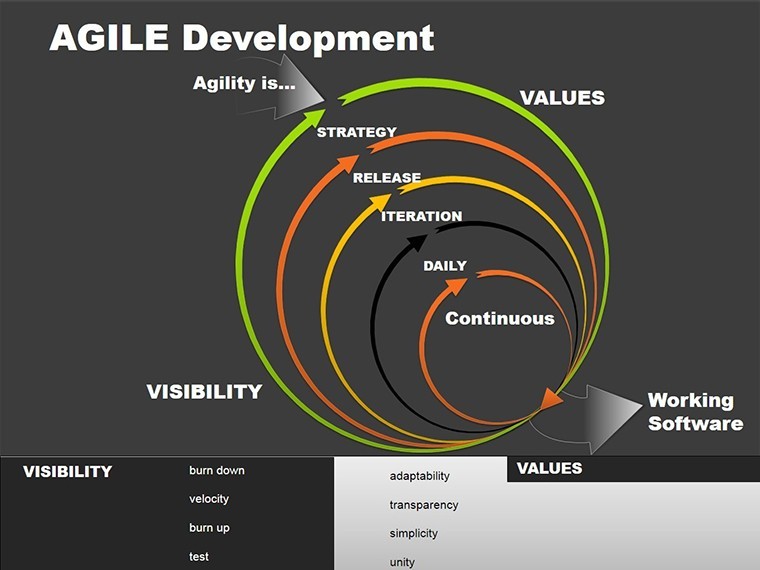
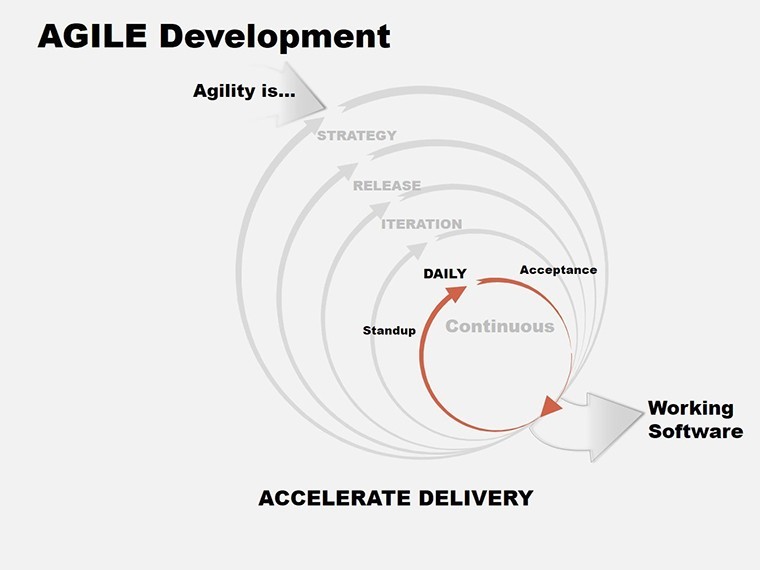
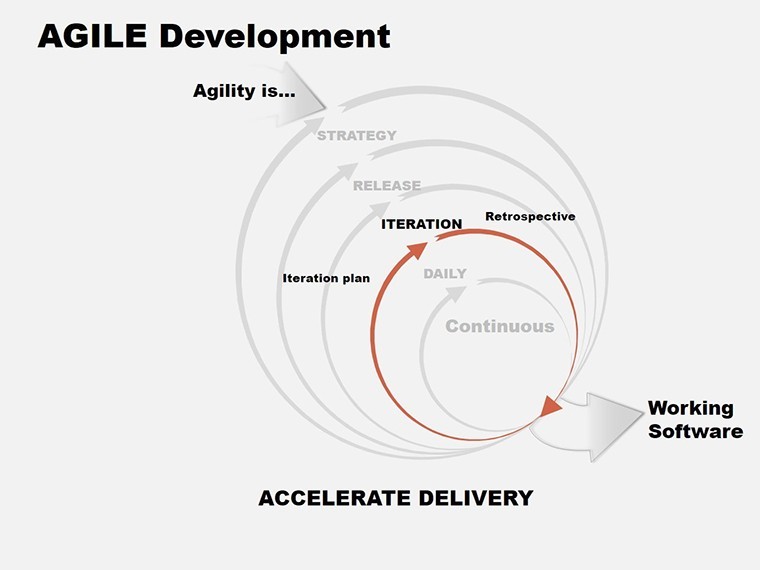
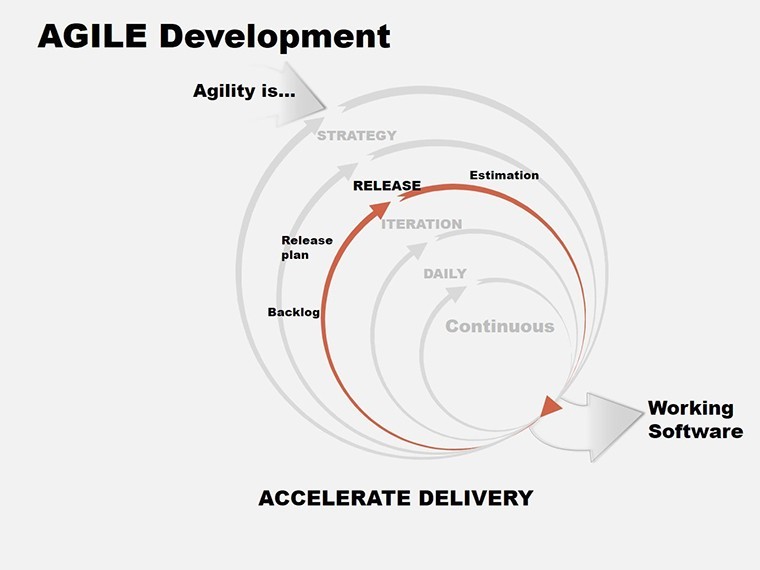
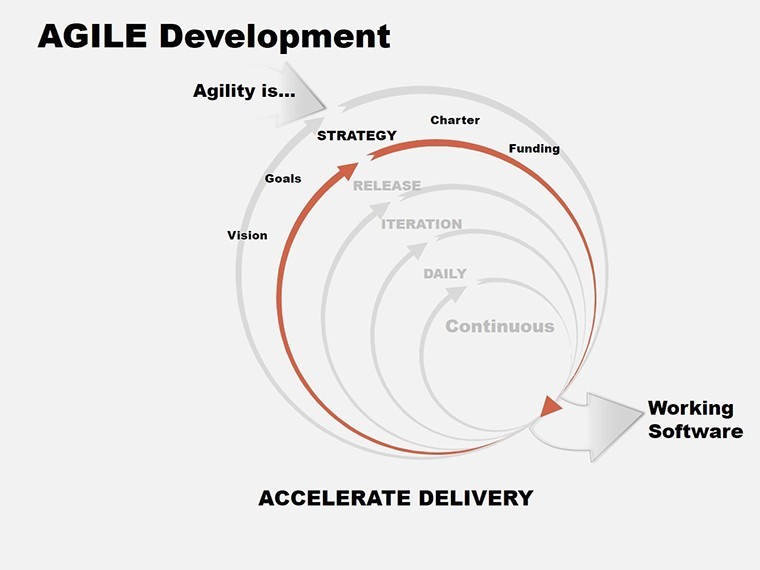
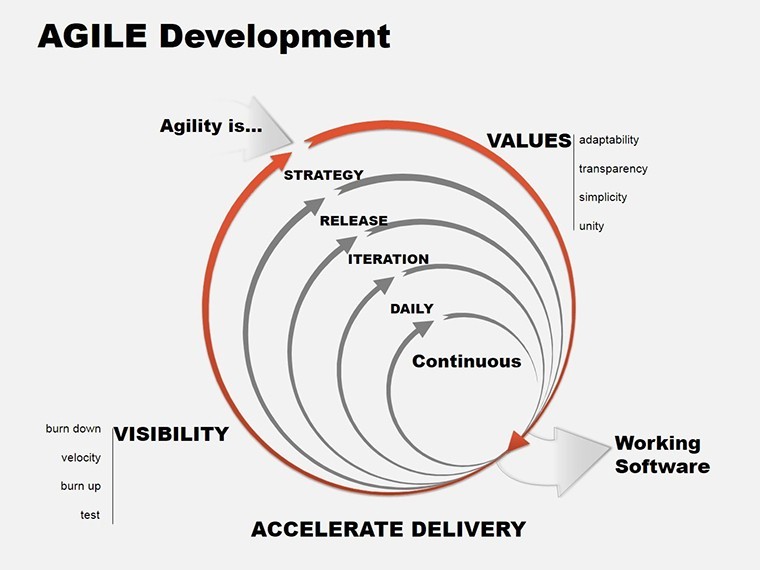
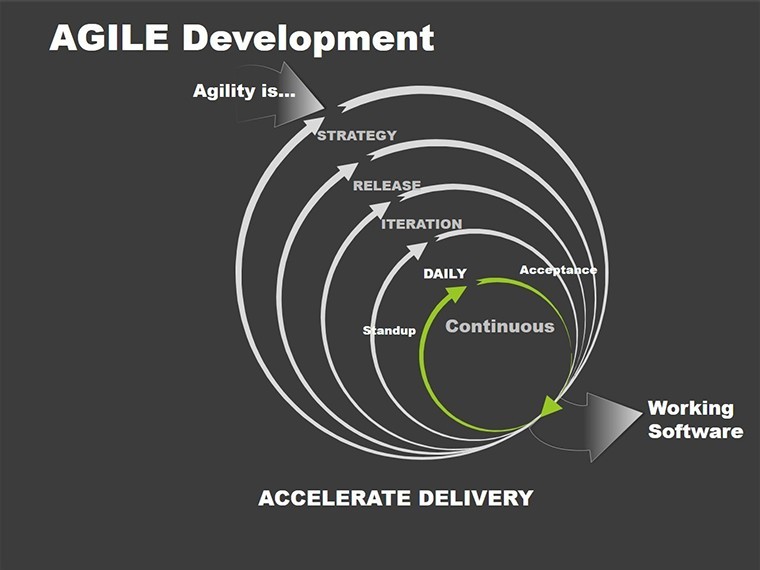
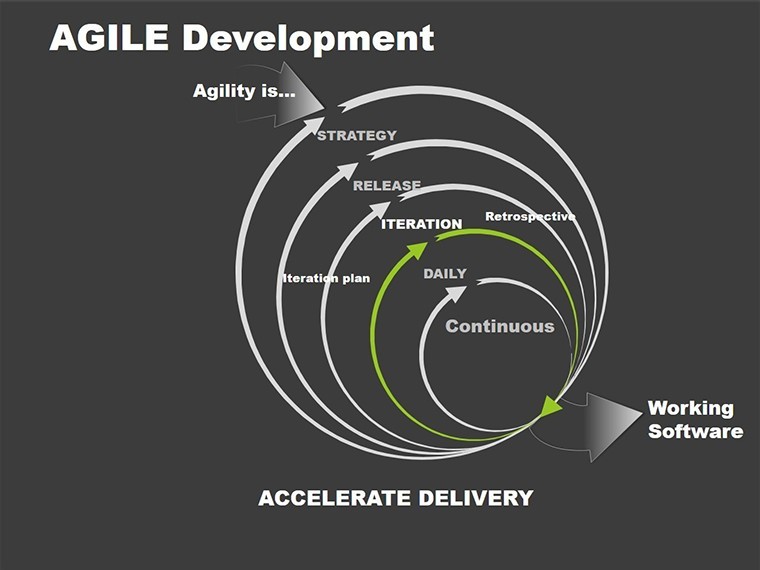
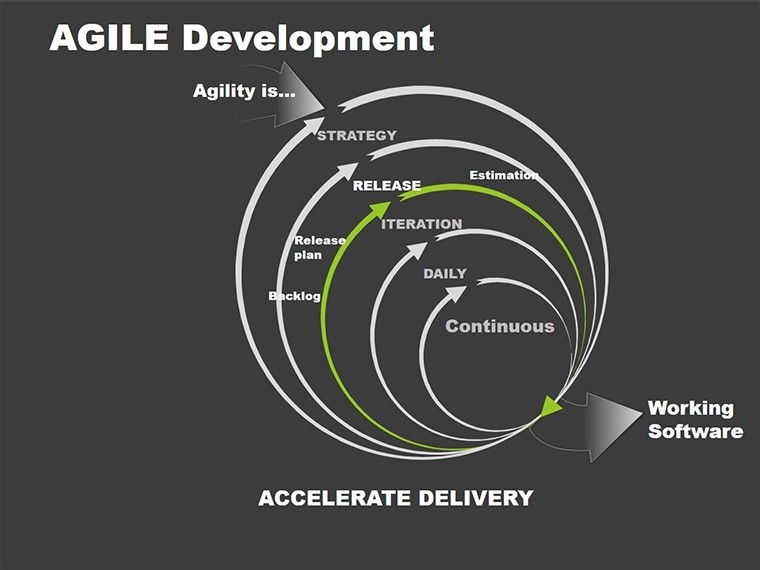
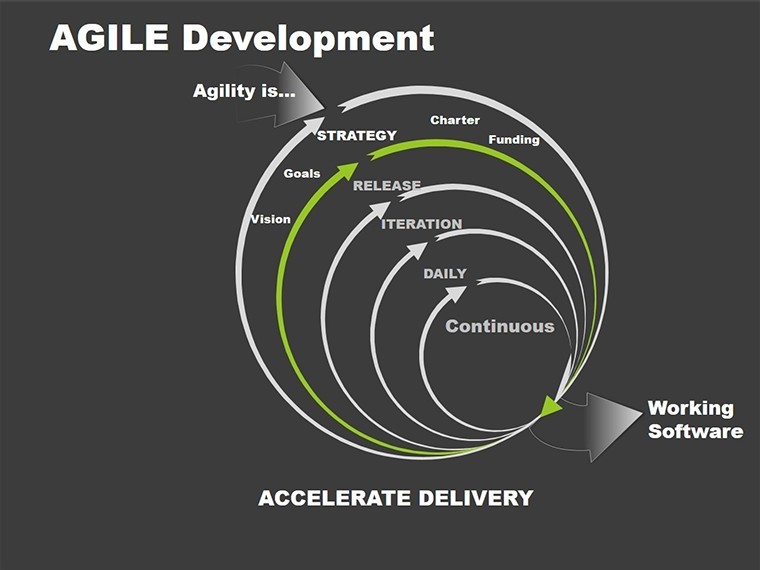
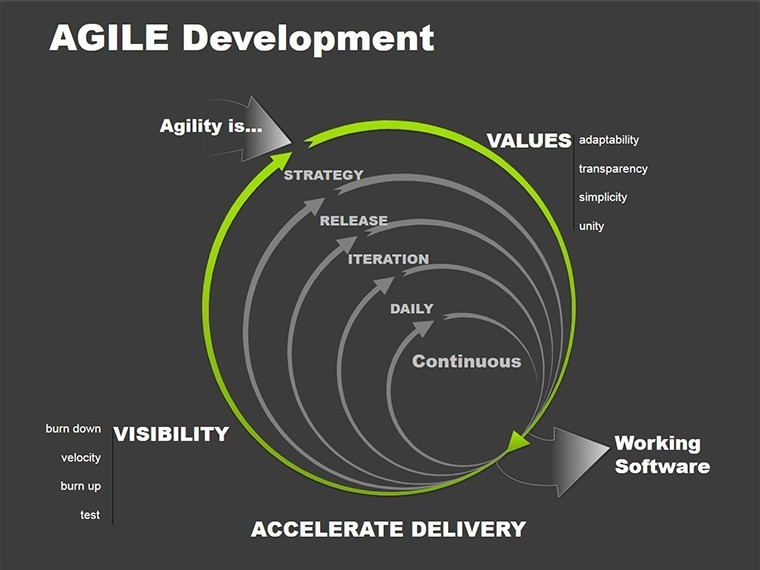
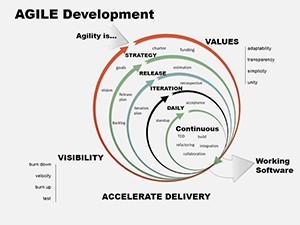
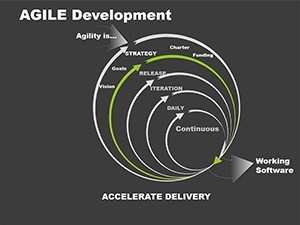
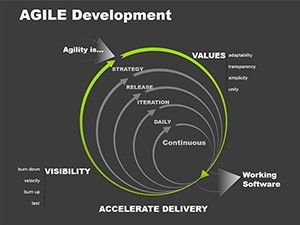
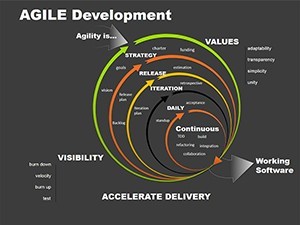
- Process Flow Charts: Detail iterative development stages, customizable for sprints or training modules.
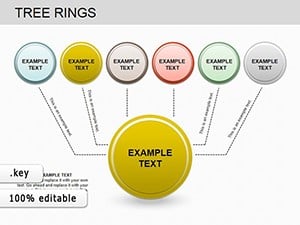
- Pie Chart Breakdowns: Segment resources or outcomes, like budget allocation for personnel growth.
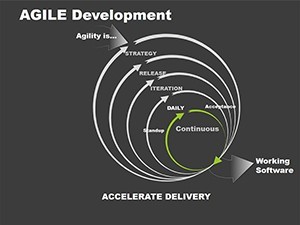
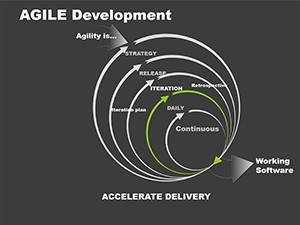
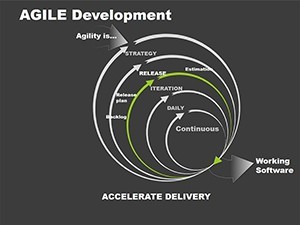
- Arrow Directives: Guide viewers through sequences, emphasizing progression in agile cycles.
- Broad Compatibility: Keynote-optimized, with easy adaptation to PowerPoint or Google Slides.
These surpass standard options by providing thematic coherence, addressing the resource constraints many companies face.
Applications in Real-World Scenarios
For corporate training, use pie charts to allocate development budgets, mirroring Deloitte's human capital trends reports. Startups can visualize agile roadmaps, fostering innovation as per Lean Startup principles by Eric Ries. In education, mentors depict career paths, making complex topics accessible.
Businesses scaling operations benefit from arrow charts showing personnel evolution, leading to measurable improvements like 20% productivity gains in agile teams, as noted in McKinsey insights.
Guide to Personalization and Use
Adaptation is intuitive, allowing rapid iterations aligned with agile ethos.
- Load data from tools like Jira or HR software.
- Modify shapes and colors for brand alignment.
- Incorporate transitions for dynamic reveals.
- Collaborate by sharing across platforms.
This streamlined workflow, drawing from Scrum guidelines, accelerates creation while maintaining quality.
Narratives That Inspire Agile Transformation
Weave stories of growth: A process chart could outline from onboarding to mastery, echoing narratives in "Drive" by Daniel Pink on motivation. For diverse teams, customize for cultural fit, enhancing inclusivity.
Backed by 657 ratings, it delivers reliability for high-stakes presentations.
The Strategic Edge of This Template
It elevates development discussions, offering more than charts - a catalyst for change. Overcome resource limitations and propel your organization forward.
Embrace agile excellence - grab this template and chart your path to innovation.
Frequently Asked Questions
How flexible are the process charts?
Fully editable, allowing additions or removals of steps to fit your agile framework.
Works with Microsoft tools?
Yes, converts seamlessly to PowerPoint for Windows-based teams.
Best for which agile aspects?
Personnel training, business scaling, and iterative processes across industries.
Includes data import options?
Supports easy integration from spreadsheets or project management apps.
Why focus on development over education?
It emphasizes practical growth, aligning with modern business needs beyond basic learning.
(986 words)