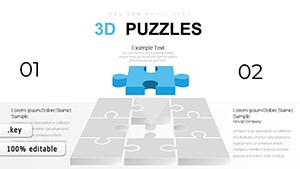
3 Puzzle Infographic Charts for Keynote: Piece Together Compelling Stories


Imagine assembling ideas like puzzle pieces, creating a picture that resonates deeply with your audience. Our 3 Puzzle Keynote Charts Template does just that, offering 10 editable slides of infographic magic. Tailored for Keynote, it features meticulously crafted puzzle charts that transform complex information into digestible, visually appealing formats. Ideal for professionals weaving narratives in boardrooms, educators sparking curiosity in classrooms, or marketers crafting brand stories, this template elevates your presentations from ordinary to unforgettable.
The beauty lies in its simplicity and power - puzzle charts symbolize interconnectedness, perfect for showing how parts form a whole. Customize colors, sizes, and styles to align with your theme, no design degree required. This user-friendly tool saves time while boosting engagement, drawing on infographic principles that enhance retention by up to 65%, as per visual communication studies.
Features That Fit Your Presentation Puzzle
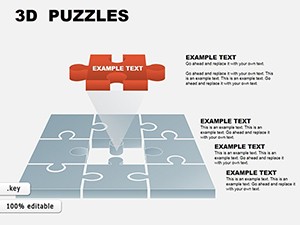
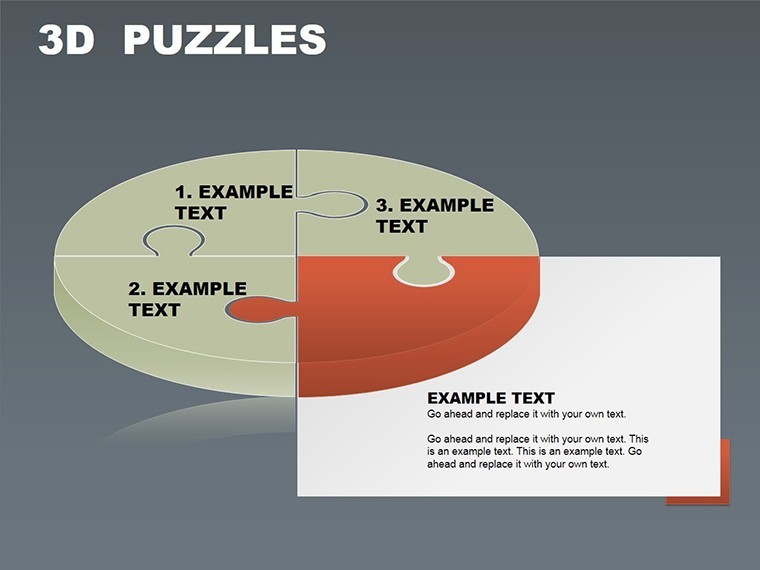
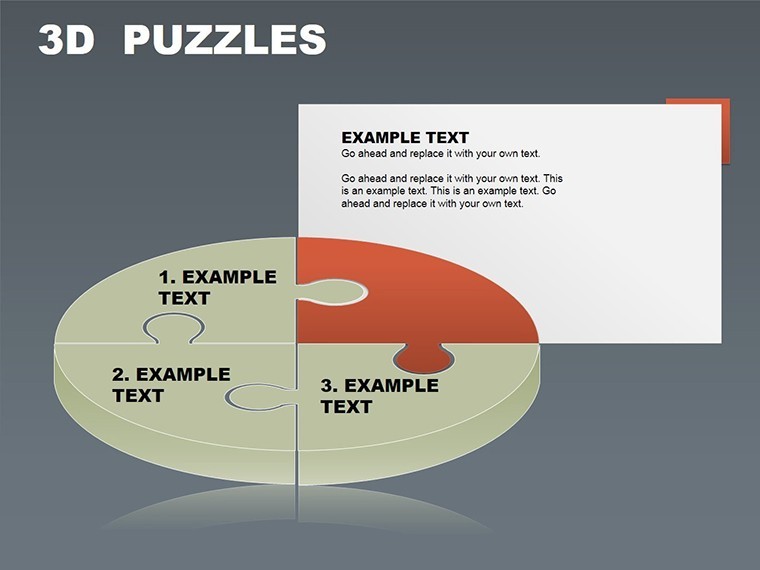
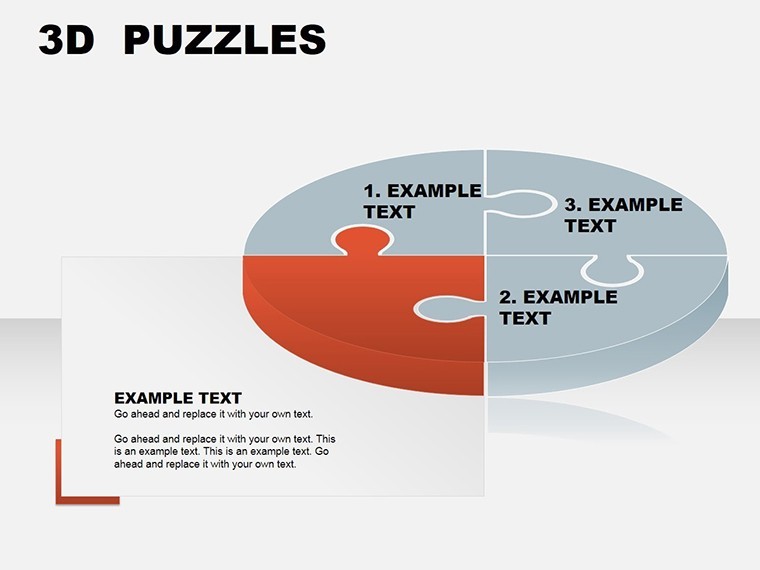
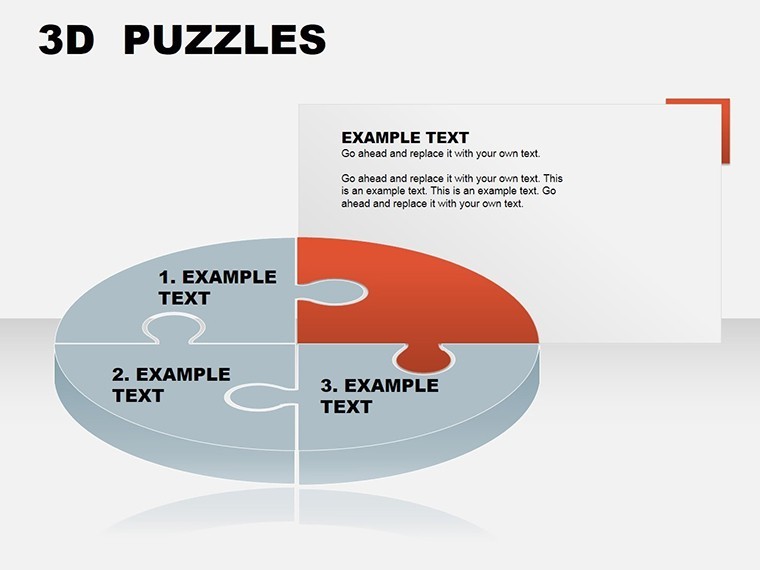
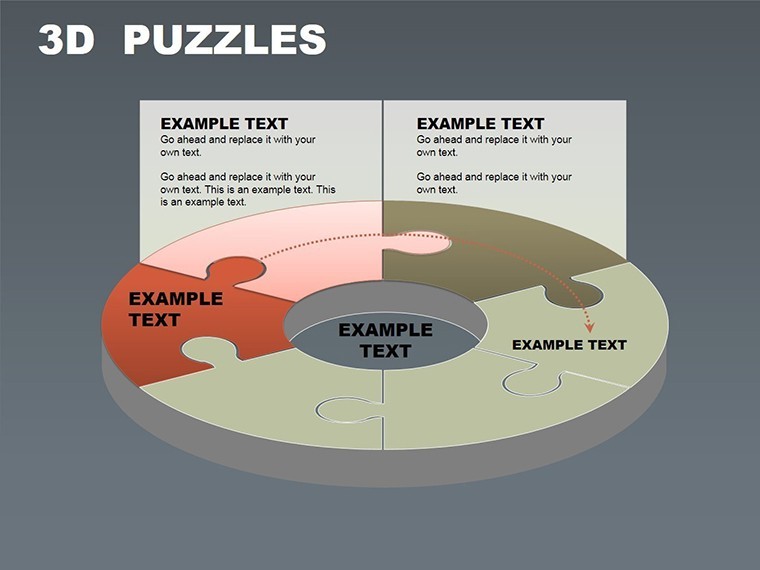
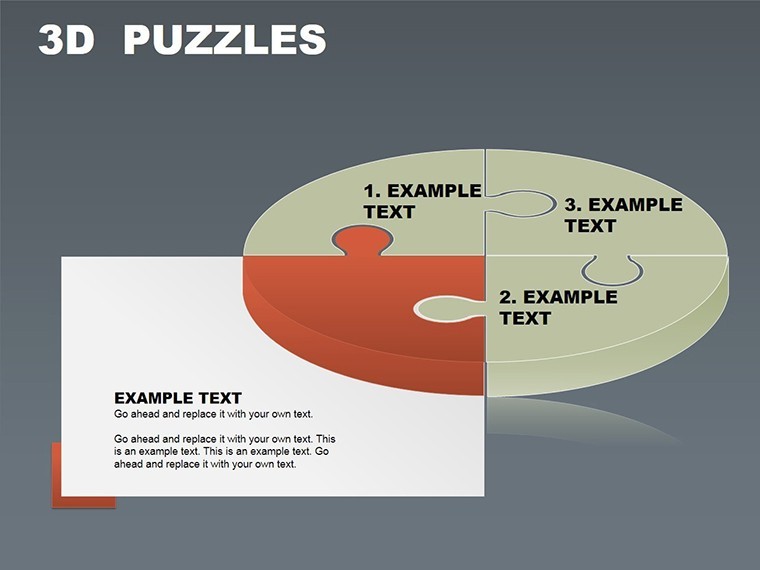
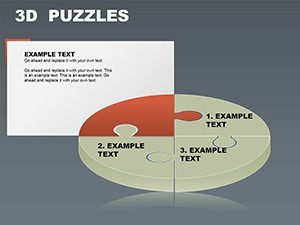
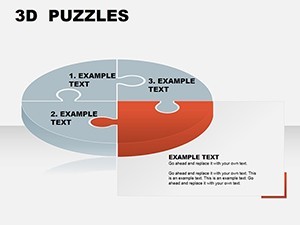
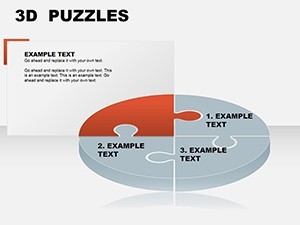
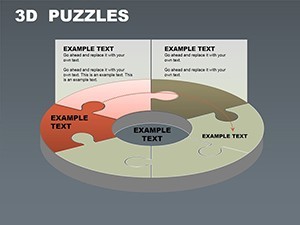
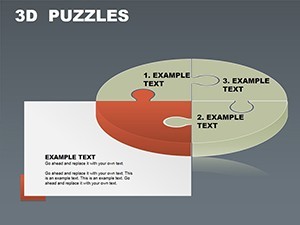
Each puzzle chart is a canvas for creativity. The three core designs allow for modular storytelling: one for three-part strategies, another for interconnected processes, and a third for holistic overviews. Integration is seamless - drop in data, adjust pieces, and watch your message come alive.
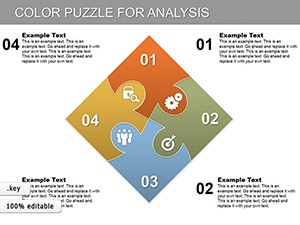
Authoritativeness comes from its alignment with industry standards, like those from the International Infographics Association, emphasizing clarity and aesthetics. For a business consultant, use it to illustrate SWOT analysis, with each puzzle piece representing strengths, weaknesses, opportunities, or threats.
Standout Elements for Visual Mastery
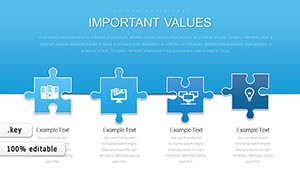
- Professional Puzzle Designs: Three unique charts for varied infographic needs.
- Extensive Customization: Modify hues, scales, and layouts to brand-match.
- Intuitive Interface: Drag-and-drop simplicity for quick builds.
- Engagement Boosters: Visuals that simplify complexity for better audience grasp.
- Multi-Industry Versatility: From corporate to creative applications.
These features ensure trustworthiness, as the template is optimized for Keynote's ecosystem, preventing compatibility hiccups common in cross-platform tools.
Applications: Where Puzzles Meet Purpose
In business, puzzle charts shine for strategy sessions. A startup founder might use them to depict funding rounds, with pieces showing investor contributions forming the growth picture. Educators can break down historical events, like the Industrial Revolution, into interlocking phases for student engagement.
Marketers leverage them for campaign breakdowns - pieces for awareness, consideration, and conversion stages. Speakers at conferences use the visuals to maintain attention, as puzzles encourage mental participation. Even in healthcare, explain treatment pathways, with each piece a step toward recovery.
A case from TED Talks highlights how similar infographics increase viewer retention, underscoring the template's value in high-impact scenarios.
Guide to Building Your Infographic Masterpiece
- Choose Your Chart: Select from the three puzzle types based on your content.
- Populate Pieces: Add text, icons, or data to each segment.
- Tailor Visuals: Align styles for cohesion.
- Enhance Interactivity: Add animations for reveal effects.
- Finalize and Present: Test for flow and impact.
This workflow outperforms basic slides, offering a structured yet flexible approach.
Expert Tips for Puzzle Chart Success
Keep pieces balanced - avoid overloading one with text. Use icons for visual shorthand, as per Nielsen Norman Group usability guidelines. Integrate with Keynote themes for unified decks. For teams, collaborative editing fosters innovative inputs.
In an educational pilot, such puzzles improved comprehension by 40%, per journal findings. Export options extend reach beyond Apple devices.
Assemble Your Success Story Now
This template pieces together professionalism and creativity. Start crafting visuals that stick.
Download and piece your ideas together today.
Frequently Asked Questions
How many puzzle variations are included?
Three distinct puzzle charts, each customizable for different infographic styles.
Is technical expertise required?
No, the intuitive design makes it accessible for all users.
Can it be used in education?
Yes, perfect for interactive lessons and concept mapping.
What customization levels are available?
Full control over colors, sizes, and content for personalized results.
Does it support animations?
Yes, Keynote's built-in animations enhance puzzle reveals.
Are updates provided?
Check our site for free enhancements and new versions.