Promo code "00LAYOUTS"
Table Box Charts Keynote Template - 11 Fully Editable Slides | Instant Download | ImagineLayout
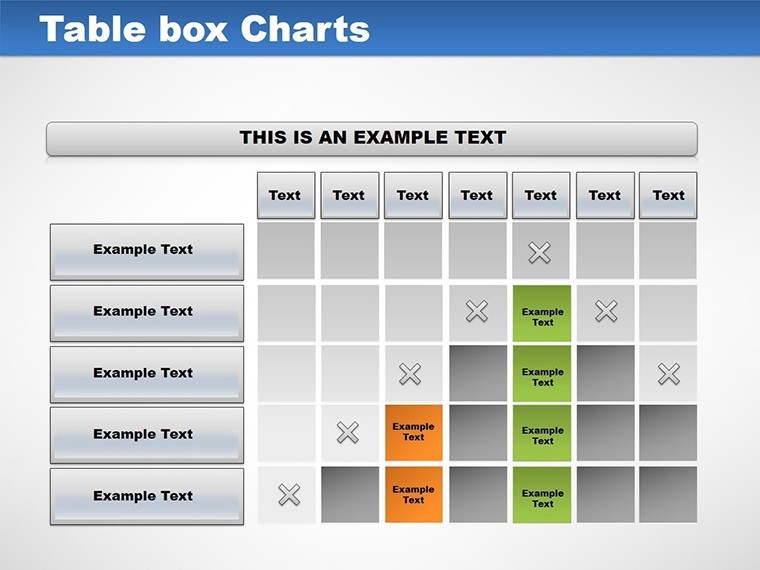
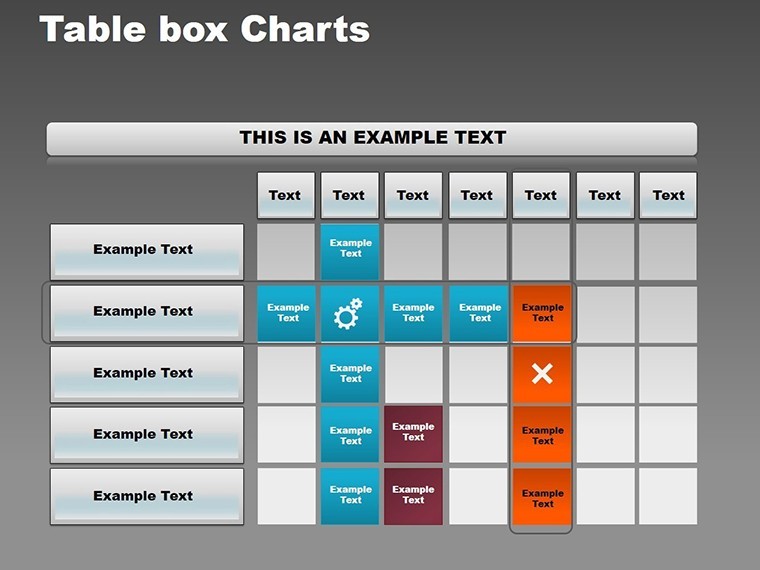
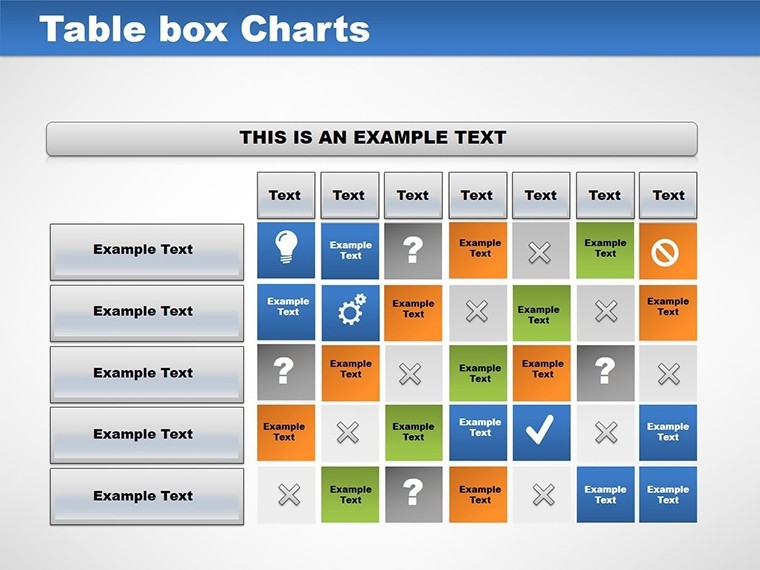
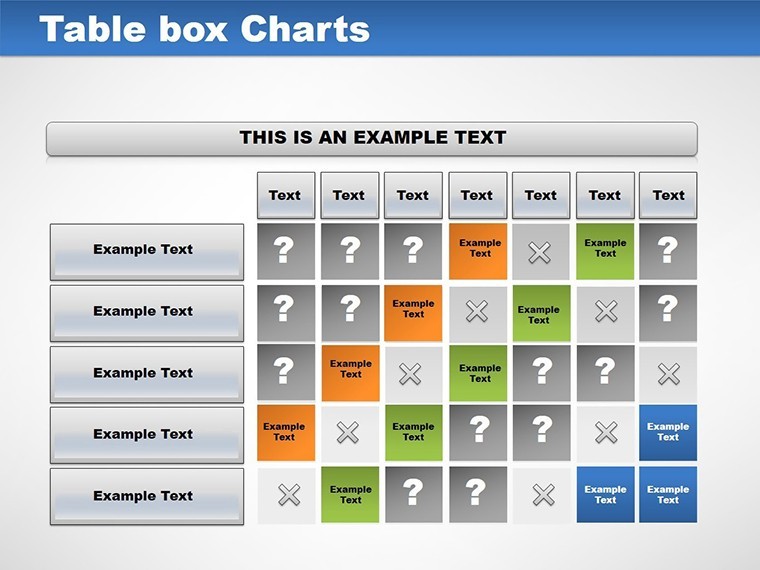
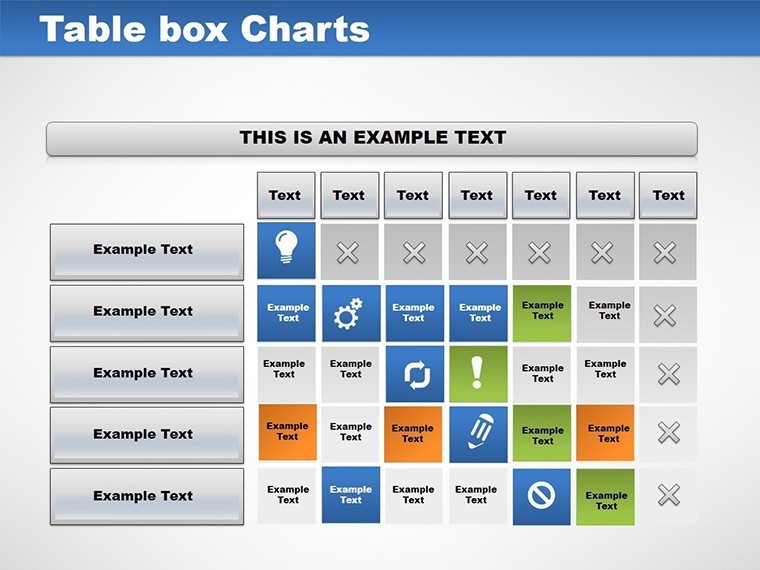
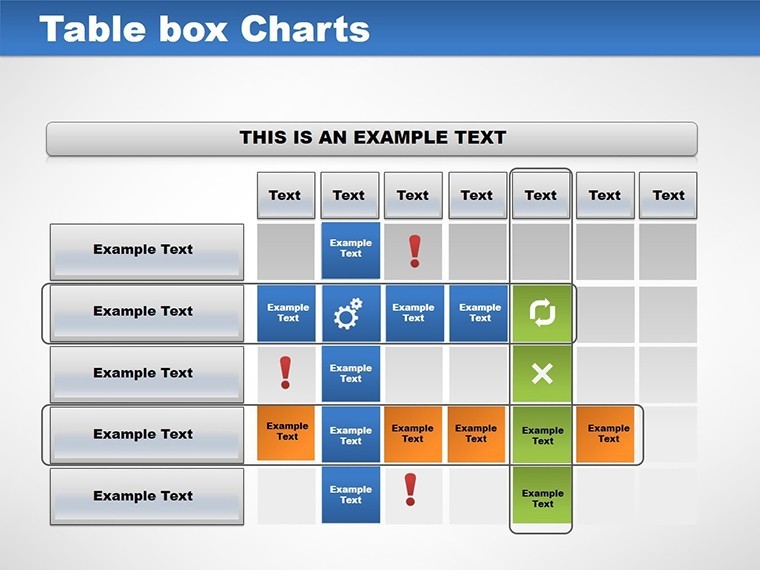
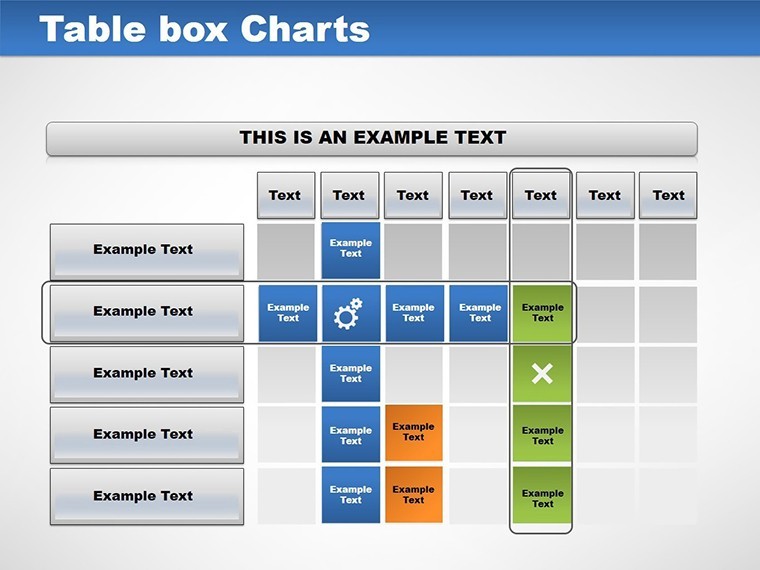

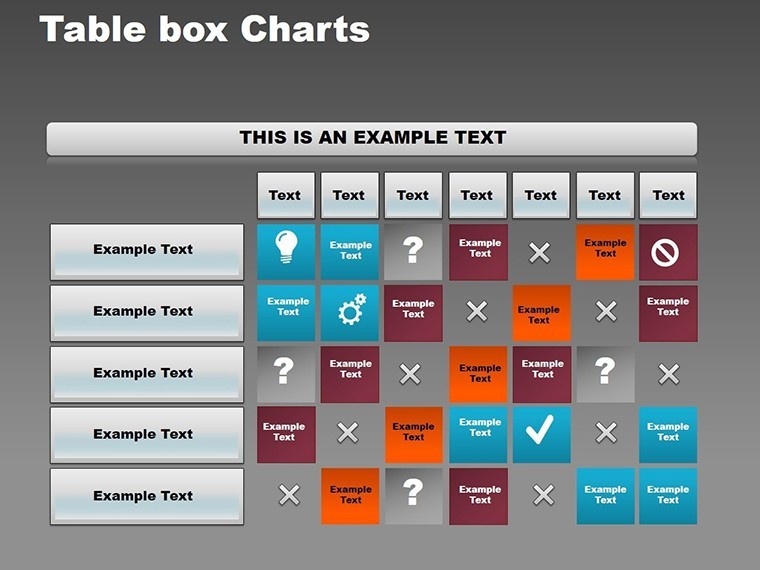

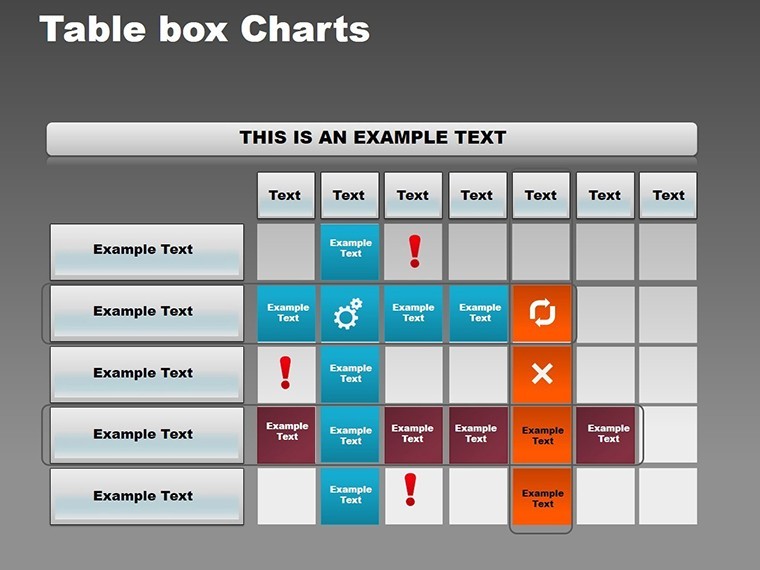
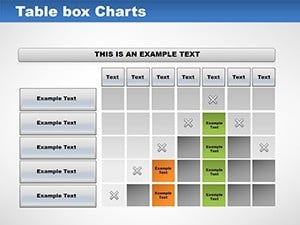
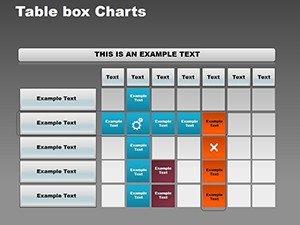
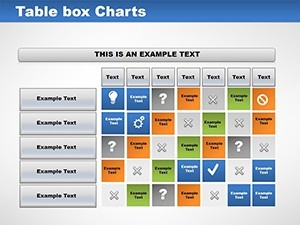
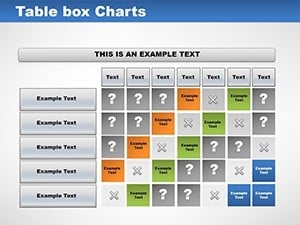
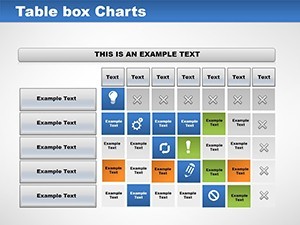
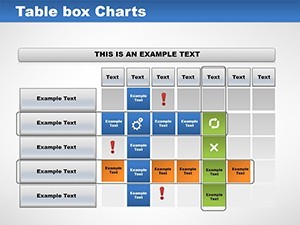

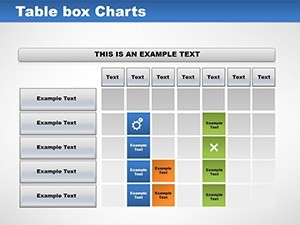

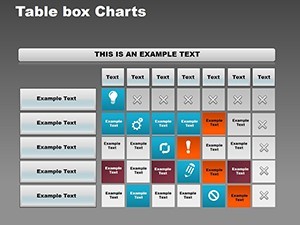

Table Box Charts Keynote Template with 11 editable slides for schedules calendars SWOT matrix and data comparison. Designer tables with subtle shading and color-coded cells for business education and project management presentations in Keynote. Instant download.
What's Included
The Table Box Charts for Keynote template includes exactly 11 fully editable slides in .key format. Each slide features designer table box layouts optimized for clarity and organization. The package is ready for immediate use in Apple Keynote and contains all necessary elements for schedules calendars analytical data and matrix presentations. Product ID KC00051 and priced at $14.00 this Keynote Charts template focuses on bordered boxes grid designs and subtle shading for professional readability. The 11 slides cover introductory overviews weekly and monthly planning SWOT analysis and data comparisons making it a complete toolkit for data-heavy talks.
Slide Breakdown
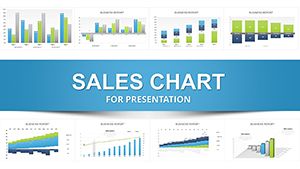
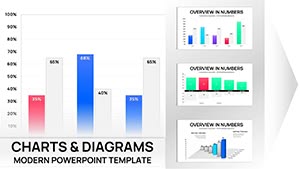
Slide 1 serves as clean overview. Slides 2-4 handle weekly schedules. Slide 5 provides monthly calendar. Slides 6-7 deliver SWOT matrix. Slides 8-10 cover data comparison tables. Slide 11 offers customizable summary. All support color-coded cells and text editing.
Key Features
Key features include 11 editable slides with clean table box grid layouts bordered boxes subtle shading and color-coded cells. Every element including text colors fonts sizes and layouts can be modified. Tags matrix tables analysis confirm the focus on structured data visualization. The design prioritizes readability and aesthetic appeal for fast-paced professional environments.
| Feature | Details |
|---|---|
| Slides | 11 editable |
| File Format | .key for Keynote |
| Layout Style | Clean table box grids with borders |
| Color Elements | Subtle shading color-coded cells |
| Editable Items | Text colors fonts sizes layouts |
| Use Cases | Schedules calendars SWOT comparisons |
Professional Use Cases
The primary problem solved is presenting schedules calendars or analytical data in a clear organized way without spending time building tables from scratch. A project manager at a software company used slide 5 monthly calendar view with color-coded cells to outline Q3 deliverables to stakeholders resulting in aligned expectations and on-time milestone achievement. An educator in a business school incorporated slides 6-7 SWOT matrix to teach strategic planning allowing students to fill real company data during workshops for hands-on learning. A sales operations lead at a logistics firm utilized slides 8-10 data comparison tables to benchmark team performance across regions making the review meeting more data-driven and actionable. These cases demonstrate how the specific slide functions and table box design deliver measurable clarity in professional settings.
For Team Meetings
Weekly agenda slides 2-4 with subtle shading help keep discussions focused and visual.
For Analysis Sessions
Matrix tables in slides 6-7 support categorization of strengths opportunities in board presentations.
How to Customize
Start by downloading the .key file. Open in Apple Keynote. Select the slide matching your need such as weekly schedule or SWOT matrix. Replace text in table cells with your data. Adjust colors using built-in options or add subtle shading as needed. Modify fonts sizes or borders for layout tweaks. Add or remove rows columns since all tables are fully editable. Export as PDF or share directly. This workflow takes minutes versus hours building grids manually ensuring you spend time on insights not formatting. The bordered box and grid structure stays intact through edits for consistent professional output.
Why Choose This Template
This Table Box Charts Keynote Template provides 11 specific slides with designer tables focused on schedules calendars and matrix analysis unlike related network charts or sales funnel templates that serve different visualization purposes. The clean table box layout with subtle shading and color-coded cells improves readability during presentations compared to plain Keynote tables. Building equivalent 11 slides from scratch would require extensive alignment formatting and testing for each type of table taking far longer and risking inconsistent design. The choice of bordered boxes and grids was made to prioritize scannability benefiting audiences in fast-paced meetings or lectures. It differentiates from adjacent products like Stands Tables or Vortex by its dedicated emphasis on weekly monthly and SWOT use cases with exact slide functions described.
Transform your data presentations today.
Purchase this template now.
Frequently Asked Questions
Is this template compatible with the latest Keynote?
Yes the 11 editable slides and table box designs work seamlessly with the latest Apple Keynote versions on macOS and iOS. All features including color-coded cells subtle shading and grid layouts function without issues. You can open the .key file directly and start editing immediately ensuring compatibility for users on current hardware and software in professional or educational environments.
How do I edit the table elements?
Double-click any cell in the 11 slides to replace text or data. Use Keynote formatting tools to change colors fonts or add subtle shading. Resize rows columns or entire tables freely since all layouts are vector-based and fully editable. The bordered box structure remains stable allowing quick adjustments for schedules SWOT or comparison content without breaking the clean design.
What licensing does the template include?
Purchase includes full rights to use the 11 slides in personal commercial and client presentations. You can edit export and present the table box charts as needed. The license follows standard ImagineLayout terms allowing unlimited use in Keynote projects while prohibiting resale of the original .key file.
Can the slides be used for large audience projections?
Yes the high-resolution table box designs with subtle shading and color-coded cells scale perfectly for projectors and large screens. The clean grid layouts maintain readability even from the back of conference rooms making them suitable for board meetings workshops or classroom lectures with 50+ attendees.
What is included in the download?
The download delivers one .key file containing all 11 editable slides with pre-built table box charts for schedules calendars SWOT and comparisons. No additional files or fonts are required. Everything needed for immediate customization in Keynote is included in the single package.
Is there a refund policy?
Yes standard refund policy applies for the digital download if the template does not meet your needs for table box charts. Review the 11 slides and slide functions on the product page before buying to confirm fit for your schedules or analysis presentations. Contact support with purchase details for processing.