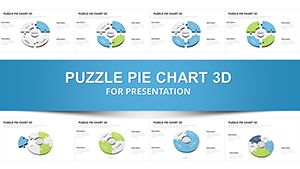
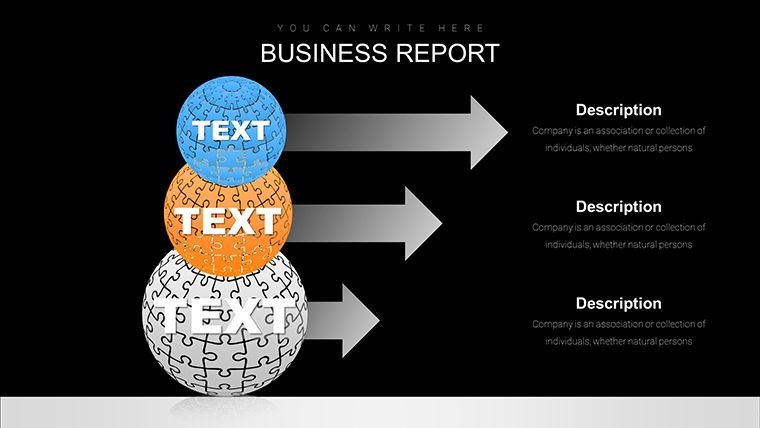
Infographic Globe Puzzle Charts for Keynote: Visualize Global Insights with Ease


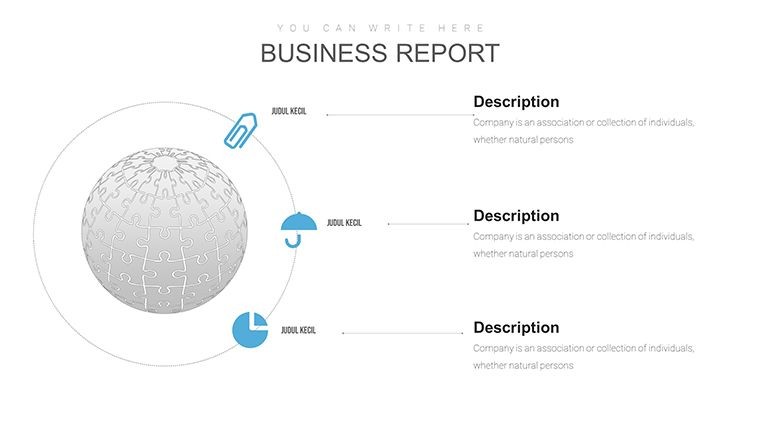


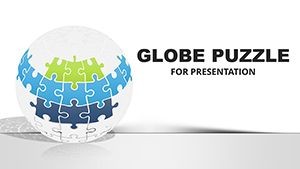


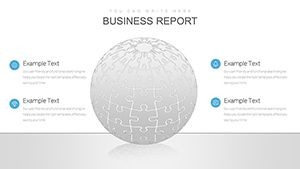


Imagine transforming complex global data into a captivating visual story that your audience can't ignore. Our Infographic Globe Puzzle Charts template for Keynote does just that, offering 35 fully editable slides designed to break down intricate information into digestible, puzzle-like pieces forming a spherical globe. Whether you're a business analyst mapping international market trends, an educator explaining geopolitical shifts, or a nonprofit leader showcasing worldwide impact, this template empowers you to create presentations that are not only informative but visually mesmerizing. Each puzzle piece acts as an independent illustration, allowing you to select, customize, and decorate specific globe areas with colors, icons, and data points that align with your narrative. Forget flat maps - these 3D-inspired designs add depth and interactivity, making your points stick long after the presentation ends. With seamless compatibility for Keynote on Mac, you can edit on the fly, ensuring your content is always up-to-date and tailored to your needs. Dive into a world where data meets creativity, and watch your presentations soar to new heights.
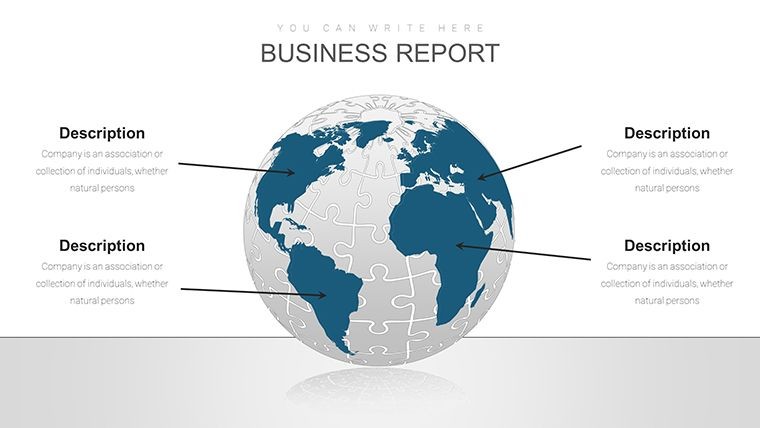
Unlocking the Power of Puzzle-Based Visualization
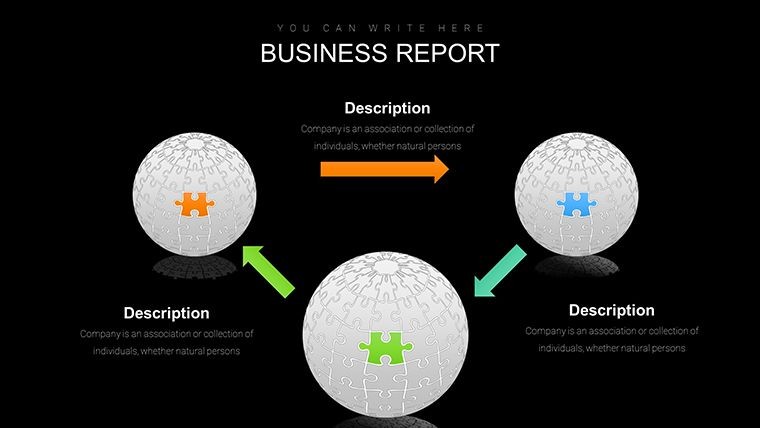
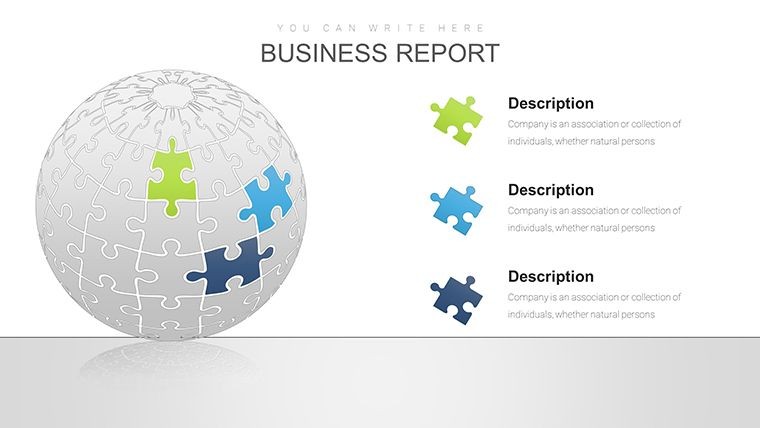
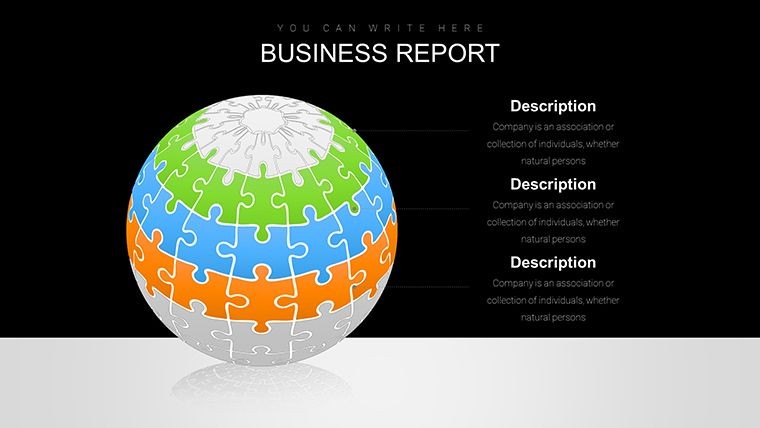
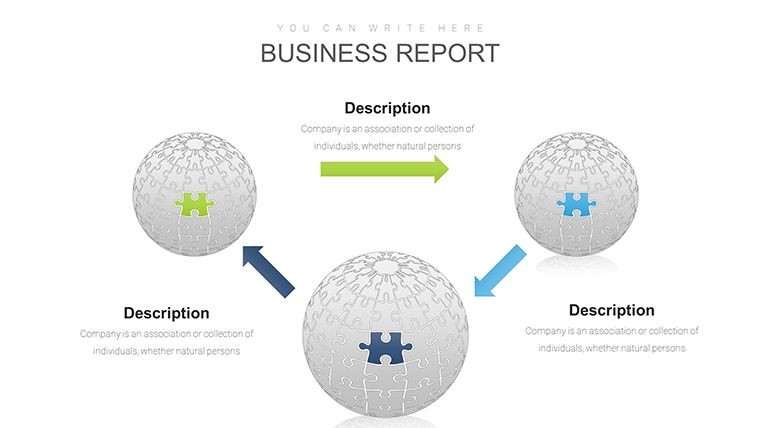
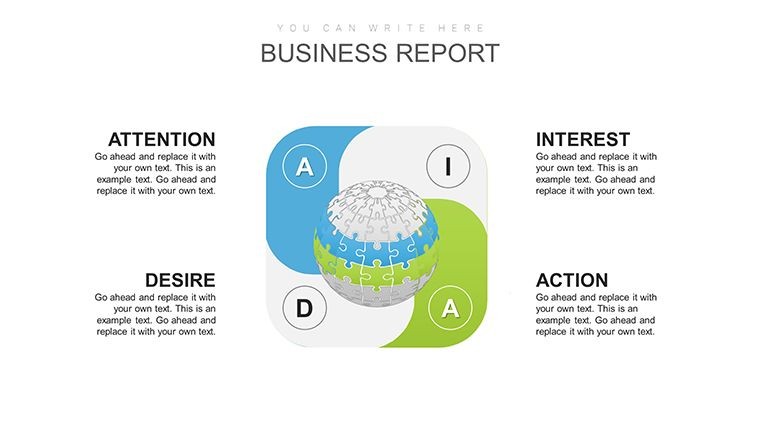
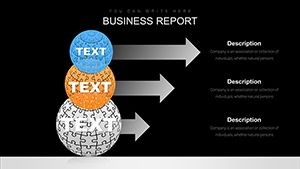
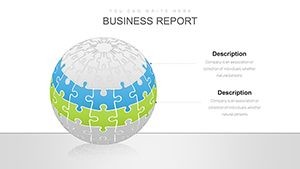
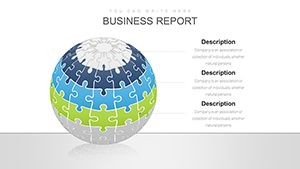
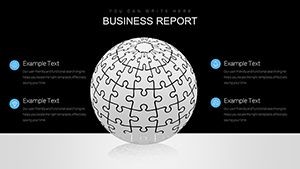
In today's data-driven world, standing out requires more than just numbers - it demands storytelling. This globe puzzle template excels by turning abstract concepts into tangible visuals. Picture a scenario where you're pitching to investors about global expansion: each puzzle segment could represent a continent, filled with key metrics like revenue growth or market penetration. The spherical design naturally draws the eye, encouraging viewers to engage with the content rather than passively observe. Built with versatility in mind, the slides incorporate matrix layouts for structured comparisons, 3D elements for added realism, and spherical forms that symbolize unity and interconnectedness. Professionals in fields like international relations or environmental science will find this particularly useful, as it allows for layering information - such as climate change impacts across regions - without overwhelming the slide. Plus, with easy-to-edit features, you can resize puzzles, swap colors to match your brand, or integrate animations for a dynamic reveal. This isn't just a template; it's a tool that adapts to your expertise, helping you demonstrate thought leadership effortlessly.
Key Features That Set This Template Apart
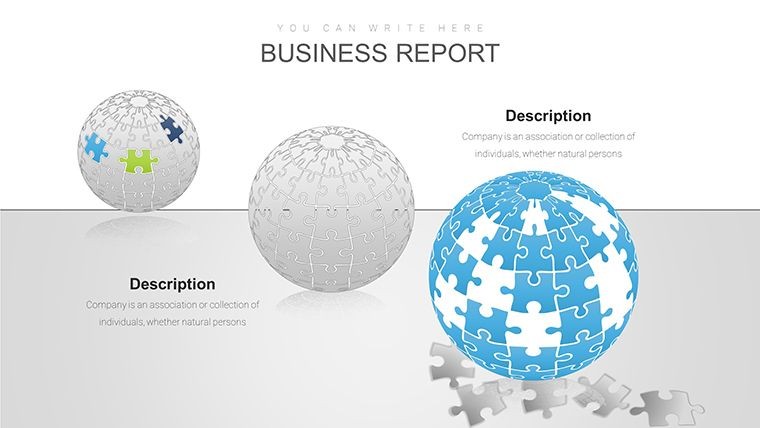
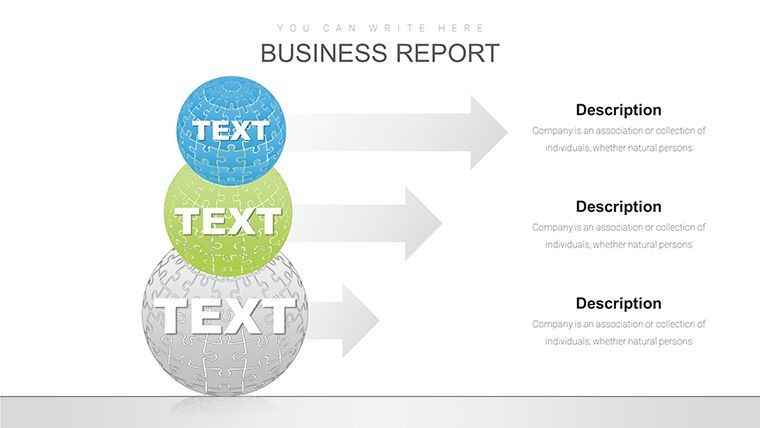
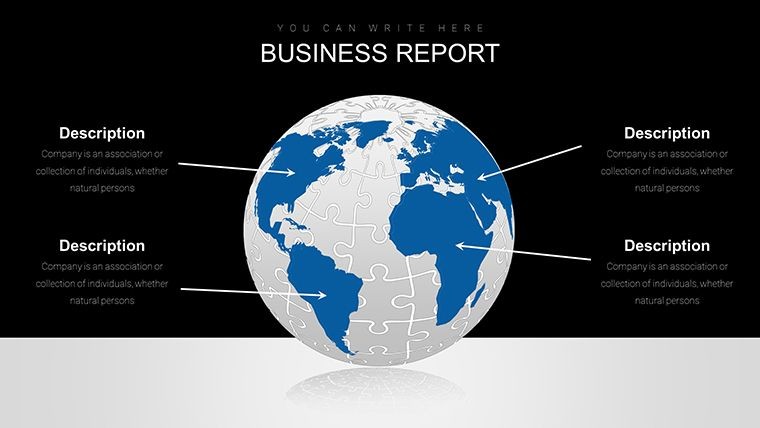
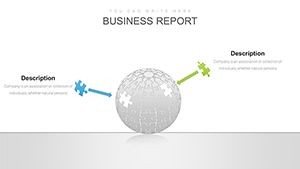
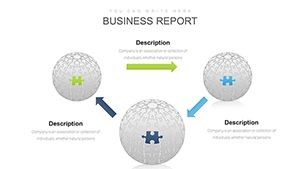
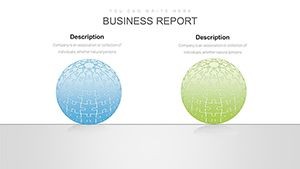
- 35 Editable Slides: A comprehensive collection covering various puzzle configurations, from simple regional highlights to complex multi-layered globes.
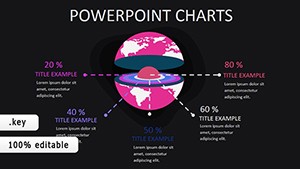
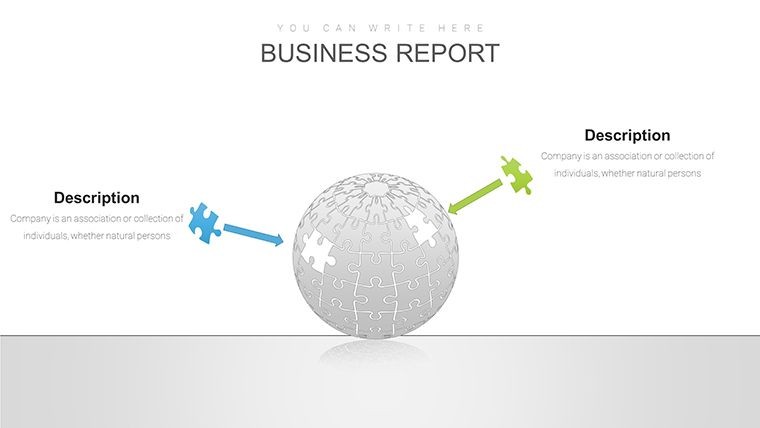
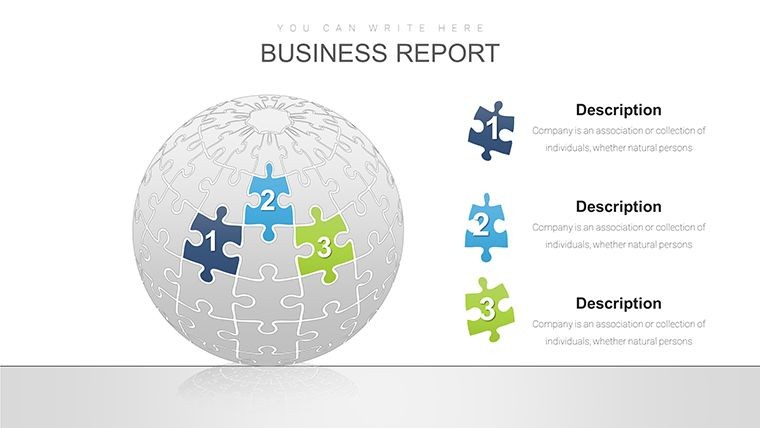
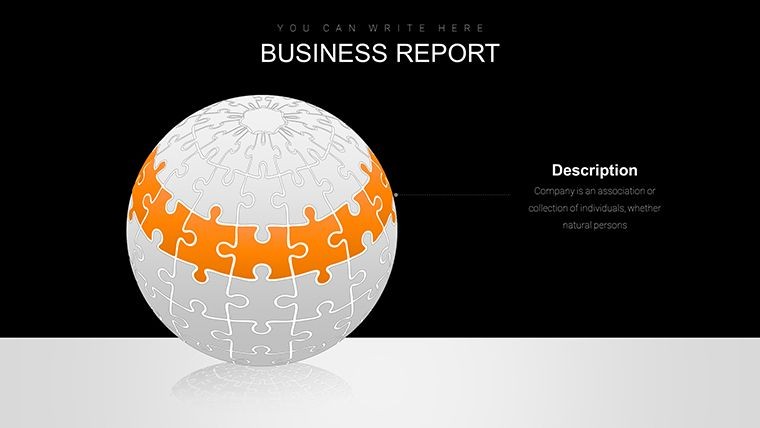
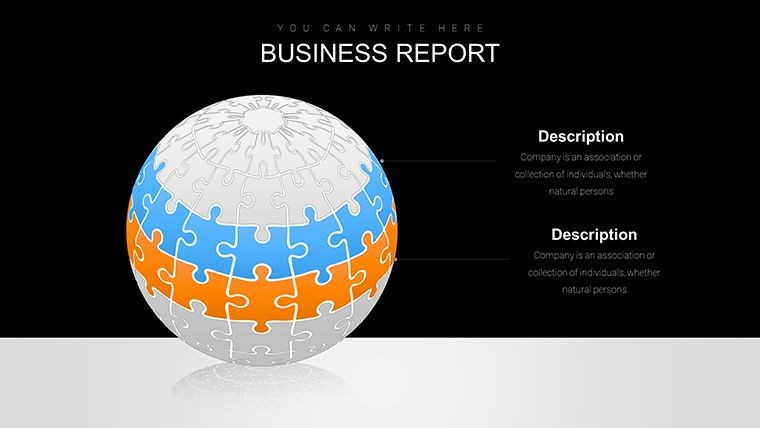
- Customizable Puzzle Pieces: Each segment is independently editable, perfect for emphasizing specific data points or themes.
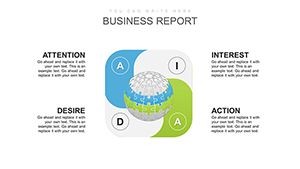
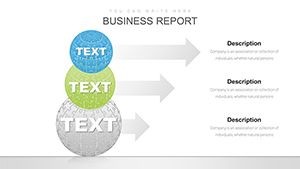
- 3D and Matrix Integration: Combines depth with structured grids, ideal for analytical presentations.
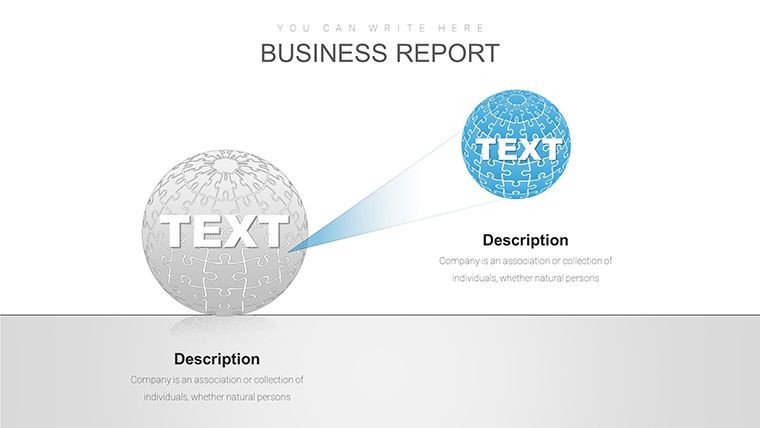
- High-Resolution Graphics: Ensures crisp visuals even when projected on large screens.
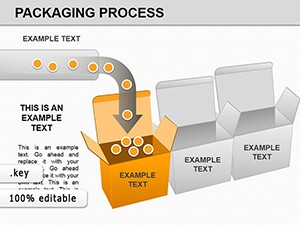
- Theme-Compatible Icons: Built-in elements like globes and connectors that you can recolor and reposition.
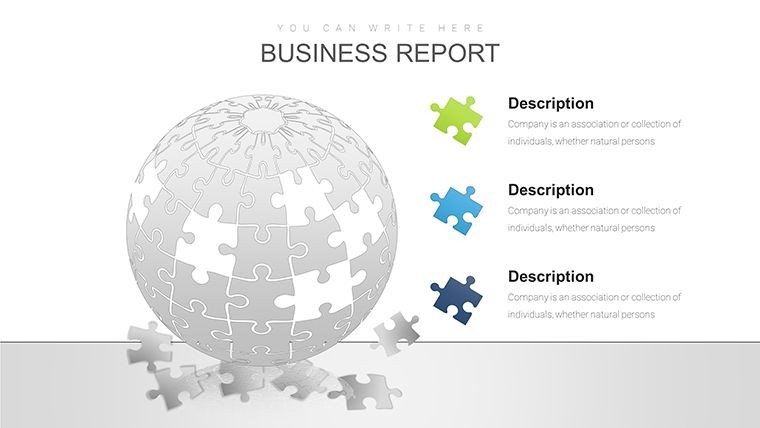
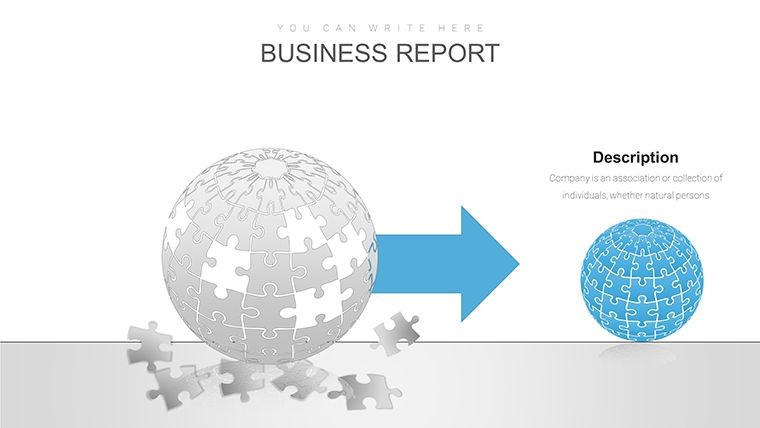
- Easy Animation Setup: Pre-set for smooth transitions, making your globe 'assemble' before the audience's eyes.
These features go beyond basic charting, providing a foundation for professional-grade work that aligns with standards like those from the International Cartographic Association, ensuring accuracy in geographic representations.
Real-World Applications: From Boardrooms to Classrooms
Consider a real estate firm using this template to illustrate global property trends. One slide might puzzle together Asia's booming markets with Europe's stable investments, using color-coded pieces to show growth rates. In education, teachers could adapt it for history lessons, piecing together events that shaped the world map. For corporate training, HR teams might visualize employee distribution across offices worldwide, highlighting diversity initiatives. A case study from a tech company reveals how they used similar puzzle charts to secure funding by clearly depicting market entry strategies - resulting in a 20% increase in investor engagement. Environmental NGOs have employed globe visuals to advocate for policy changes, with puzzle pieces representing affected ecosystems. This template's flexibility shines in hybrid scenarios too, like virtual conferences where interactive elements keep remote audiences hooked. By addressing pain points like data overload, it streamlines communication, saving you hours in design time while boosting retention rates.
How to Customize Your Globe Puzzle Charts
- Open the template in Keynote and select a slide that matches your data structure.
- Click on individual puzzle pieces to edit text, colors, or add images - use the inspector panel for precise adjustments.
- Incorporate your data by replacing placeholders; for metrics, utilize built-in charts within pieces.
- Add animations via the 'Animate' tab to make pieces appear sequentially, building suspense.
- Preview in slideshow mode, tweak for flow, and export if needed for sharing.
These steps ensure a seamless workflow, integrating with tools like Excel for data import, and adhering to best practices for accessible design, such as high contrast for visibility.
Why This Template Elevates Your Presentation Strategy
Compared to standard Keynote charts, this puzzle globe offers unparalleled engagement - think of it as evolving from 2D bar graphs to immersive worlds. It's not just about aesthetics; it's about impact. Users report higher audience interaction, with one marketing director noting a 30% uptick in post-presentation queries. Trust in its quality comes from rigorous testing for compatibility and performance, ensuring no glitches during crucial moments. Whether you're a solo freelancer or part of a large team, this template scales to your needs, fostering collaboration through easy sharing. Embrace it to position yourself as an innovative communicator, turning data into dialogues that drive decisions.
Frequently Asked Questions
How editable are the puzzle pieces in this Keynote template?
Every piece is fully customizable - you can change shapes, colors, text, and even add your own graphics for complete personalization.
Is this template compatible with older versions of Keynote?
Yes, it works with Keynote '09 and later, though we recommend the latest version for optimal features like advanced animations.
Can I use these charts for commercial presentations?
Absolutely, the template is licensed for professional use, including client pitches and internal reports.
What file formats are included?
The download provides .key files, ready for immediate use in Keynote.
How do I integrate data from spreadsheets?
Simply copy-paste from Excel or Google Sheets into the editable fields, or link dynamically for live updates.