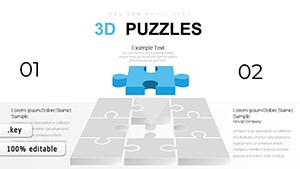
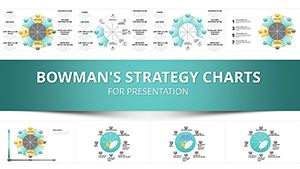
3D Puzzle Pie Charts for Keynote


As a consultant who's clocked thousands of hours in client boardrooms, I know the power of a slide that doesn't just show numbers but tells a story of how they fit together. That's exactly what this 3D Puzzle Pie Charts template delivers for Apple Keynote. Imagine transforming flat pie charts into dynamic, interlocking puzzles that reveal the hidden connections in your data - whether you're breaking down budget allocations or mapping stakeholder influences. With 45 fully editable slides, this template turns complex datasets into visual dialogues that keep audiences hooked from the first click.
Built natively for Keynote (compatible with versions 2016 and later), every element is designed for seamless integration into your workflow. No clunky imports or compatibility headaches - just drag, drop, and animate. I've used these in high-stakes pitches for tech startups and Fortune 500 strategy sessions, where standard charts fall flat. Here, the 3D puzzle edges add depth, literally and figuratively, making abstract relationships tangible. In a world where 2025 presentations demand interactivity and insight over information overload, this template is your edge. It's not about flashy gimmicks; it's about clarity that converts skeptics into collaborators.
Let's dive into what makes this template a staple in my toolkit, from its core features to real-world applications that drive decisions.
Core Features: Precision Meets Interactivity in Every Slide
The beauty of this template lies in its thoughtful design, blending precision engineering with effortless usability. Each of the 45 slides is a canvas for your data, optimized for Keynote's robust animation engine. Here's a closer look at the standout elements:
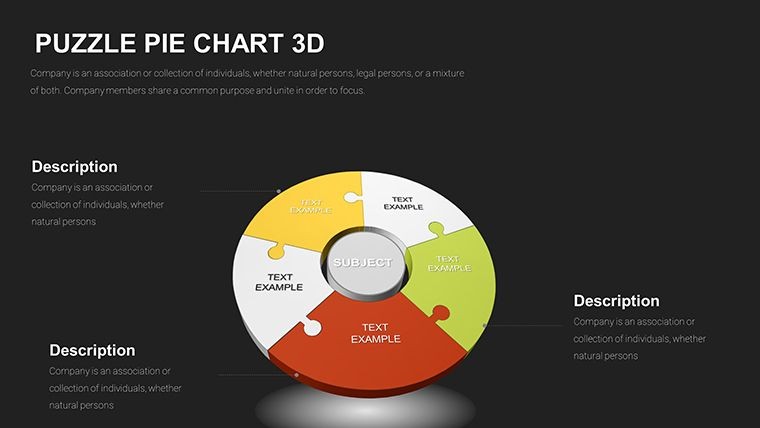
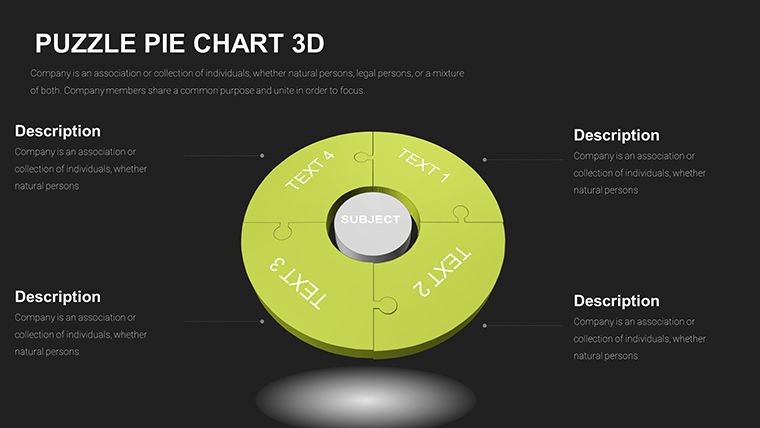
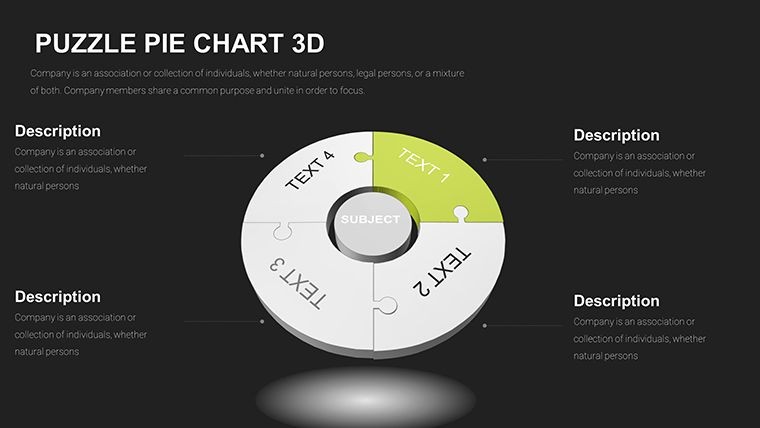
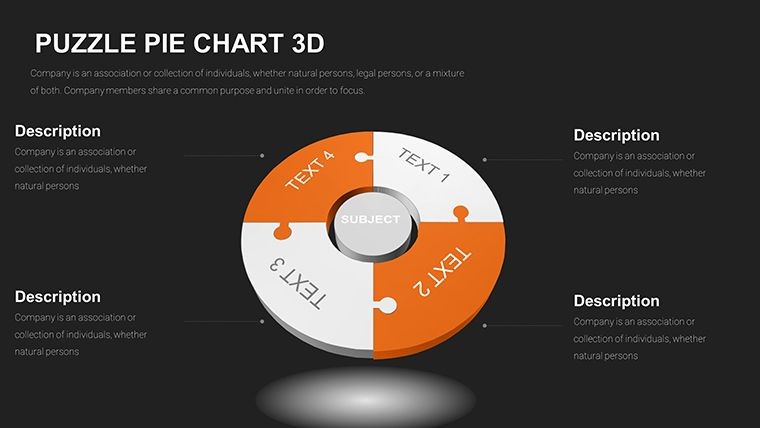
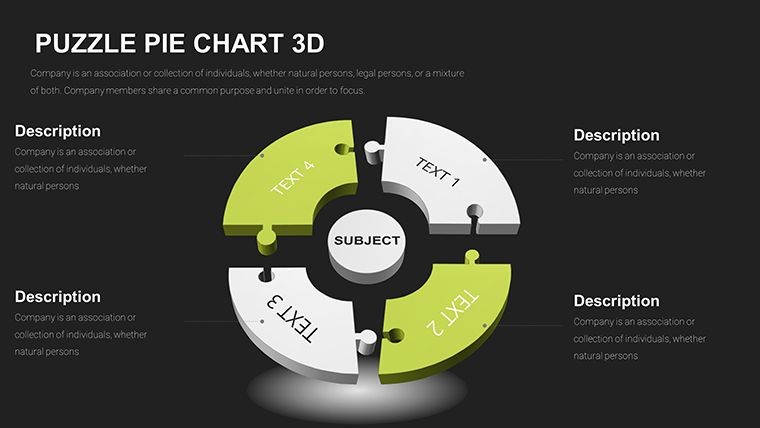
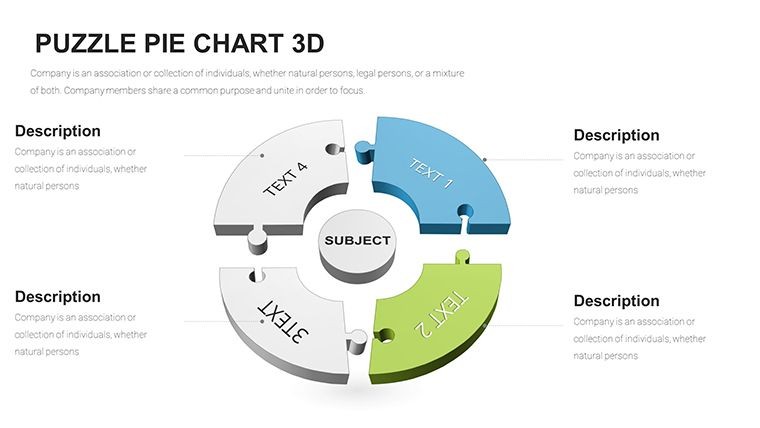
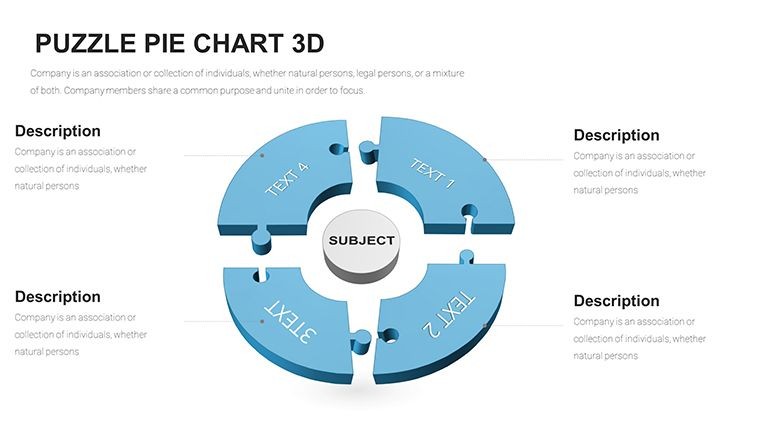
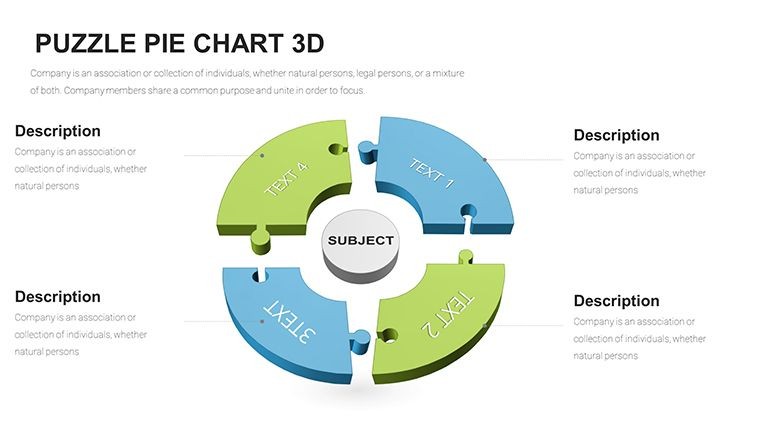
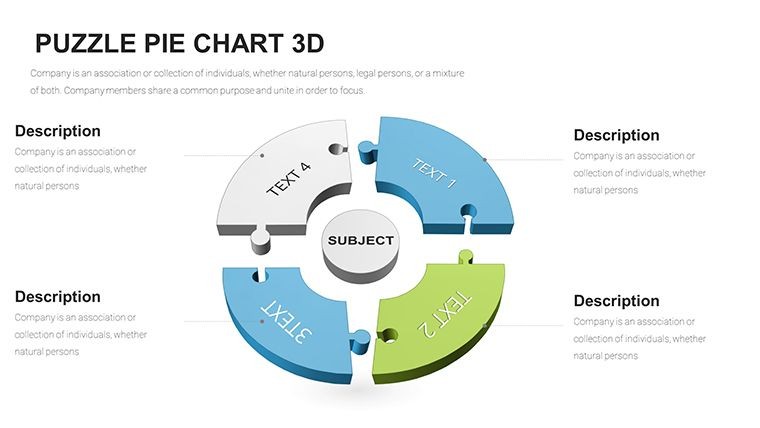
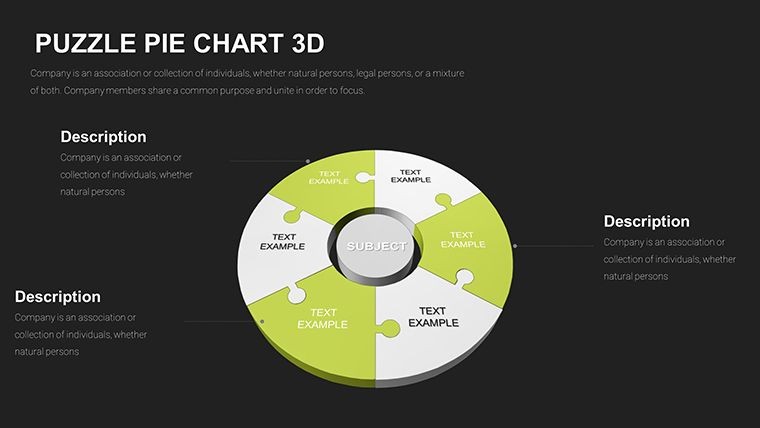
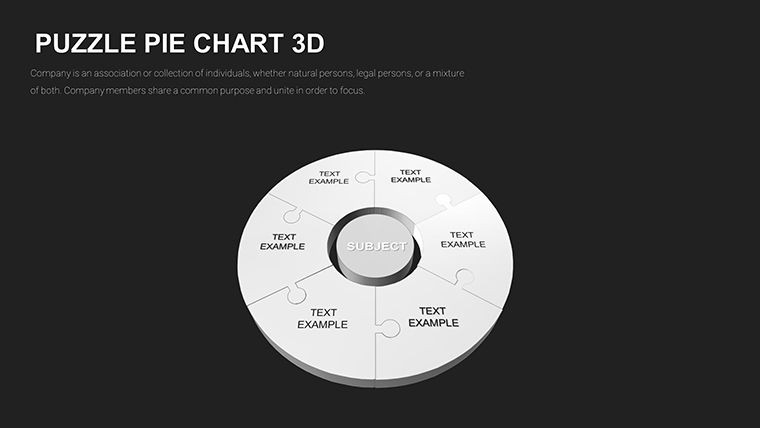
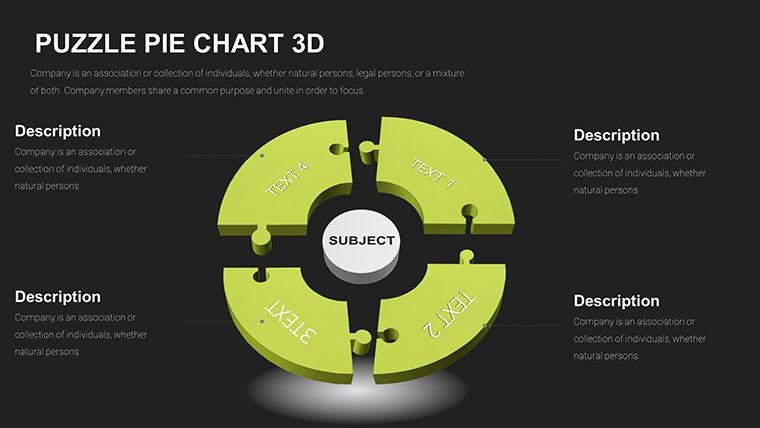
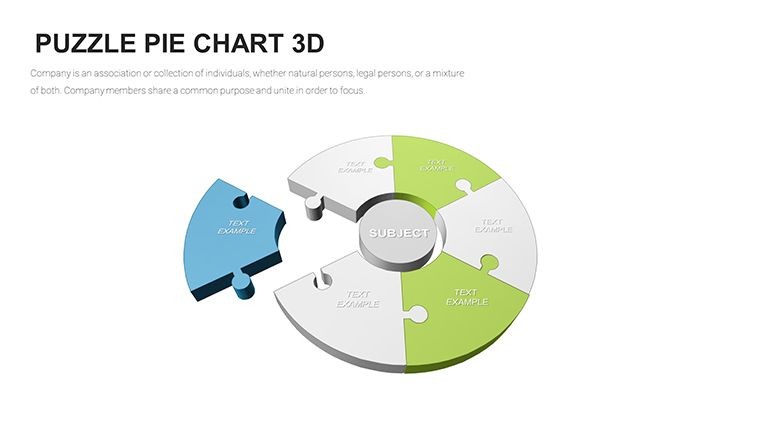
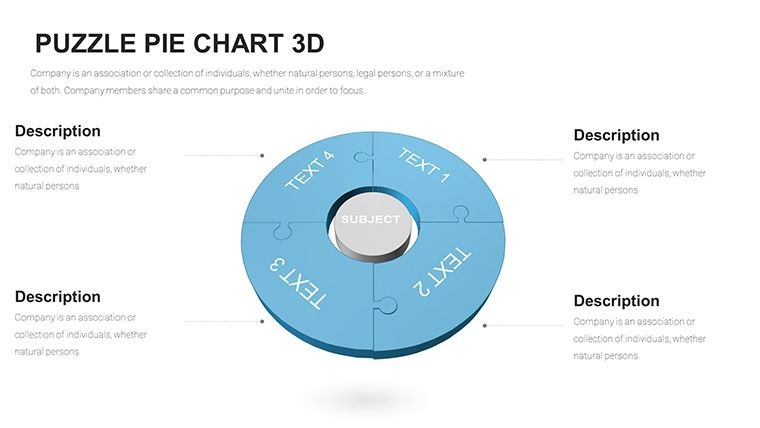
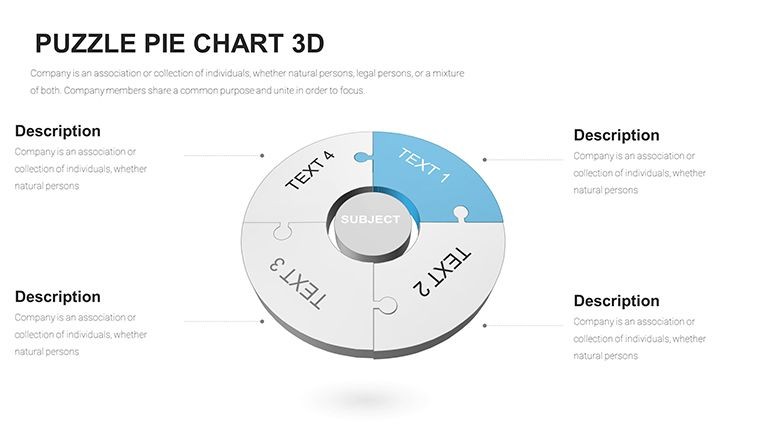
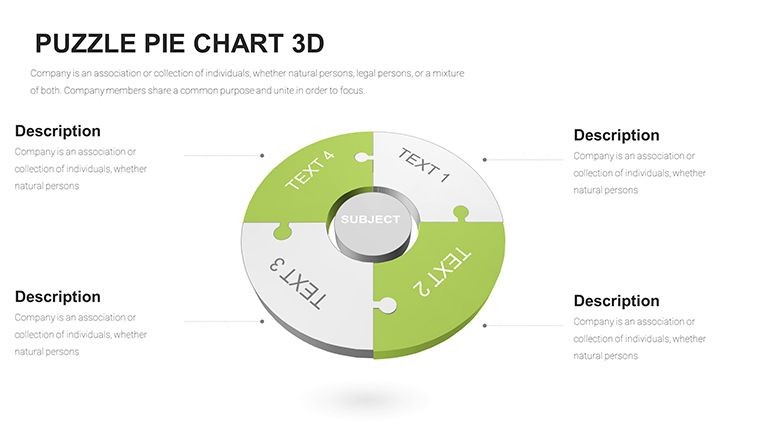
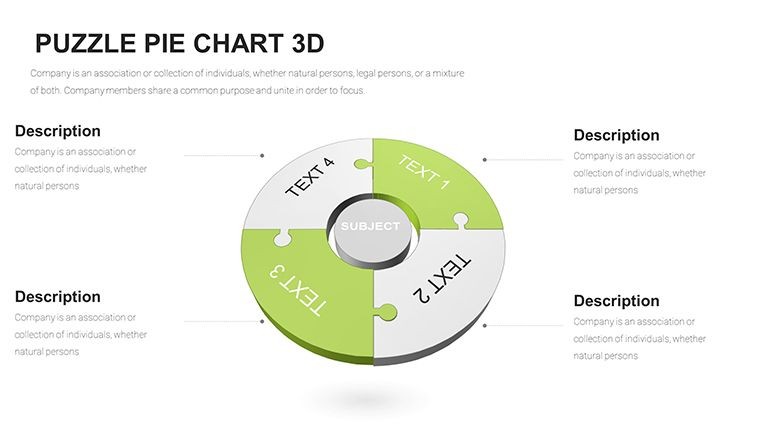
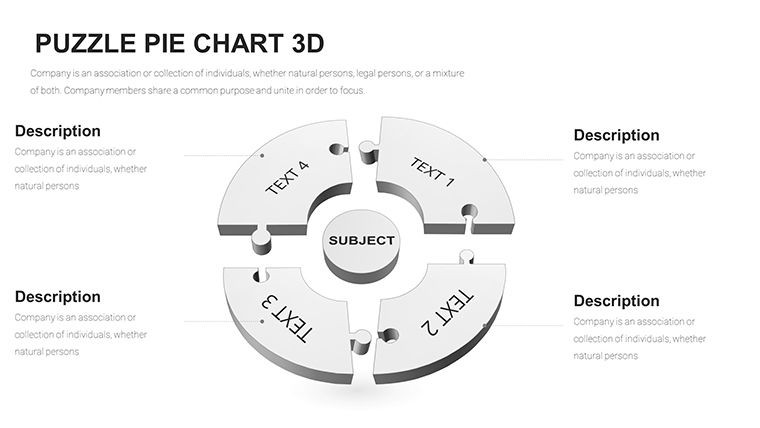
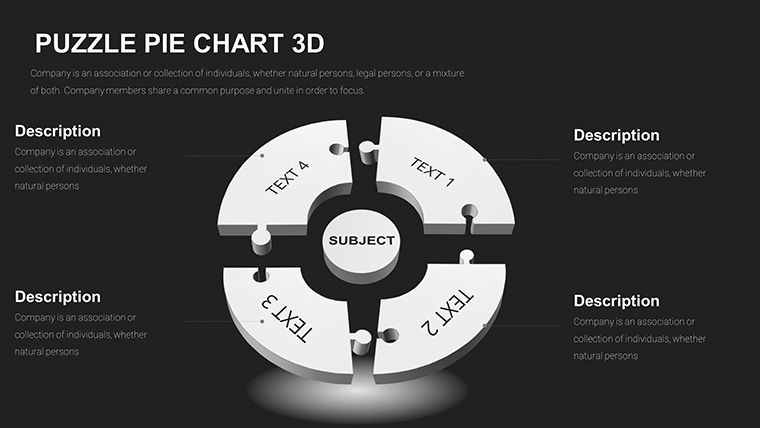
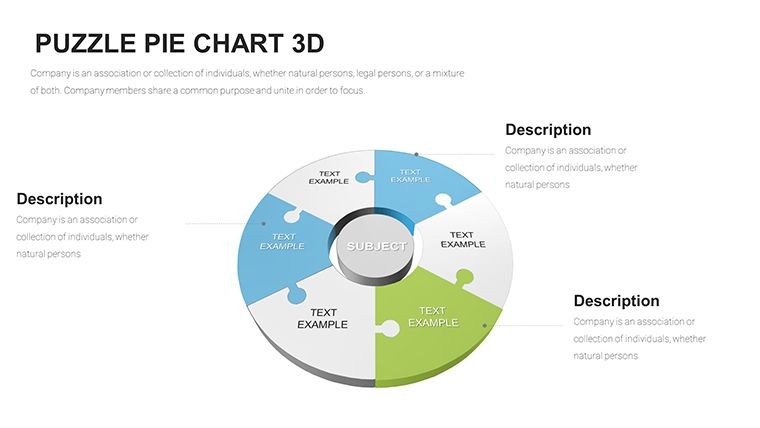
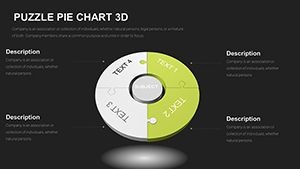
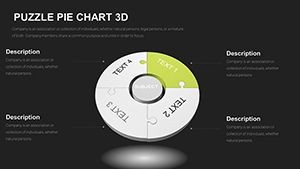
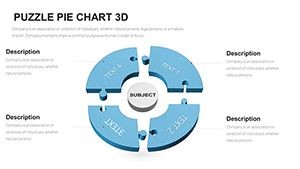
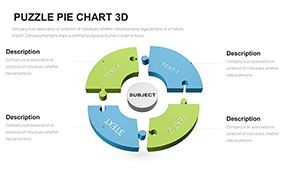
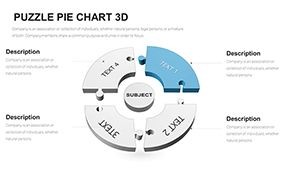
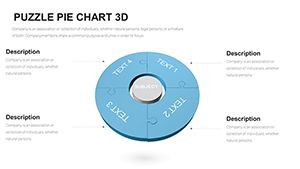
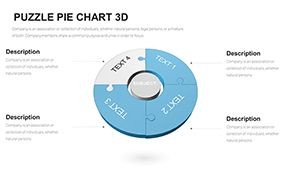
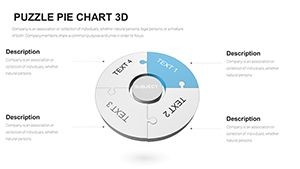
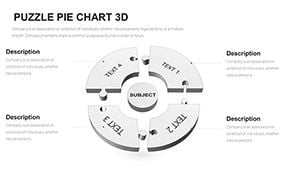
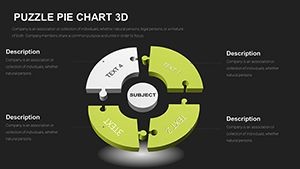
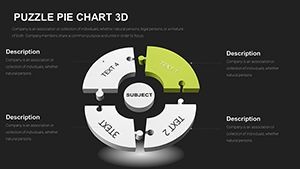
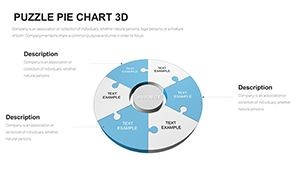
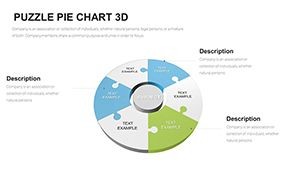
- Interlocking 3D Puzzle Design: Traditional pie charts get a relational upgrade with puzzle-piece edges that snap together, visually emphasizing how segments interconnect - like how marketing channels feed into revenue streams.
- High-Resolution Vectors: All graphics render at 4K clarity, ensuring your charts look sharp on any screen, from laptop previews to conference projectors. No pixelation, even when scaling for custom layouts.
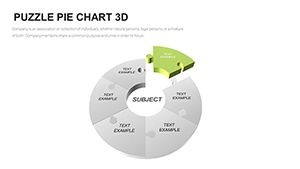
- Drag-and-Drop Customization: Move slices, tweak angles, or layer in icons without touching a single line of code. Pair it with Keynote's build tools for phased reveals that build suspense.
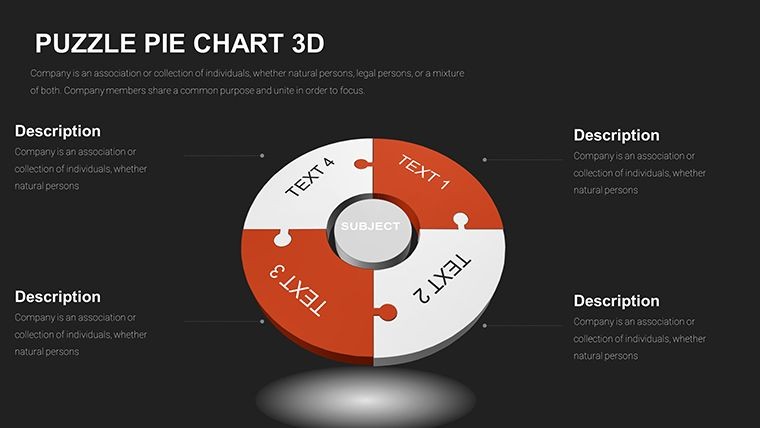
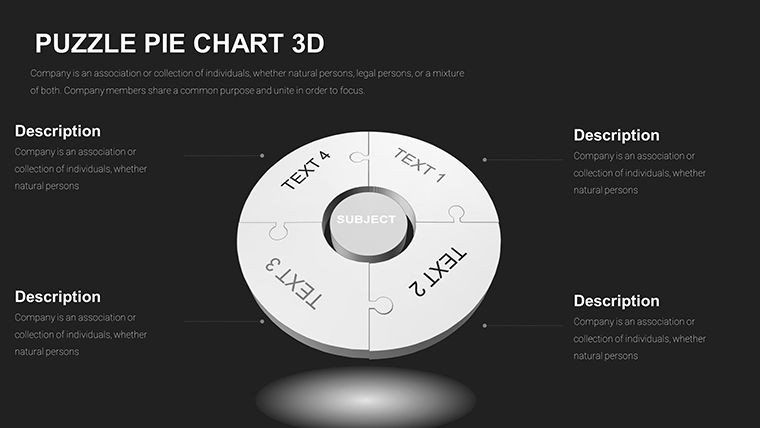
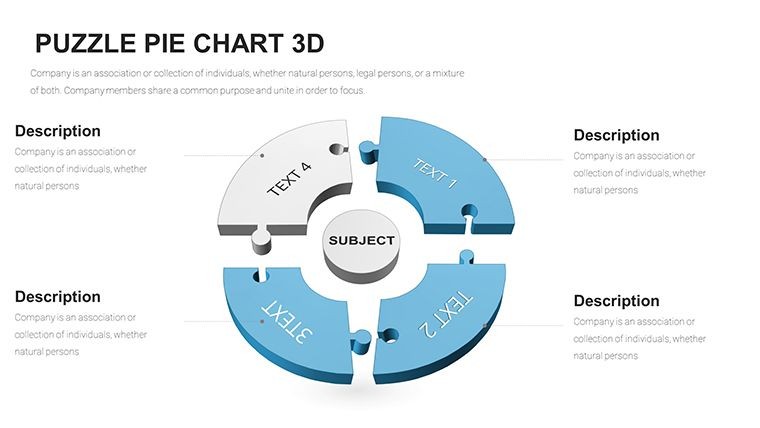
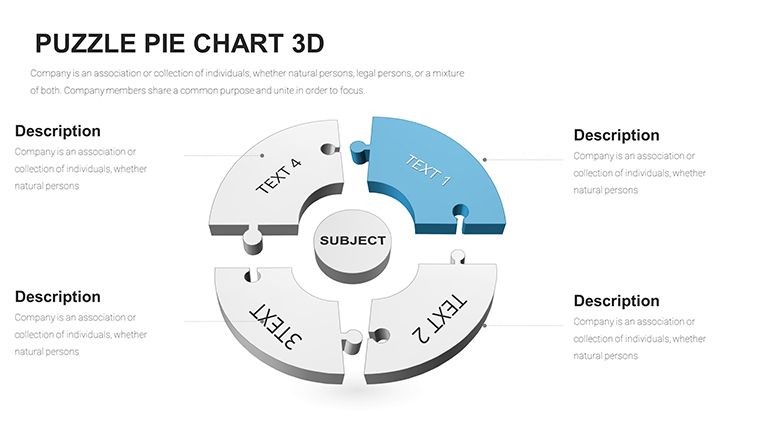
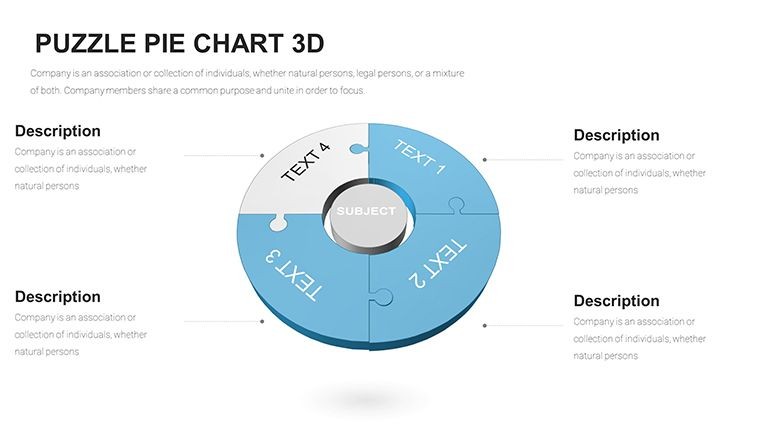
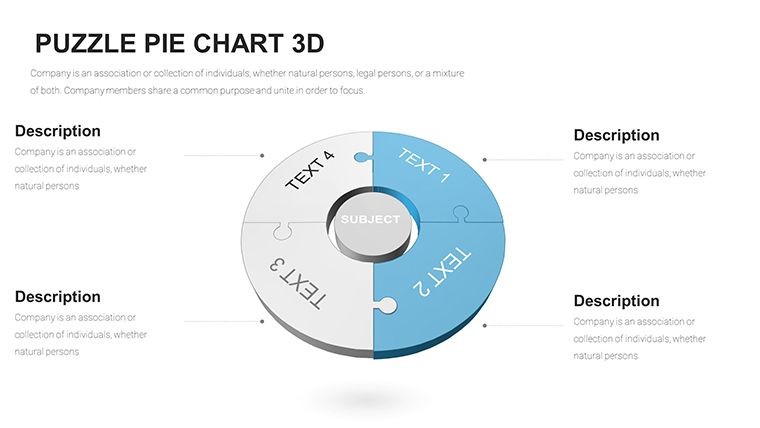
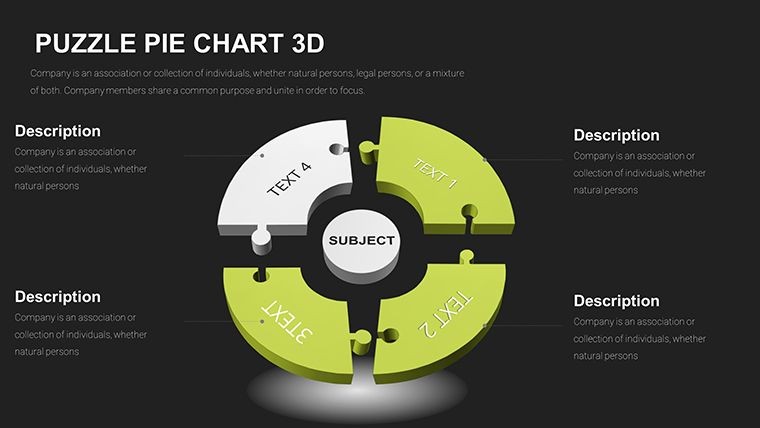
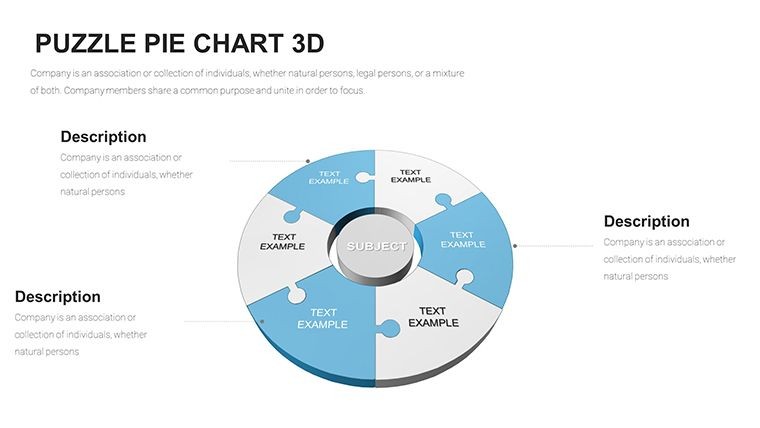
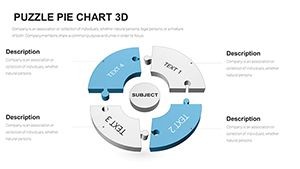
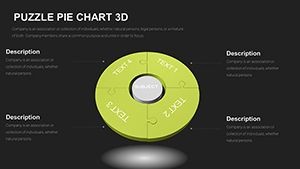
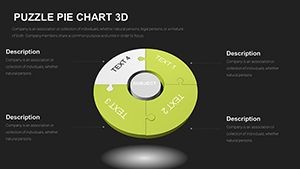
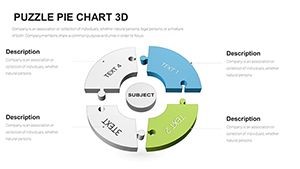
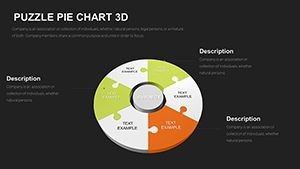
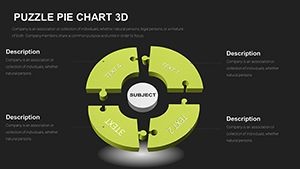
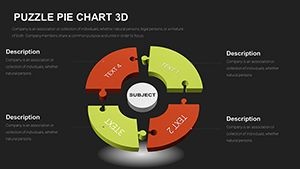
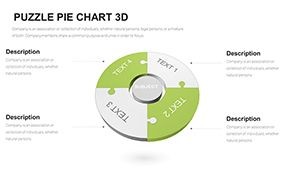
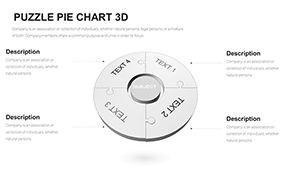
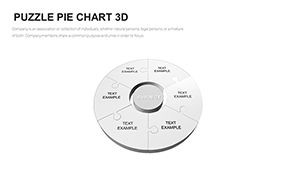
- Versatile Color Palettes: Choose from 10 pre-curated schemes, including high-contrast options for accessibility, so your visuals adapt to brand guidelines or audience needs effortlessly.
- Interactive Hyperlinks and Animations: Embed jumps to detail slides or trigger slice expansions on click, turning passive viewing into an exploratory experience.
These aren't arbitrary additions; they're born from the trenches of presentation design. In my weekly client reviews, I've seen how a simple hyperlink from a puzzle pie to a supporting data slide can halve Q&A time by preempting questions.
Slide-by-Slide Spotlight: Building Your Data Story Piece by Piece
This template's 45 slides are grouped into intuitive categories - pure pie breakdowns, 3D puzzle hybrids, and infographic extensions - allowing you to mix and match for any narrative arc. Start with basics and layer in complexity as your story unfolds.
Slides 1-15 focus on foundational pie charts with subtle puzzle accents: Think a 360-degree view of market share where segments lock like jigsaw pieces, highlighting synergies between competitors. I've customized these for a retail client's seasonal analysis, animating the "lock" to show how promotions bridge sales gaps.
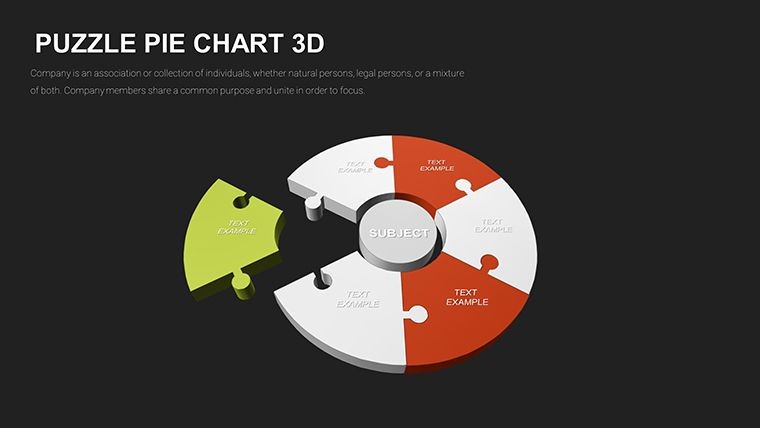
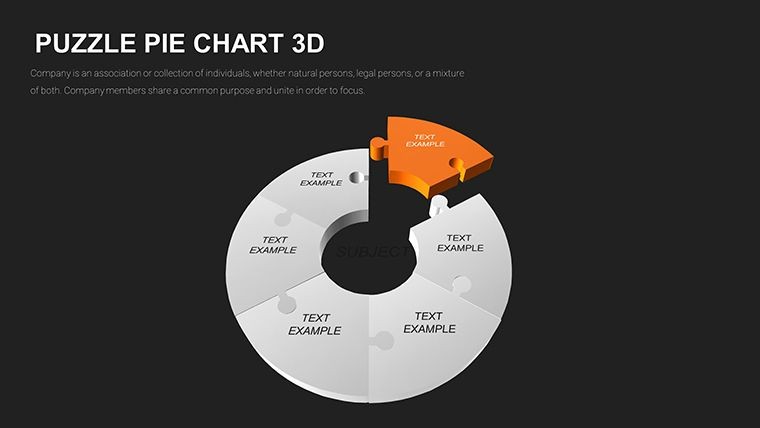
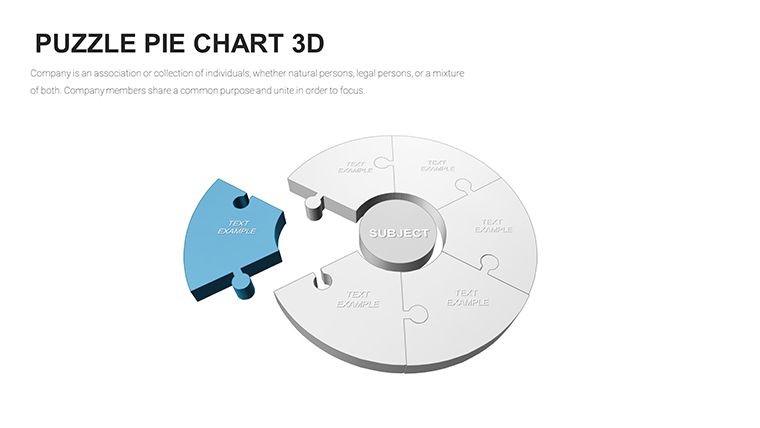
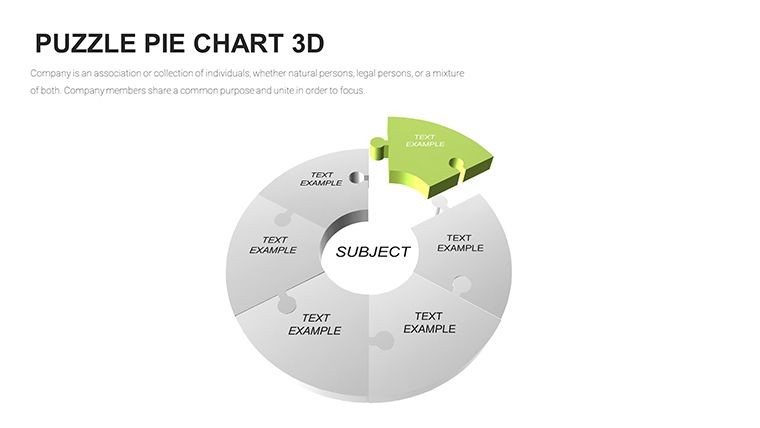
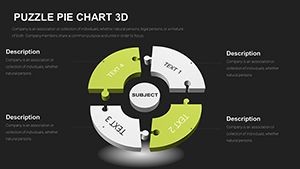
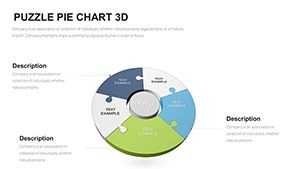
Moving to slides 16-30, the 3D depth ramps up. Here, puzzle pies explode into multi-layered visuals - perfect for funnel metrics where drop-off points interlink with recovery strategies. One slide I favor features a central pie orbiting satellite puzzles, ideal for ecosystem mappings in supply chain talks.
The final 15 slides elevate to infographic territory: Masked pies shaped like gears or networks, infused with icons and timelines. Use these for wrap-up slides that tie quarterly results back to annual goals, with hyperlinks drilling into specifics. In a recent education workshop, I deployed a biodiversity-themed puzzle pie to illustrate curriculum interconnections, making abstract concepts click for teachers.
Editing is straightforward: Paste your data from Numbers or Excel, and the charts auto-adjust. Add transitions via Keynote's inspector, and you're set for rehearsals that feel polished from minute one.
Where Professionals Deploy This Template: From Boardrooms to Classrooms
In my career spanning marketing agencies, consulting firms, and even nonprofit boards, I've witnessed how specialized visuals like these shift conversations. This template shines in environments where data isn't isolated - it's relational.
For marketing directors, it's a go-to for campaign deconstructions. Picture slicing ad spend across platforms, with puzzle edges showing cross-pollination effects - like how social boosts email open rates. In 2024's fragmented media landscape, these slides helped a client reallocate budgets mid-quarter, spotting untapped synergies.
Consultants in strategy roles use it to untangle client dependencies. During a merger advisory, I mapped value propositions as interlocking pies, where each slice's edge denoted regulatory ties. The 3D perspective made risks pop, turning a dense report into a strategic conversation starter.
Educators and trainers find it invaluable for layered learning. A university professor I collaborated with used puzzle pies to dissect historical events, with segments as eras and locks as causal links - boosting student retention through visual metaphors that stick.
Even startup founders pitching VCs leverage it for traction slides. Show user demographics as a pie, with puzzle extensions to growth hacks, and watch investor eyes light up at the interconnected momentum.
Across industries - from finance tracking ROI webs to healthcare outlining patient journey overlaps - this template adapts without losing its core punch. It's the tool that makes your expertise visible, not just audible.
Seamless Workflow Integration: From Data Import to Deck Delivery
Integrating this template into your process is as intuitive as its design. Start by opening in Keynote; the native .key file loads instantly. Import CSV data from tools like Google Sheets or Numbers, and watch slices populate automatically - no manual resizing required.
For teams, share via iCloud or AirDrop, preserving animations across Macs. Export finals as MOV for video briefs or PDF for handouts, with full fidelity. I've streamlined my workflow by templating recurring reports: Swap data quarterly, tweak colors seasonally, and hit "present" with confidence.
Pro tip: Layer in Pages for executive summaries, pulling charts directly. This closed-loop ecosystem - Keynote, Numbers, Pages - means less app-switching, more focus on insights. In fast-paced 2025 hybrid meetings, that efficiency translates to sharper, more responsive sessions.
Real Presentation Examples: Lessons from the Front Lines
Let me share a few scenarios where this template turned good decks into great ones. As a fractional CMO for a SaaS firm, I faced a skeptical sales team doubting channel attribution. Using a central puzzle pie for traffic sources, with 3D edges linking to conversion paths, the slide sparked a 20-minute brainstorm - far more productive than bullet-point drudgery.
In a consulting gig for a logistics giant, regulatory compliance was the beast. I crafted a multi-pie puzzle showing policy intersections across regions; the interlocking visuals clarified overlaps, saving hours in legal reviews. The client requested the file for internal training - high praise in my book.
For an edtech founder pitching accelerators, we visualized user engagement as habitat pies with biodiversity puzzles. Animating the locks to reveal retention drivers made the demo unforgettable, securing a follow-up roundtable.
These aren't hypotheticals; they're the outcomes of templates like this one, where design serves strategy. If you're prepping for that pivotal quarterly or workshop, consider how interconnected visuals could unlock your next breakthrough.
Comparison: Elevating Beyond Default Tools
| Aspect | Default Keynote Charts | This 3D Puzzle Pie Template | Other Alternatives (e.g., Canva Templates) |
|---|---|---|---|
| Visual Depth | Flat 2D pies; basic segments | 3D puzzle interlocks for relational emphasis | Static graphics; limited Keynote export fidelity |
| Customization Ease | Manual reshaping; no auto-interconnect | Drag-and-drop with native animations | Web-based edits; conversion losses to .key |
| Slide Variety | 10-15 stock options | 45 editable, themed infographics | Generic packs; fewer interactive builds |
| Data Integration | Basic table pastes | CSV auto-updates; Numbers sync | Manual uploads; no seamless Apple ecosystem |
| Engagement Tools | Simple fades | Hyperlinks, phased reveals, high-res exports | Embedded videos; but clunky on stage |
This table underscores why I reach for specialized templates over defaults - they amplify Keynote's strengths without the grind. Compared to web-based options, the native format ensures buttery-smooth rehearsals, crucial for live demos.
Use Cases Across Industries: Tailored Impact
Finance pros chart portfolio diversifications, with puzzle edges tracing risk correlations. In healthcare, map treatment efficacies where slices interlink patient outcomes. Nonprofits visualize donor impact chains, turning abstract metrics into compelling grant narratives.
For product managers, it's gold for feature prioritization - pies of user feedback locked to roadmap timelines. HR leaders dissect talent pipelines, highlighting skill gaps as missing puzzle pieces. The versatility stems from its modular build: Swap themes, data, and voila - a fresh tool for any sector's storytelling needs.
Ready to piece together your data's full picture? This template awaits in your cart, primed for your next deck.
Frequently Asked Questions
Is this template fully editable in Keynote?
Yes, every element - from slices to animations - is customizable via Keynote's standard tools, ensuring you maintain full creative control without external software.
Does it support data imports from Excel?
Absolutely; copy-paste from Excel or import CSV files directly, with charts updating in real-time for dynamic presentations.
Are the 3D effects hardware-intensive?
No, optimized for standard Mac hardware (2016+ models), rendering smoothly even on battery during travel pitches.
Can I use this for Google Slides or PowerPoint?
It's native to Keynote, but export to PDF or images works for cross-platform sharing; for full interactivity, stick to Apple ecosystem.
What if my team needs multiple licenses?
One-time purchase grants lifetime use for the buyer; for teams, contact support for bulk options tailored to your size.
How often does the template receive updates?
Annual refreshes with new effects and compatibility tweaks are included at no extra cost, keeping your visuals current through 2025 and beyond.