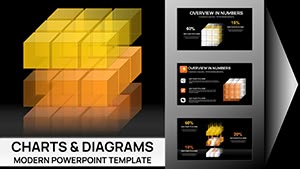
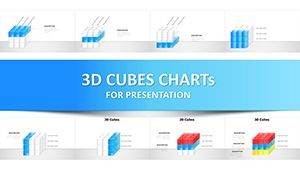
3D Cube Infographics Keynote Template - 42 Fully Editable Charts | Instant Download


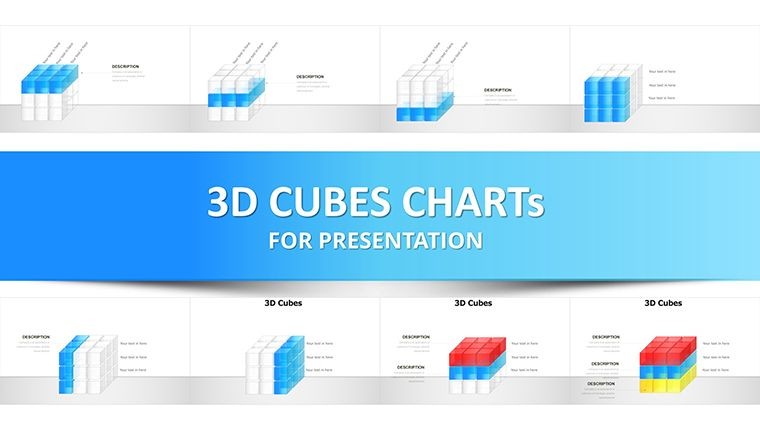


Bring depth to your data with the 3D Cube Infographics Keynote Template. With 42 customizable slides, create immersive infographics for Keynote that make complex information easy to understand. Instant download for professional business and marketing presentations.
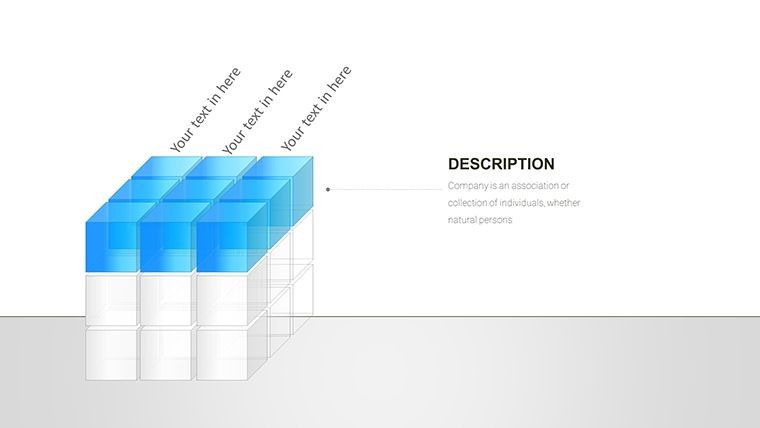
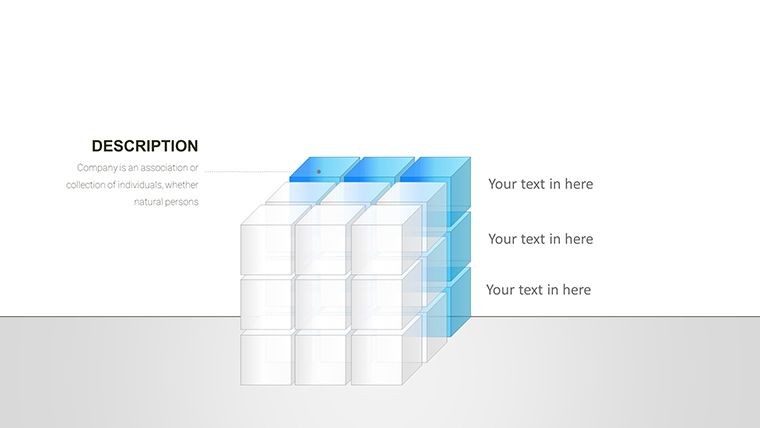
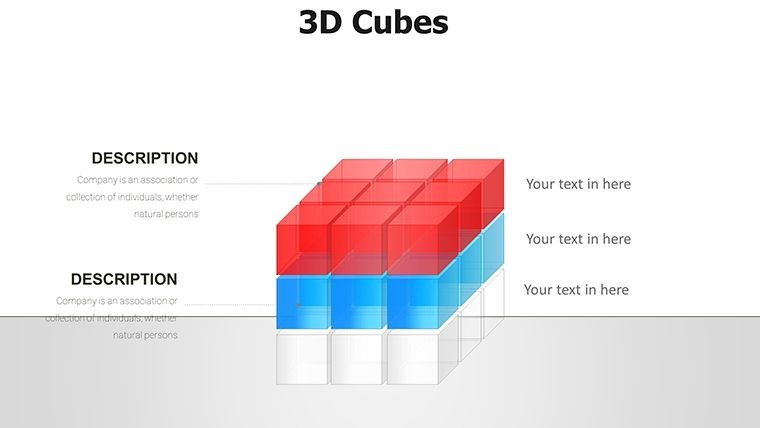
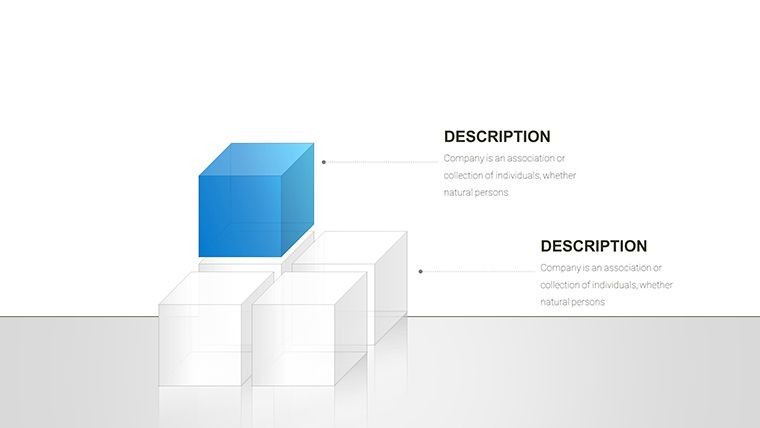
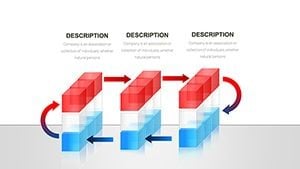
Add dimension and visual impact to your data narratives with the 3D Cube Infographics for Keynote. This template with 42 editable slides enables you to present information in a modern, engaging format that helps audiences quickly grasp key insights.
Benefits of 3D Cube Infographics
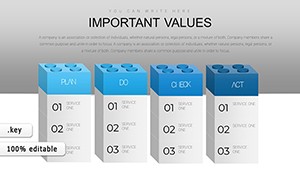
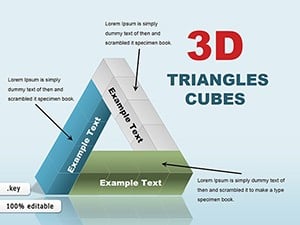
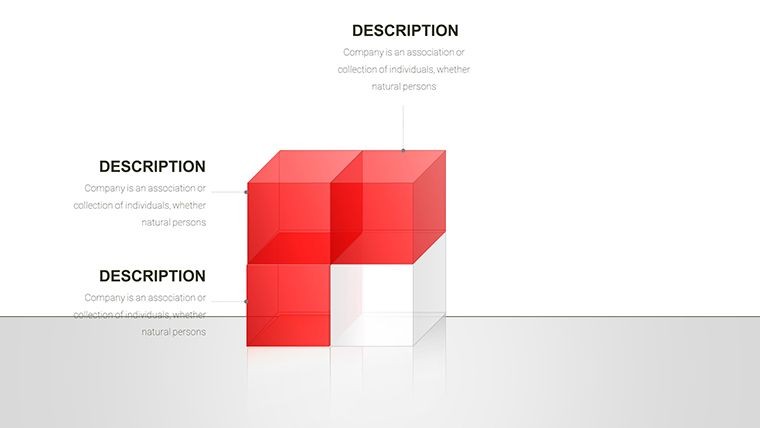
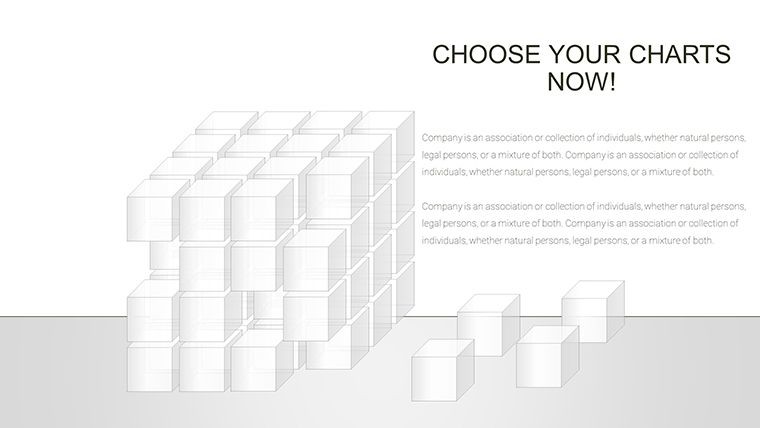
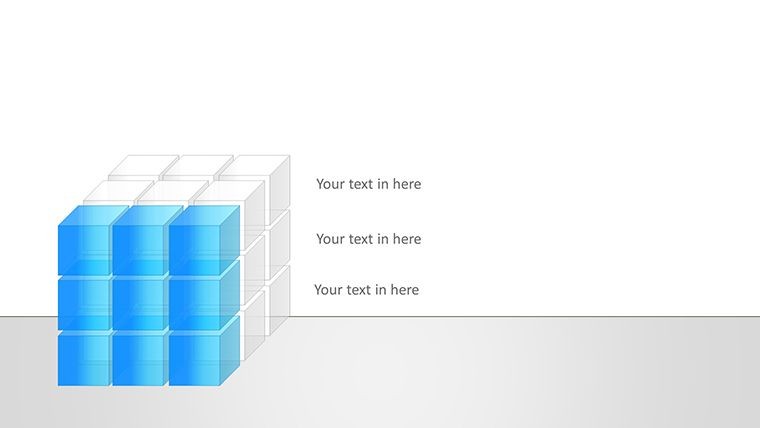
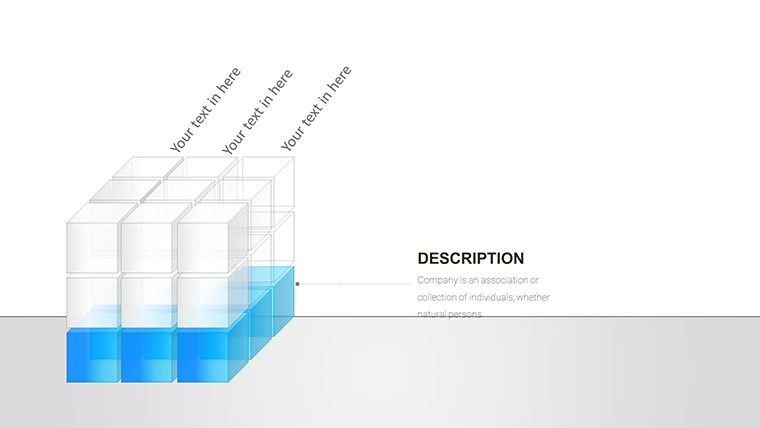
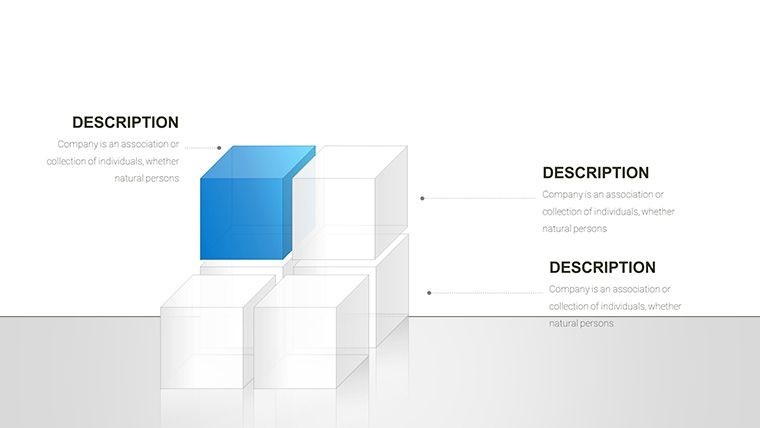
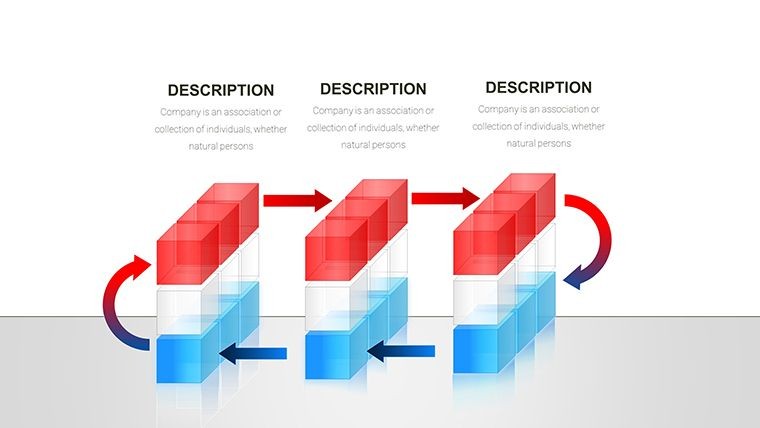
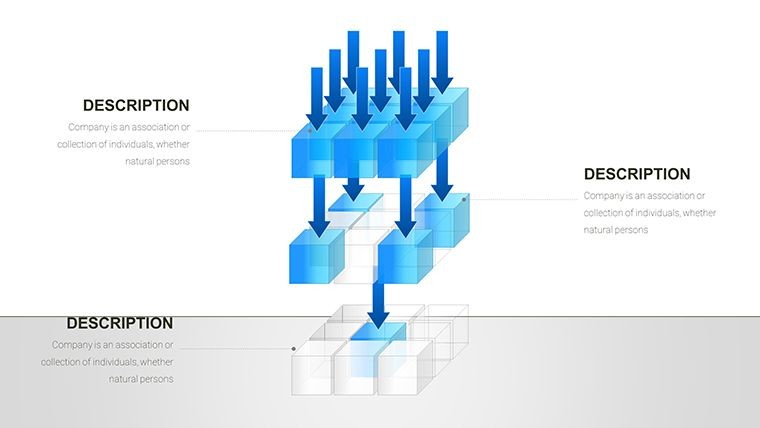
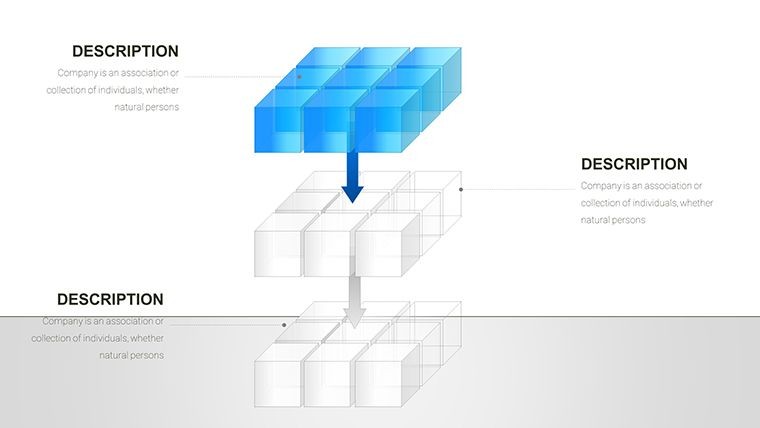
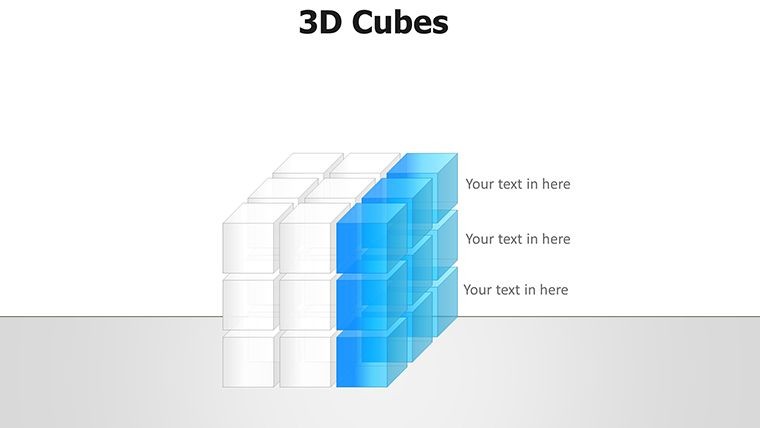
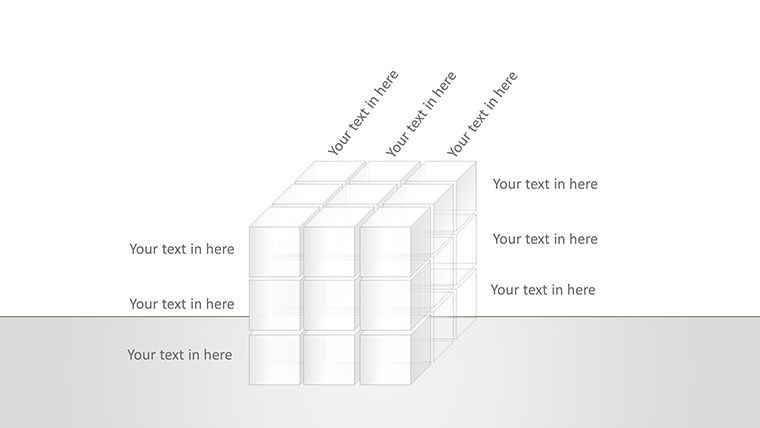
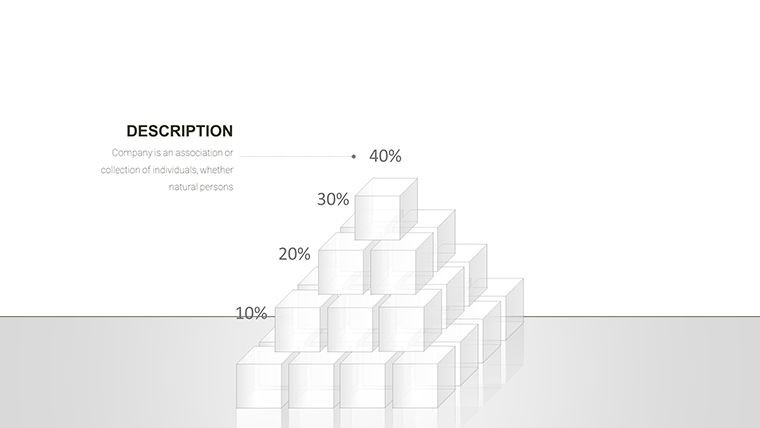
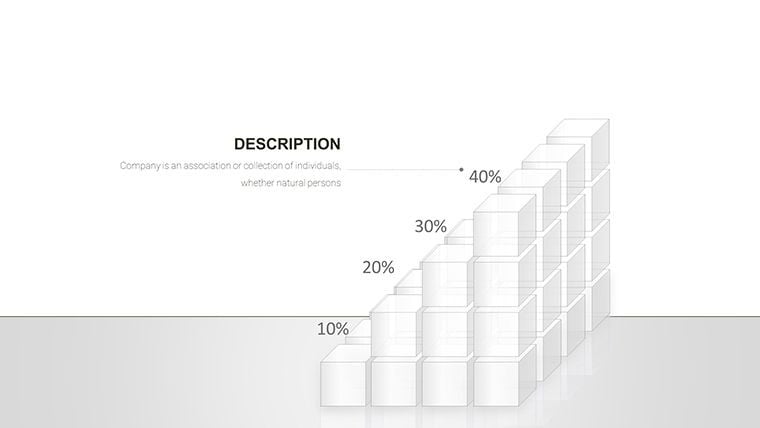
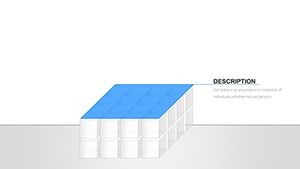
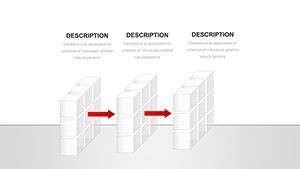
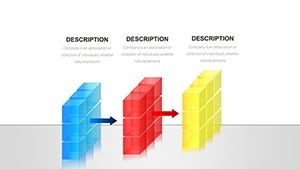
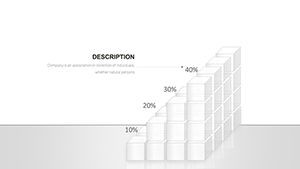
3D designs help break through presentation fatigue by offering a fresh perspective on data. Cubes allow for effective representation of multiple data layers or categories in a single visual. This leads to better retention and more productive discussions.
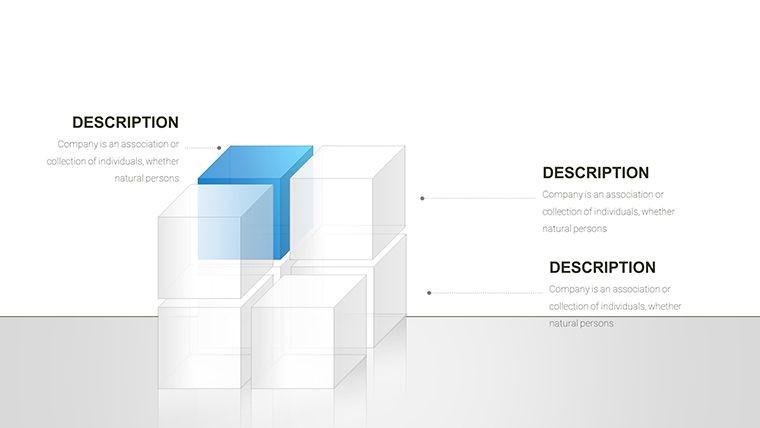
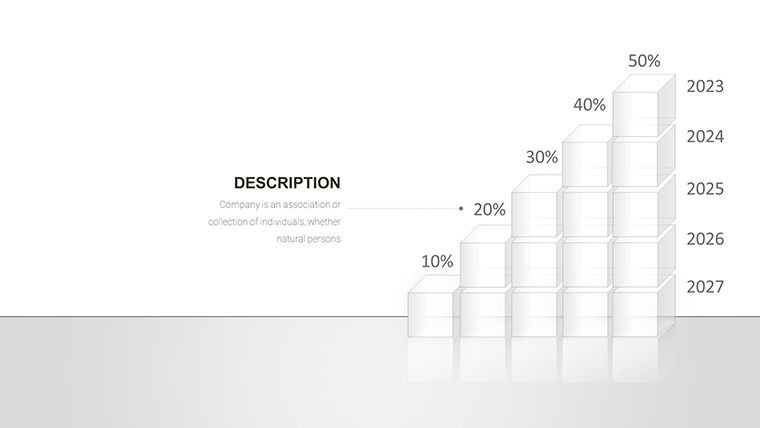
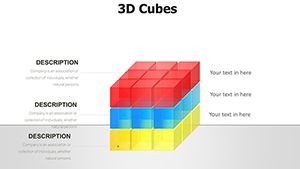
Sales teams can use them to visualize quarterly figures, researchers to map trends, and executives to review company performance. Consultants present strategy recommendations with clarity. Internal operations teams track multi-faceted metrics in one glance. The sophisticated look elevates the perceived quality of your entire presentation.
How to Use These Infographics in Keynote
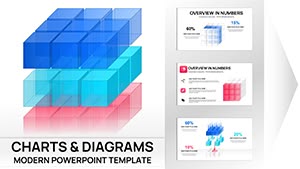
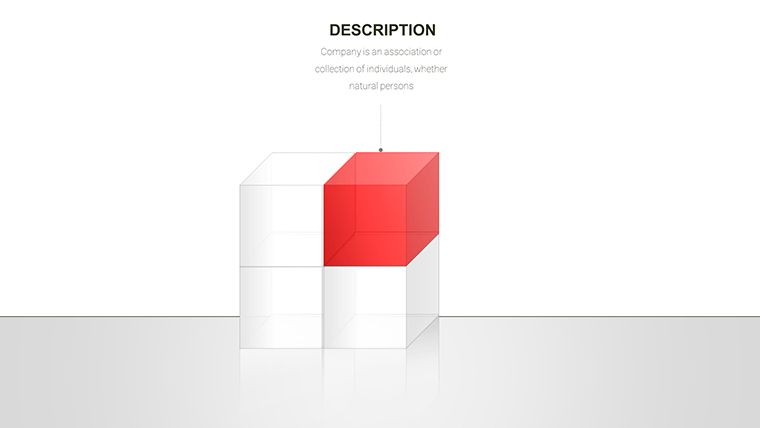
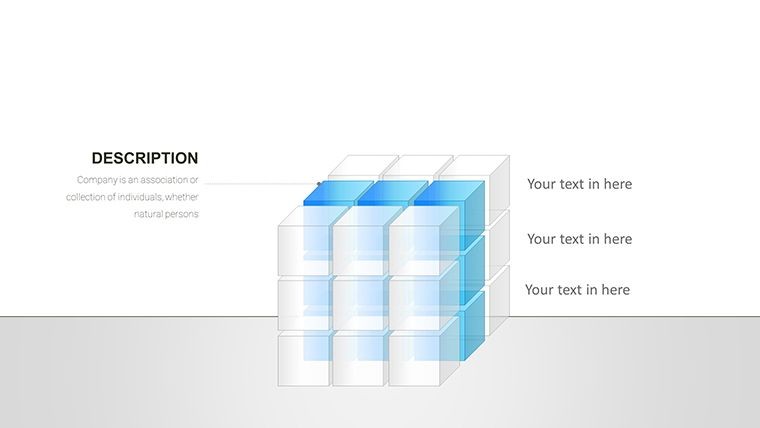
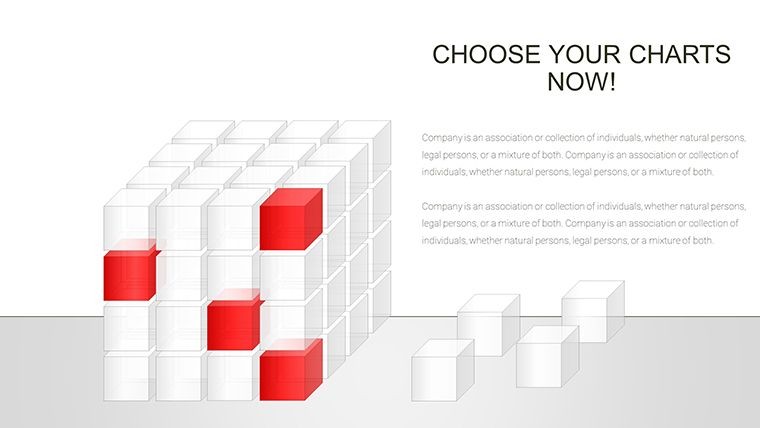
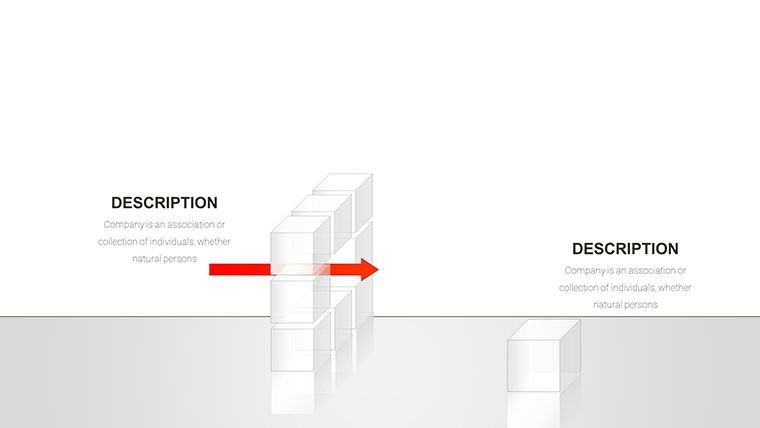
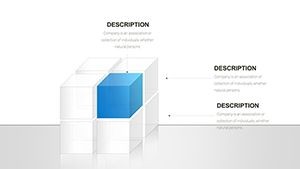
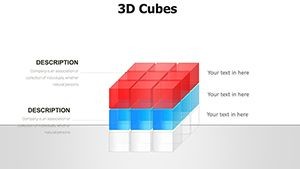
Download the template instantly and open it in Keynote. Customize each infographic slide by updating the data points, adjusting cube rotations and colors, and replacing text placeholders. The drag-and-drop functionality makes it fast and intuitive even for non-designers.
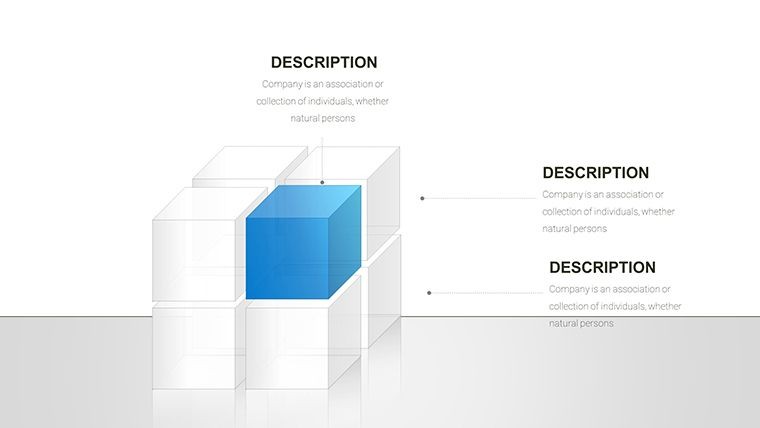
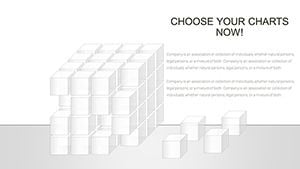
Choose from multiple color schemes to align with your corporate identity or presentation theme. Integrate with existing slides effortlessly. Finish professional decks in minutes without starting from scratch.
Key Features
Includes 42 editable slides with diverse 3D cube infographic layouts. Fully compatible with Apple Keynote, with easy text integration and professional design elements ready for immediate use.
Frequently Asked Questions
How many slides are in the 3D Cube Infographics Keynote Template?
The template includes 42 fully customizable slides.
Are the infographics easy to edit in Keynote?
Yes, they feature drag-and-drop simplicity with editable text, colors, and data placeholders.
What scenarios are best suited for these cube infographics?
Perfect for sales reports, market research, internal operations reviews, and client presentations.
Does it include multiple color schemes?
Yes, the template provides several built-in color variations that you can easily apply or modify.