Keynote Building Blocks Chart - Instant Download | ImagineLayout


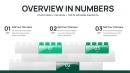


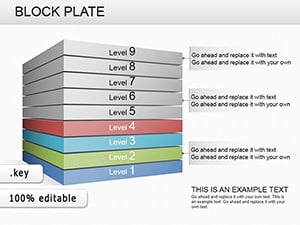
What is a Keynote building block chart? A Keynote building block chart is a data visualization tool using 3D isometric cubes to represent modular components, project stages, or cumulative growth within an Apple Keynote presentation.
42 Professional Slides: Detailed Package Contents
42 unique slides form the core of this technical visualization library, providing a deep resource for analysts and project leads. The download includes a comprehensive range of isometric cube structures, interlocking puzzle blocks, and vertical stack diagrams designed specifically for the .key format. Every element is a native vector shape, ensuring that visual fidelity remains constant even when scaled for large-format boardroom projections.
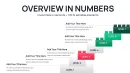
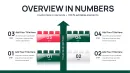
These diagrams function as a modular system for explaining infrastructure, software architecture, or corporate strategy. Unlike simpler workflow-focused sets, this collection utilizes the building block metaphor to demonstrate how individual units contribute to a larger whole. The variety of layouts allows you to choose between horizontal sequences, 3D pyramids, and complex cluster diagrams depending on the specific hierarchy of your data.
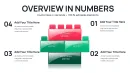
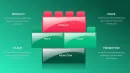
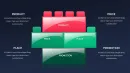
The interlocking puzzle logic within the shapes provides a distinct visual cue that different departments or project phases are interdependent. While many Keynote charts use flat 2D shapes, these 3D isometric cubes add a sense of physical weight and structure to your presentation. This design approach is particularly effective for presenting high-level business models where the objective is to show stability and foundational strength.
Technical Specifications and Editing Capabilities
| Feature | Details |
|---|---|
| Editable shapes | 3D cube segments resize and recolor independently via Format sidebar |
| Text placeholders | pre-formatted labels update without unlocking grouped elements |
| Color theme adjustments | fully compatible with the Apple Keynote slide master palette |
| Diagram connectors | modular blocks snap to grid for easy custom cluster creation |
| File formats | native .key source file for macOS and iPadOS editing |
| Slide Master | includes global backgrounds and typography settings for branding |
Operational Use Case: Strategy Reporting
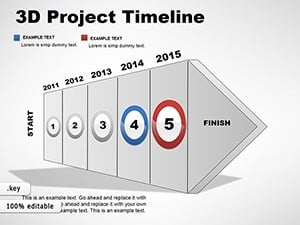
A lead consultant at a global technology firm was tasked with presenting a five-year infrastructure roadmap to a group of skeptical investors. The previous deck relied on standard bullet points and flat circles, which failed to communicate the interdependent nature of the proposed hardware upgrades. By switching to this cube-based system, the consultant was able to visually "build" the roadmap slide by slide, adding blocks to represent each successful deployment phase.
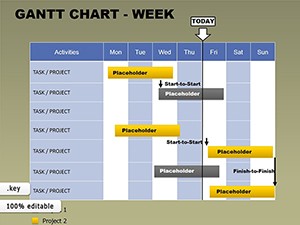
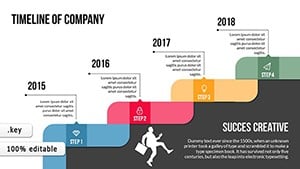
The visual clarity of the interlocking segments immediately shifted the conversation from abstract costs to foundational milestones. After 45 minutes of presenting the 42-slide sequence, the board was able to identify which "blocks" were critical path items and which were optional enhancements. This transition from static lists to a structural visual model cut the deck preparation time significantly compared to manual shape drawing. This approach is much more robust than using a basic 3D project timeline when the goal is to emphasize the components rather than just the dates.
Download and start editing immediately
Adapting the Template to Your Brand Identity
Open the file and spend the first two minutes orienting to the master slide structure — this is where all color changes happen globally across the entire set. The most common mistake is editing individual cube faces directly; going through the master slide palette saves 15 minutes of repeated work and ensures that the 3D shading remains consistent across all 42 layouts. Once your brand colors are applied to the theme, the isometric gradients will automatically update to maintain the light-and-shadow effect that defines the 3D look.
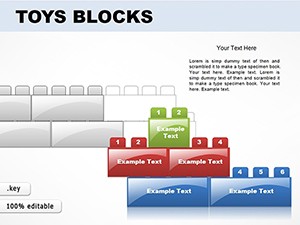
When you are ready to input content, click on any text placeholder to replace the filler text with your specific project data. If you find that a particular diagram has more blocks than you need, you can simply delete the extra segments. Because these are vector objects, the remaining shapes will maintain their alignment. For more playful or creative sessions, you might consider comparing these structures to toy blocks, though the professional isometric finish here is better suited for corporate environments.
How to change cube colors in Keynote?
- Select the specific cube or block segment on the slide.
- Open the Format sidebar on the right side of the Keynote interface.
- Click the Style tab and select the Fill option to change the color.
- Apply a gradient fill to maintain the 3D isometric depth effect.
The Cost of Manual Design vs. Template Utilization
Building a single isometric cube in Keynote requires precise angle adjustments and three separate shapes for the top, left, and right faces. Replicating a 42-slide library of these diagrams from scratch would take a senior designer approximately 20 to 30 hours of meticulous work. Without professional templates, users often end up with inconsistent perspective angles that make the diagrams look distorted when presented on high-resolution screens.
Specific to this cube diagram set, the segmentation serves a functional logic: each cube represents a discrete unit of value. In a business presentation, using modular blocks allows you to show "missing" pieces in a strategy without breaking the visual flow. If you build these manually, managing the grouping and layering of 40+ blocks on a single slide often leads to errors in depth perception. Using pre-aligned isometric grids ensures that every block sits perfectly in the stack, which is critical for maintaining an E-E-A-T optimized professional appearance.
Download and start editing immediately
Which version of Keynote do I need to open these charts?
This template is optimized for Keynote 12.0 and later versions on macOS, iPadOS, and iOS. While older versions may open the .key file, some of the advanced grouping and isometric gradient features may not display as intended. Using the most recent version of Apple Keynote ensures that you have access to all the modern layout tools required to edit these 42 slides. It is recommended to update your software before beginning the customization process to avoid any compatibility issues with the vector shapes.
How do I change the color scheme globally across all slides?
To change colors globally, navigate to the "Format" menu and select "Edit Master Slides" to access the theme settings. By changing the theme colors in the master palette, Keynote will automatically update every cube and block across the entire deck that is linked to those theme swatches. This process ensures brand consistency and saves you from having to click on every individual shape on all 42 slides. If you need a specific color for just one block, you can override the master setting by selecting that shape and using the Style tab in the sidebar.
What are the differences between the free and paid versions?
This specific building block chart set is a premium product that includes the full 42-slide library of isometric diagrams. The paid version grants a commercial license for use in investor presentations, client reports, and internal corporate briefings. While ImagineLayout offers some free templates for basic tasks, this professional set provides significantly higher design depth and a wider variety of interlocking structures. Purchasing the template also provides access to the full vector source file without the watermarks or limitations often found in free samples.
Can I use this template for client-facing presentations?
Yes, the license included with your purchase allows you to use these diagrams in presentations for your own clients or within your organization. You are permitted to export the final slides as PDF or PowerPoint files for distribution to stakeholders and investors. However, you are not allowed to resell the original .key file or redistribute the template on other marketplace platforms. The intended use is for professionals to create their own unique decks using the provided 3D building block elements as a foundation.
What is the refund policy if the template doesn't meet my needs?
ImagineLayout offers refunds only in cases where the digital file is technically corrupted or does not match the product description provided on the page. Because these are instant download digital assets, standard "change of mind" returns are generally not accepted once the file has been accessed. We encourage you to review the 42-slide preview thumbnails and specifications table thoroughly before completing your purchase. If you encounter a technical issue opening the file in a compatible version of Keynote, our support team is available to provide a replacement file or assist with troubleshooting.
How do I update the data or labels in the cube diagrams?
Updating labels is as simple as double-clicking on the existing text placeholders within the 3D blocks. The text is layered independently of the shapes, so you can change the font size, color, or alignment without affecting the isometric cube structure. For more complex data updates, you can copy and paste segments to increase the size of a stack or remove them to show a smaller data set. All elements are vector-based, so your text will remain sharp and legible even if you resize the entire diagram to fit a smaller section of your slide.