3D Pie Keynote Charts - Fully Editable | ImagineLayout

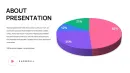


What is a Keynote chart template? A Keynote chart template is a pre-designed KEY file with fully editable graphs and diagrams ready for insertion into business presentations.
Package Contents
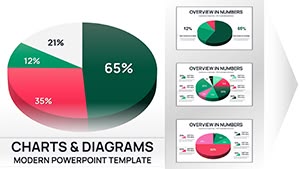
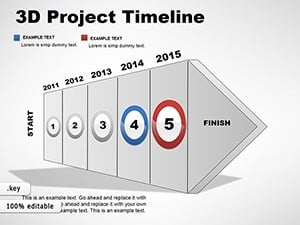
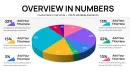
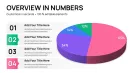
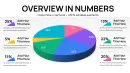
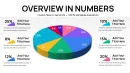
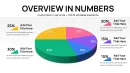
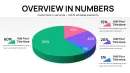
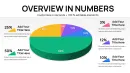
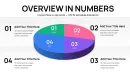
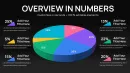
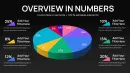
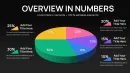
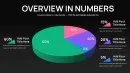
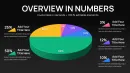
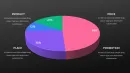
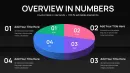
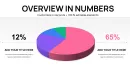
30 editable slides fill the KEY file with 3D pie charts designed for immediate use in data-heavy decks.
Each slide focuses on a different layout variation so multiple data sets combine seamlessly into one cohesive visualization story across the presentation.
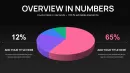
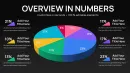
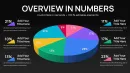
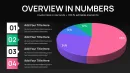
Unlike single-chart layouts this set maintains strict 3D consistency across all slides while color contrast and zone segmentation guide viewer attention without extra effort.
- 30 fully editable 3D pie slides
- Consistent color contrast across variations
- Slide master for global updates
- External data labels for small segments
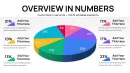
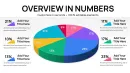
The paid version unlocks the complete 30-slide KEY file with all editable shapes and works best for board meeting data overviews because the pre-built 3D pies allow instant proportional insights.
Teams seeking more options can browse the pie Keynote charts category.
Editing Capabilities at a Glance
| Feature | Details |
|---|---|
| Editable shapes | pie segments resize and recolor independently |
| Text placeholders | labels update without unlocking grouped elements |
| Color theme adjustments | compatible with Keynote slide master palette |
| Data label positioning | external placement keeps readability for small segments under 10 percent |
| Keynote compatibility | Keynote 12 or later with full 3D rendering support |
| Export options | PDF for distribution while original KEY remains editable |
How do you update chart data in this Keynote chart template? Update chart data by selecting the pie and editing the embedded table which automatically resizes segments and refreshes labels.
- Select the target 3D pie chart on any slide.
- Keynote displays the data spreadsheet automatically.
- Input new values or percentages into the cells.
- Observe live updates to segment sizes and positions.
- Repeat for other slides as needed before exporting.
Real Scenarios
Three hours before a board meeting the slide deck still had no clear proportional breakdown of revenue streams.
A financial analyst at a mid-sized tech firm opened the 3D pie charts template and populated segments with live data.
Alignment and visual hierarchy stayed consistent across every slide.
Deck preparation cut from three hours to 45 minutes with no designer required.
A management consultant faced repeated market share comparisons across five client proposals.
Before the template each pie required manual 3D setup and took hours.
After adoption the same file reused across engagements by swapping only the data values.
Per-session prep reduced from two hours to 20 minutes.
Download and start editing immediately
From Download to Final Deck
The customization process takes under 20 minutes for moderate skill users.
- Open the KEY file in Keynote 12 or later (1 minute).
- Navigate to the slide master to set global color theme adjustments (3 minutes).
- Replace text placeholders on individual slides with your data labels (5 minutes).
- Adjust any segment angles if needed (2 minutes).
- Preview the visual hierarchy and export the final deck (4 minutes).
For complementary data visualization approaches see this chart collection.
Why This Template, Not a Blank Slide
Building equivalent 3D pie charts from scratch demands advanced Keynote skills and at least four hours per slide set.
Common errors include mismatched extrusion depths across segments and broken color contrast that confuses viewers during live briefings.
The template eliminates those issues by delivering pre-aligned elements that maintain information spacing no matter how often data changes.
Heavier extruded segments read as larger before the audience reads any label which helps executives grasp key takeaways in under 10 seconds.
Similar setups appear in related 3D options but this set prioritizes board-ready depth.
Download and start editing immediately
Frequently Asked Questions
What Keynote versions are compatible with this 3D pie chart template?
This 3D pie chart template works in Keynote 12 or later on macOS. Earlier versions may open the file but lose full 3D rendering support and shadow effects. Always update Keynote through the App Store before importing the KEY file to ensure every segment displays correctly. Test the first slide after opening to confirm data labels and extrusion depths render as designed.
How do you change the color scheme in this Keynote chart template?
Access the slide master by choosing View then Master Slides in Keynote. Select any pie chart element on the master to update the global color palette which applies to all 30 slides at once. Enter custom hex values for brand colors if the seven presets do not match. Individual slide overrides remain possible for specific segments without affecting the master theme.
What license terms apply to this template?
The license allows use in internal business presentations and paid client work. You may modify and distribute the final exported decks freely. Sharing the original KEY source file with unlicensed users is not permitted. Multiple team members require separate licenses unless the enterprise option is purchased.
What are the differences between the free and paid versions of this template?
The paid version priced at 15 dollars includes the complete 30-slide KEY file with all editable 3D pie elements. Free previews provide only static JPG exports or watermarked samples for evaluation. Paid buyers receive unlimited personal and commercial edits without additional fees. The full file supports slide master changes and data updates that previews cannot.
What is the refund policy for this template purchase?
Refunds are available within 14 days of purchase if the file does not open in your Keynote version. Contact support with proof of compatibility issues to process the request quickly. Refunds do not apply after the KEY file has been downloaded and edited. The policy protects buyers while preventing abuse of the editable content.
How do you update chart data and edit data labels?
Open any slide and click the pie chart to reveal the data editor table in Keynote. Modify the percentage or value cells directly to resize segments automatically. Data labels update in real time with external positioning for small slices. Save the file and the changes propagate without manual realignment of any visual elements.
How do you export the presentation for different destinations?
Choose File then Export To then PDF to create a distribution version that preserves 3D effects. For live delivery simply present from the original KEY file in Keynote. PowerPoint export is possible but may flatten 3D to 2D so test first. Web upload works best after PDF conversion for consistent rendering across devices.