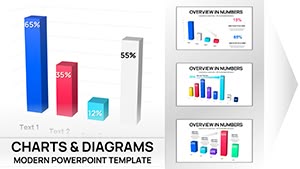
Clustered Column Keynote Charts Template - Fully Editable | Instant Download


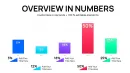


The Clustered Column Keynote Charts Template delivers 46 fully editable slides in native Apple Keynote format for instant business data comparison. Customize every graph slide with your numbers and colors. Download now and create professional presentations that highlight side-by-side metrics clearly and effectively.
What's Included
The Clustered Column Keynote Charts Template includes exactly 46 editable slides in a single .key file format designed exclusively for Apple Keynote. This product with ID 14197 is categorized under Keynote Charts and comes at the price of $10.00. Every slide features clustered column graphs built for business presentations where direct comparison of multiple data series is required. The template provides all necessary placeholders for data values legends and titles so you can open the file and begin editing immediately after instant download. No additional files or components are supplied ensuring focused compatibility with Keynote on Mac devices. The 46 slides give you extensive layout choices for different comparison scenarios without any repetition in design structure.
Template File and Category Details
Sources available are limited to the .key file confirming pure Keynote optimization. The category placement as Keynote Charts aligns perfectly with users seeking graph slides for professional use. This setup means the template is ready for any business presentation requiring clustered column visuals right out of the box.
Key Features
Key features of the Clustered Column Keynote Charts Template revolve around the 46 editable slides that support complete modification of all graph elements in Apple Keynote. You can adjust column colors data series and axis labels on every slide to match your exact business presentation needs. The clustered column layout itself is the core differentiator allowing multiple series to appear side by side for instant visual comparison which is not the case in related organization or stacked volume templates on the site. All slides maintain uniform styling across the deck for a cohesive professional appearance. The editable nature extends to text placeholders ensuring full control without external tools.
Customization Depth
With 46 slides the template offers variety in clustered column configurations so you never run out of options for complex datasets. This level of built-in flexibility sets it apart from simpler chart packs and directly supports business presentations where data accuracy and clarity matter most.
Professional Use Cases
A regional sales director at a logistics company opened the Clustered Column Keynote Charts Template and used one of the 46 slides to compare quarterly revenue across four product lines and three geographic markets in a single view. The side-by-side columns made growth differences obvious leading the board to approve an immediate expansion budget within the same meeting. A marketing manager in the retail sector selected multiple slides from the set to track campaign performance metrics across digital channels and traditional media resulting in a reallocation of advertising spend that increased ROI by focusing on the top performing categories. A project manager in the technology industry applied the template during stakeholder reviews where clustered columns displayed task completion percentages across five teams and four project phases allowing early identification of delays and successful on-time delivery of the overall initiative. These real-world examples show how the editable graph slides turn raw numbers into clear decision-making tools for business presentations.
Industry Specific Applications
Each use case leverages the 46 slides to address specific comparison needs that generic Keynote tools cannot deliver as quickly or professionally.
How to Customize
To customize the Clustered Column Keynote Charts Template download the .key file and open it directly in Apple Keynote. Select any of the 46 slides then double-click the clustered column graph to access the chart data editor and replace all placeholder values with your actual business data series. Next use the format panel to change column fill colors axis scales and legend text to align with your company branding or presentation theme. Update any remaining text placeholders for slide titles and footnotes to reflect the exact context of your business presentation. Finally preview the animations and transitions if desired before exporting the finished deck as PDF or sharing via Keynote. This entire workflow takes only minutes yet produces results that look custom-built from the ground up.
Detailed Editing Workflow
The process works seamlessly because the template is native to Keynote and every element in the 46 slides responds instantly to standard editing commands. No learning curve is involved beyond basic software familiarity.
Why Choose This Template
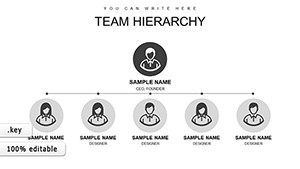
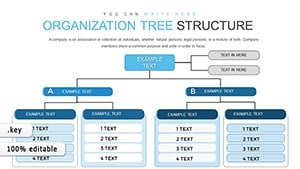
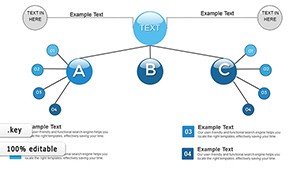
You should choose the Clustered Column Keynote Charts Template because its 46 editable slides deliver ready-made clustered column graphs that save hours compared to creating similar visuals from scratch in Keynote. The specific clustered design choice allows audiences to compare data series at a glance which improves comprehension during business presentations far beyond what default chart tools offer. Unlike the hierarchy organizational or stacked volume templates listed in the related section on the page this one focuses purely on side-by-side comparison making it the precise match for data-driven meetings. The full editability of colors data and text ensures the final output matches your branding perfectly every time. The native .key format and business presentation focus further reduce preparation time while increasing visual impact for any Mac user.
Time and Quality Comparison
Building equivalent clustered column charts manually would require designing axes series and labels on each slide separately whereas this template provides 46 pre-optimized versions ready for data insertion only.
| Feature | Details |
|---|---|
| Number of Slides | 46 editable clustered column graphs |
| File Format | .key native Apple Keynote |
| Product ID | 14197 |
| Price | $10.00 |
| Category | Keynote Charts |
| Customization | Full control over data colors labels |
| Platform | Apple Keynote only |
Ready to transform your business presentations with precise clustered column comparisons? Download the template today and start creating immediately.
Is this Clustered Column Keynote Charts Template compatible with the latest version of Apple Keynote?
Yes the template with 46 editable slides opens perfectly in the most recent Apple Keynote releases on Mac. The .key file uses standard chart structures that Keynote recognizes instantly so no conversion or compatibility issues arise. You can edit clustered column data colors and labels using the built-in tools without any add-ons. This compatibility has been maintained across multiple Keynote updates ensuring long-term usability for all business presentations. The native format also preserves all 46 slide layouts exactly as intended during any future software upgrades.
How do I edit the data in the clustered column graphs?
Editing data is simple and takes seconds per slide. Open the .key file in Keynote select one of the 46 slides and double-click any clustered column chart to launch the data editor window. Replace the sample numbers with your business metrics for each series and category then close the editor to see live updates. You can add or remove series directly in this interface while keeping the clustered layout intact. This method works identically on every slide so your entire presentation stays consistent. No external spreadsheet import is required although you can copy-paste values if preferred.
What licensing is included with this Keynote template?
The licensing permits personal and commercial use in unlimited business presentations after purchase of the Clustered Column Keynote Charts Template. You may use the 46 editable slides in client work or internal company decks without additional fees. Redistribution or resale of the original .key file itself is not allowed but finished exported presentations are fully yours. This standard commercial license covers all typical professional scenarios including conferences and board meetings. The terms are clearly designed to support business users who need reliable graph slides on a regular basis.
Can I change the colors and style to match my brand?
Yes full color and style customization is available on every one of the 46 slides. After opening the .key file in Keynote select a clustered column and open the format panel to pick any color from your brand palette for fills strokes and text. You can also adjust fonts line weights and legend positions to achieve exact visual consistency across your business presentation. These changes apply instantly and remain saved when you export the deck. The template was built with this flexibility in mind so branding alignment requires no advanced design skills.
What happens after I click instant download?
After purchase and instant download you receive the .key file directly to your device. Unzip if necessary then double-click to open in Apple Keynote where the 46 editable slides load immediately. You can begin replacing data in the clustered column graphs right away for your business presentation. The file size is small for fast handling and no account login is required post-purchase. All future updates to the template if released are available to verified buyers through the original purchase link.