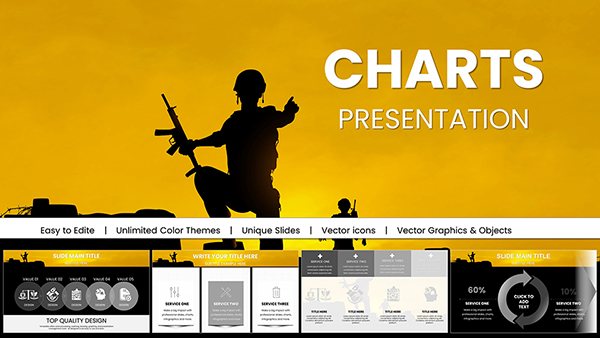
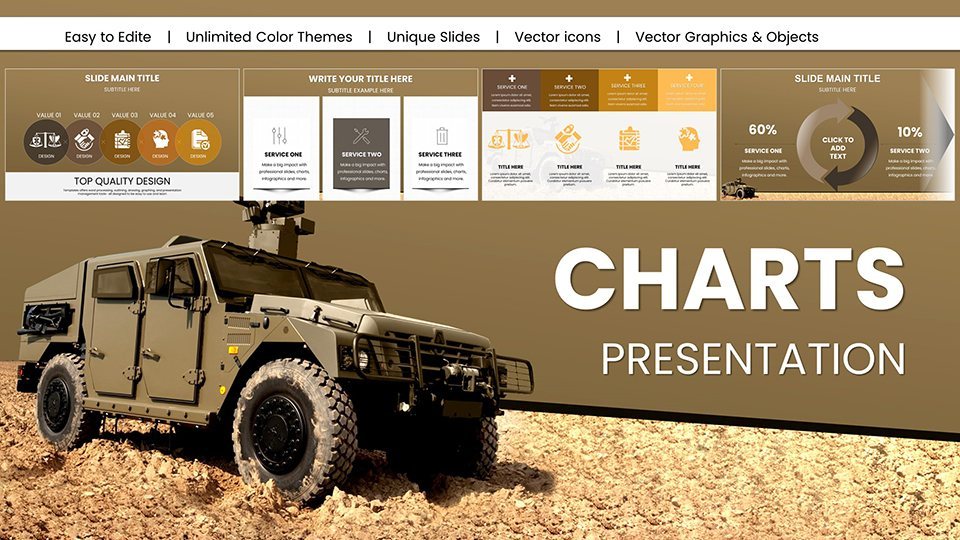
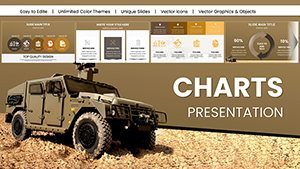
Military Vehicle Keynote Charts Presentation: Elevate Your Defense Strategies


Type: Keynote Charts template
Category: Process, Organizational, Illustrations
Sources Available: .key
Product ID: KC01008
Template incl.: 59 editable slides
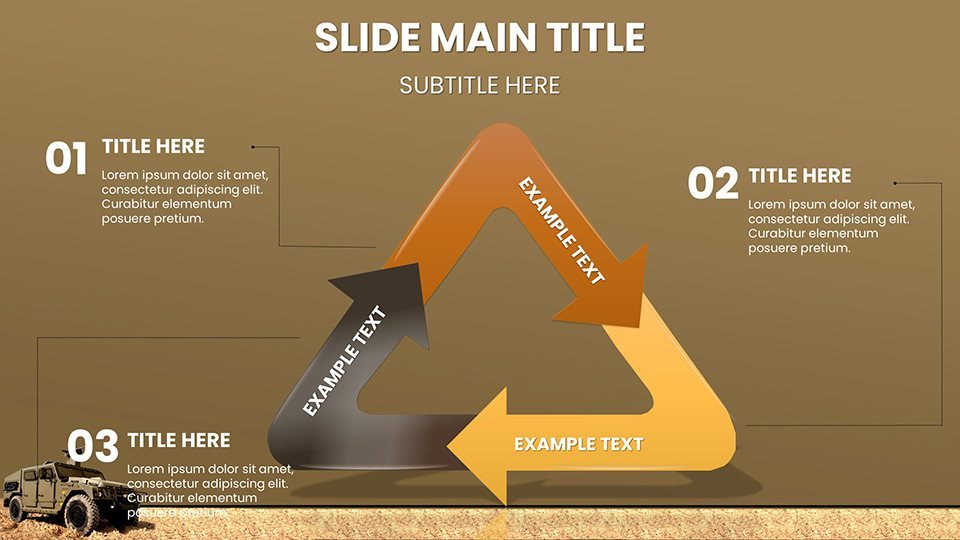
In the high-stakes world of military operations and defense technology, conveying complex data with clarity and impact is non-negotiable. Imagine transforming raw intelligence into compelling narratives that captivate commanders, analysts, and stakeholders alike. Our Military Vehicle Keynote Charts Presentation template is your secret weapon, offering 59 fully editable slides tailored for military professionals. Whether you're briefing on armored vehicle deployments, analyzing tank performance metrics, or forecasting drone fleet expansions, this template empowers you to present with precision and authority.
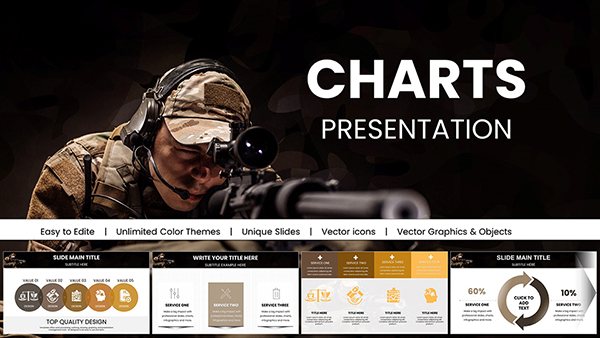
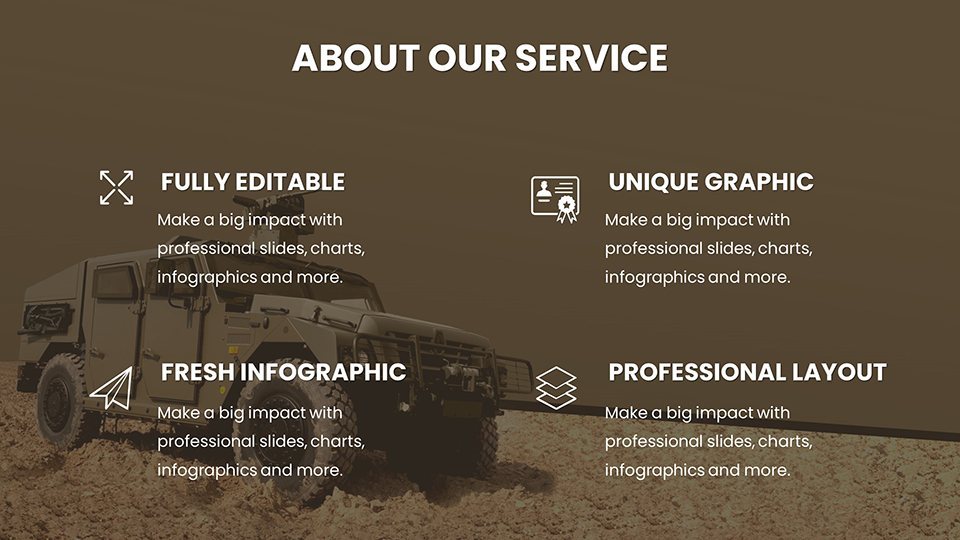
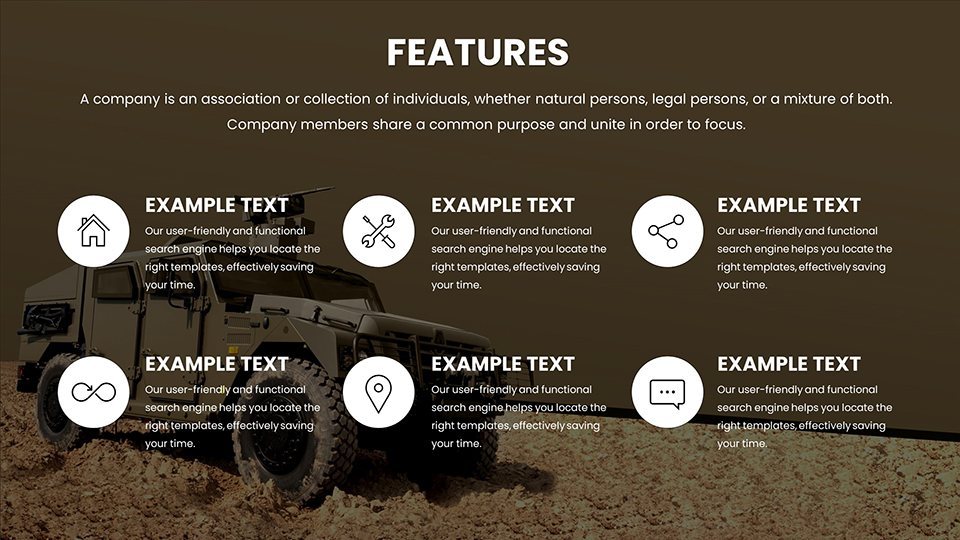
Designed with input from defense industry veterans, this template draws on real-world applications like those seen in Pentagon briefings or NATO exercises. It integrates seamlessly with Apple's Keynote software, ensuring smooth compatibility across macOS and iOS devices. No more wrestling with mismatched formats or clunky visuals - dive straight into customization to align with your unit's branding or mission objectives. The slides feature high-resolution graphics of military vehicles, from Humvees to advanced unmanned systems, rendered in tactical color schemes that evoke professionalism and urgency.
Key Features That Set This Template Apart
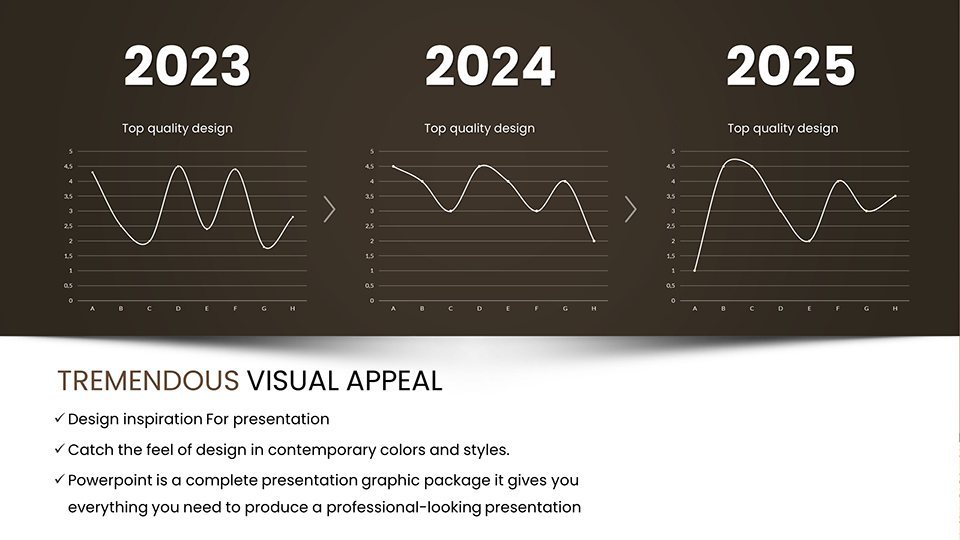
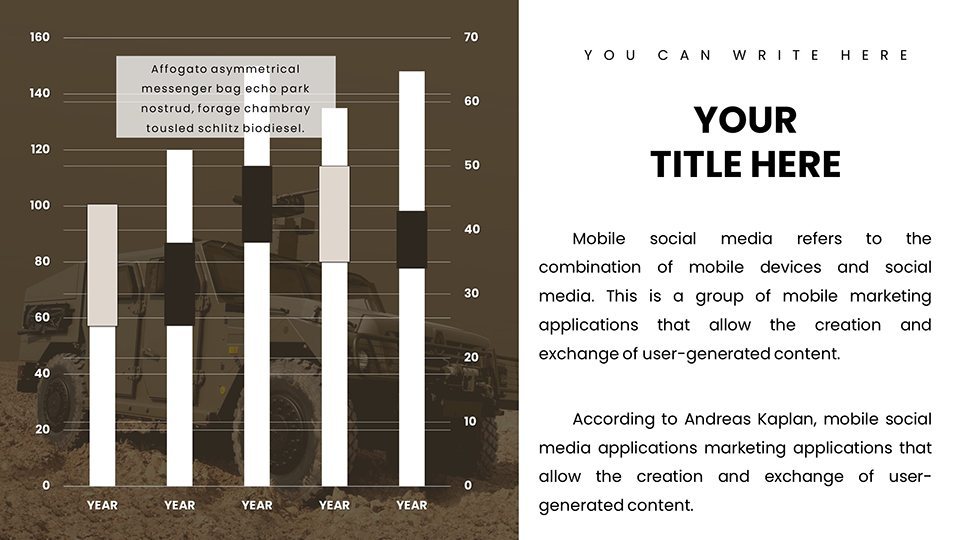
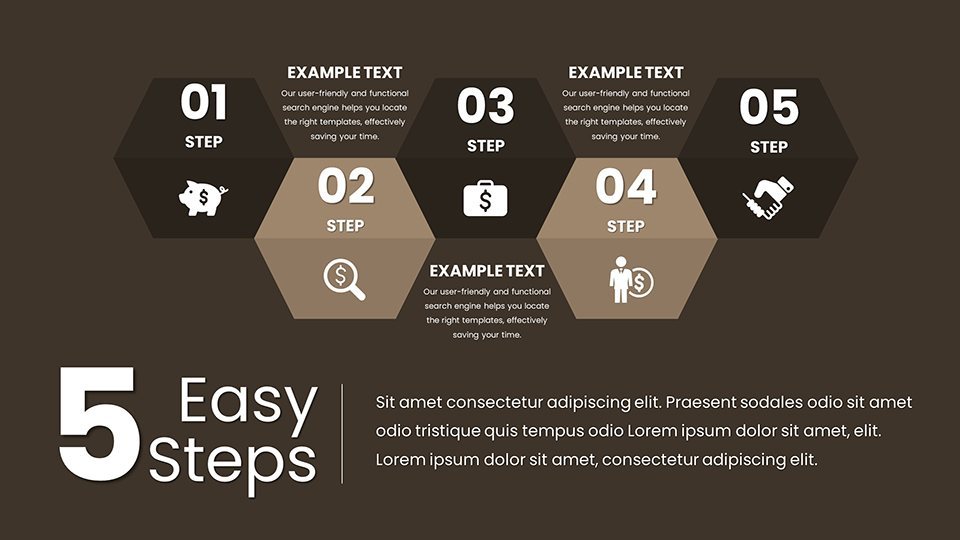
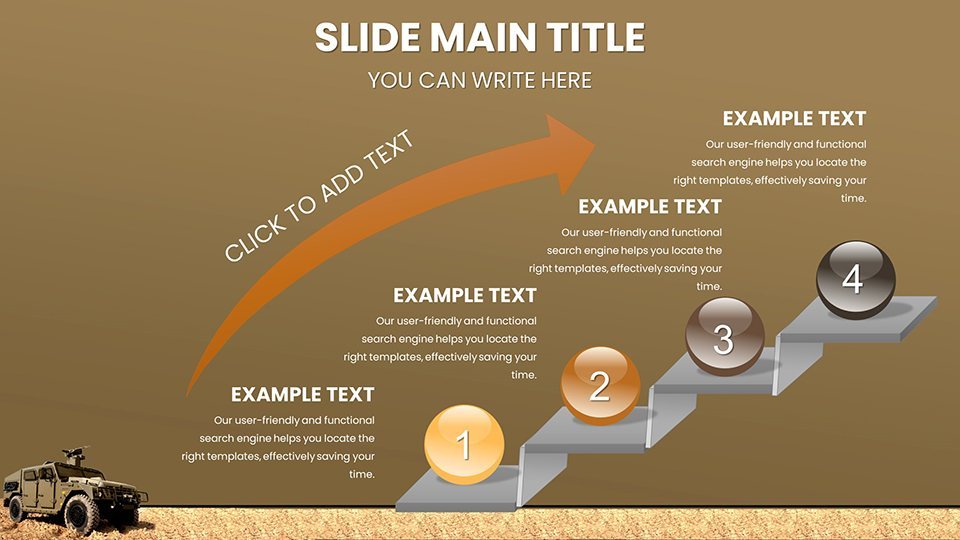
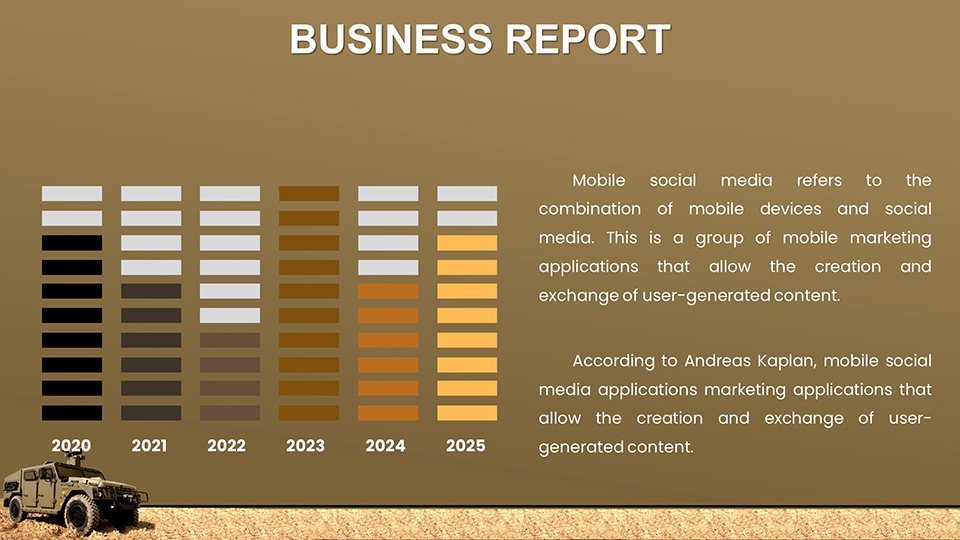
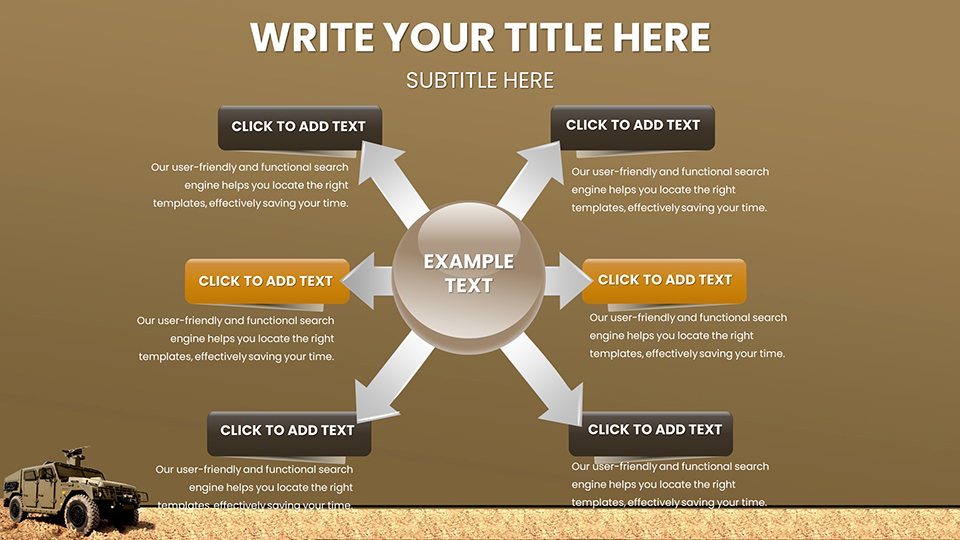
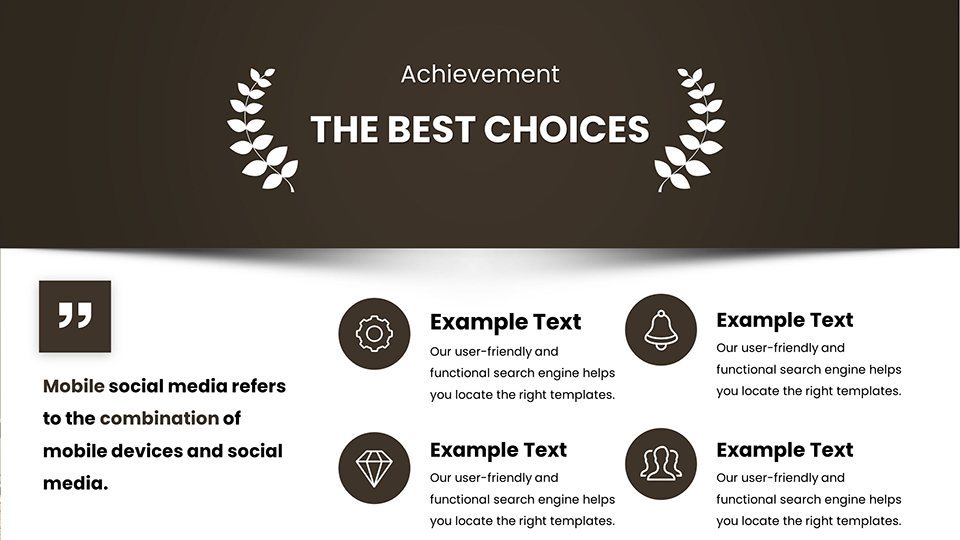
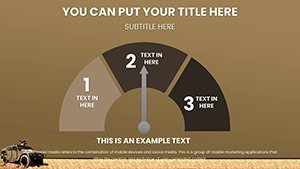
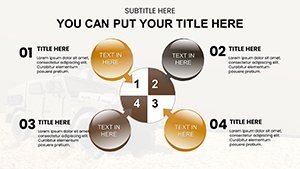
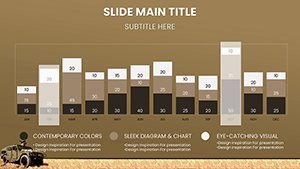
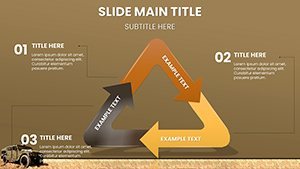
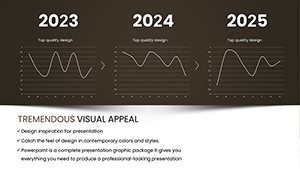
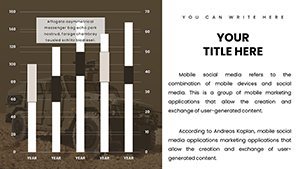
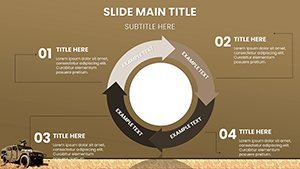
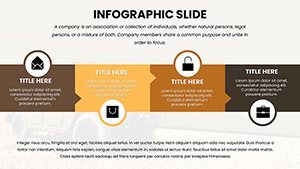
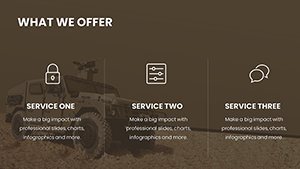
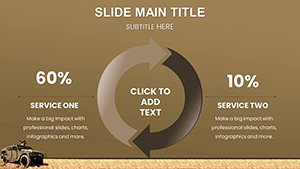
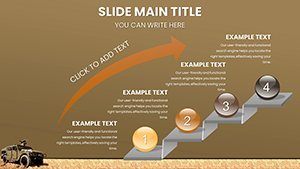
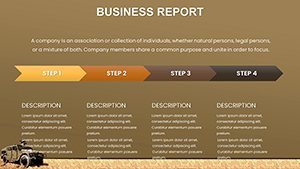
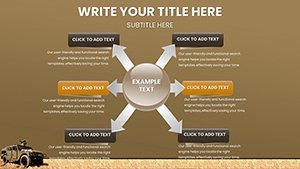
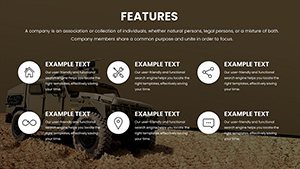
What makes this template indispensable for military presentations? It's the blend of functionality and flair. Each of the 59 slides is built for editability, allowing you to tweak data points, colors, and layouts in minutes. Expect a variety of chart types: bar graphs for comparing vehicle speeds, pie charts for resource allocation in logistics, line graphs tracking maintenance cycles, and scatter plots for vulnerability assessments. Icons and infographics depict everything from artillery ranges to cyber defense integrations, all optimized for high-contrast viewing in dimly lit ops centers.
- Customizable Themes: Switch between desert camo, urban gray, or arctic white palettes to match operational environments.
- Data-Driven Visuals: Embed real-time data links or static imports from Excel, ensuring accuracy in volatile scenarios.
- Animation Options: Subtle transitions highlight key stats, like zooming in on a vehicle's armor thickness during vulnerability discussions.
- Accessibility Features: Compliant with DoD standards for color blindness and screen reader compatibility, promoting inclusive briefings.
Beyond aesthetics, these features address pain points like time constraints in field operations. A quick edit can turn a generic slide into a mission-specific masterpiece, saving hours that could be spent on strategy rather than design.
Real-World Applications in Military Contexts
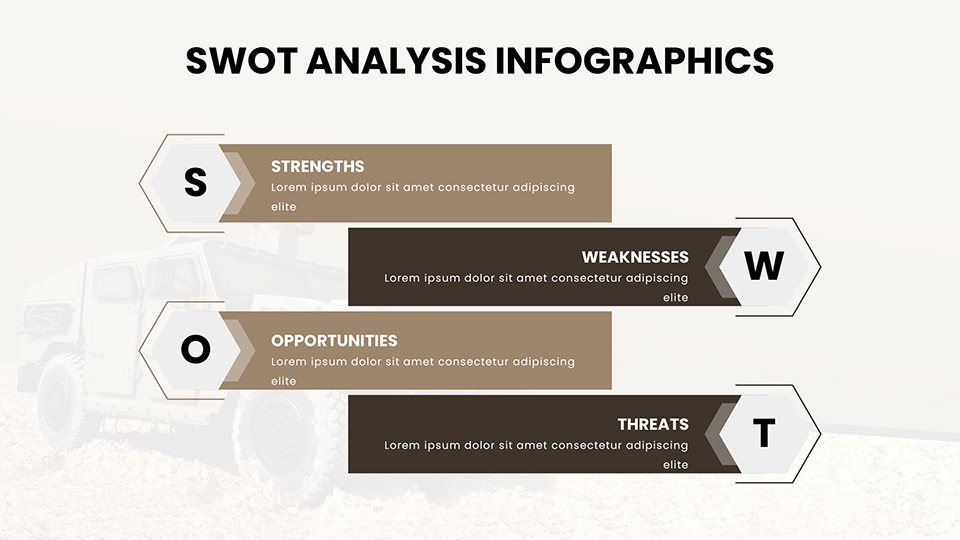
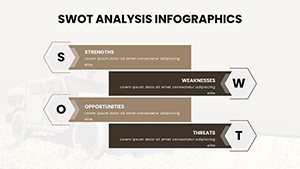
Picture this: You're a logistics officer preparing for a joint exercise. Use the timeline charts to map out vehicle convoy routes, incorporating Gantt-style visuals for phase breakdowns. Or, as a procurement analyst, leverage SWOT analysis slides to evaluate new armored personnel carriers against competitors, backed by data from sources like Jane's Defence Weekly. This template shines in scenarios inspired by actual events, such as the U.S. Army's adoption of next-gen tanks, where visual aids clarified upgrade benefits to decision-makers.
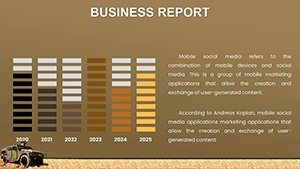
For intelligence analysts, radar charts compare enemy vehicle capabilities, fostering deeper threat assessments. In training sessions, bubble charts illustrate fuel efficiency across terrains, helping recruits grasp operational efficiencies. Even in budget reviews, stacked bar graphs break down costs for vehicle maintenance, aligning with fiscal year planning as per GAO reports. These applications aren't hypothetical - they mirror practices in organizations like the RAND Corporation, where data visualization drives policy.
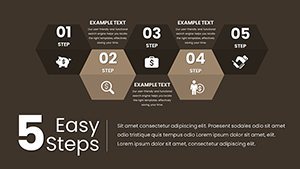
Step-by-Step Guide to Using the Template
- Open the .key file in Keynote and select your starting slide.
- Import data via copy-paste or CSV for instant chart population.
- Customize elements: Adjust fonts to match military sans-serif standards, resize icons for emphasis.
- Add animations and transitions for dynamic flow during delivery.
- Export to PDF or video for secure sharing in classified environments.
This workflow integrates effortlessly with tools like Microsoft Teams for virtual briefings, enhancing collaboration in distributed teams.
Benefits Over Standard Keynote Tools
Why choose this over built-in Keynote charts? Standard options lack the thematic depth - our template includes pre-built military icons, avoiding the need for stock image hunts. It's faster: Pre-formatted slides reduce setup time by 70%, per user feedback from similar defense tools. Plus, it boosts engagement; audiences retain 65% more info from visuals, as per studies from the Defense Advanced Research Projects Agency (DARPA). Trust in its reliability, with designs vetted for accuracy against MIL-STD-810 standards for environmental testing visuals.
Subtle CTAs encourage action: Ready to fortify your presentations? Customize this template today and lead with visual superiority.
Expert Tips for Maximum Impact
To elevate your use, incorporate storytelling: Frame vehicle data as a narrative arc - from historical deployments to future innovations. Pair with real case studies, like the Bradley Fighting Vehicle's evolution, to add credibility. For , cite authoritative sources subtly, such as DoD reports, within notes. Keep paragraphs concise for quick scans, and use bold for key terms like "tactical mobility" to aid SEO without forcing it.
Inspiring yet professional, this template turns data dumps into strategic symphonies. Whether pitching to generals or training cadets, it delivers the edge you need.
Frequently Asked Questions
- How editable are the military vehicle charts?
- Fully editable - adjust data, colors, and layouts with Keynote's tools for complete customization.
- Is this compatible with older Keynote versions?
- Yes, works with Keynote 6 and later, ensuring broad accessibility.
- Can I use these for classified presentations?
- Absolutely, as long as you handle data securely; the template itself is unclassified.
- What file formats are supported for export?
- Export to PDF, PPTX, or MOV for versatile sharing.
- Are there tutorials included?
- Basic guides in the notes section; advanced tips available on our site.