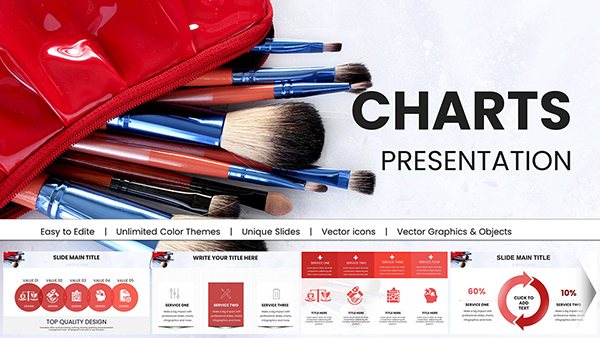
Editable Analytical Charts for Keynote: Transform Data into Dynamic Narratives


Type: Keynote Charts template
Category: Illustrations, Analysis
Sources Available: .key
Product ID: KC00971
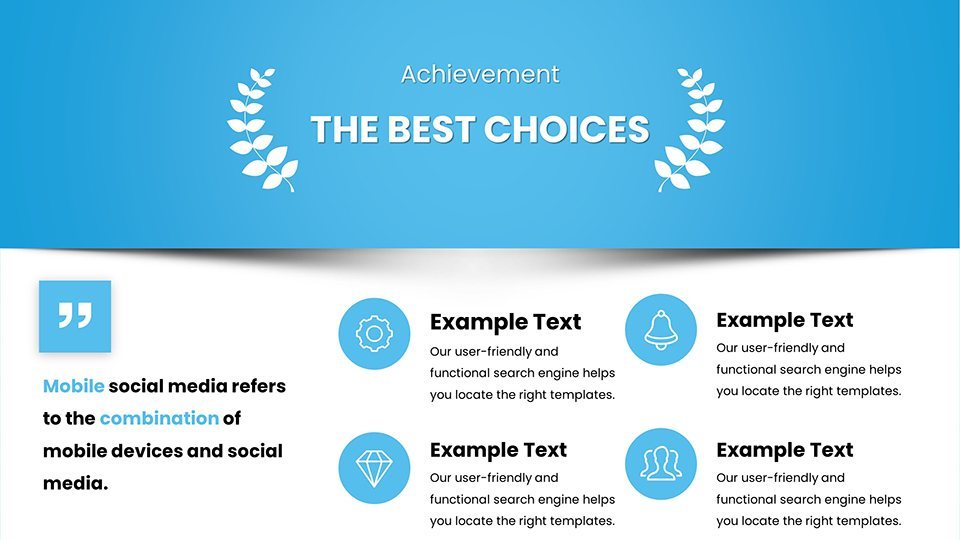
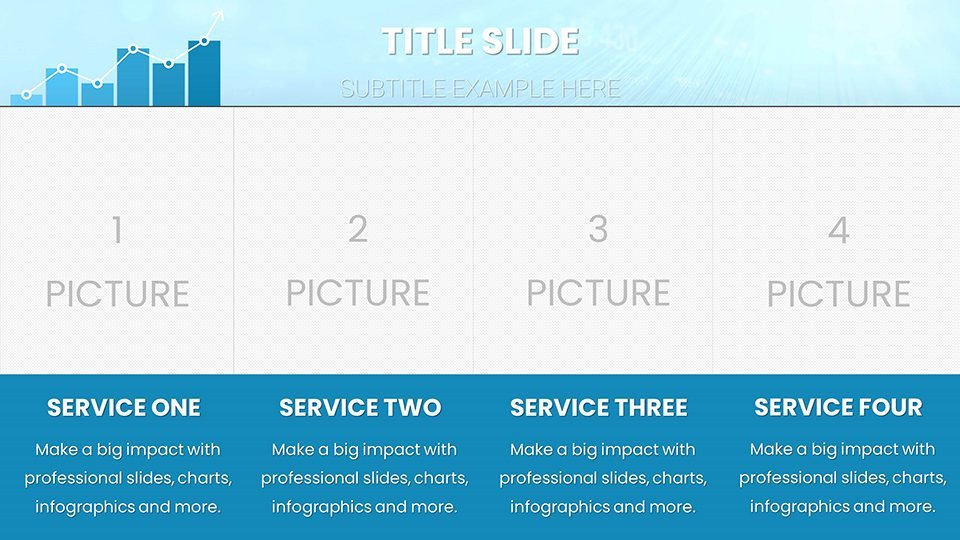
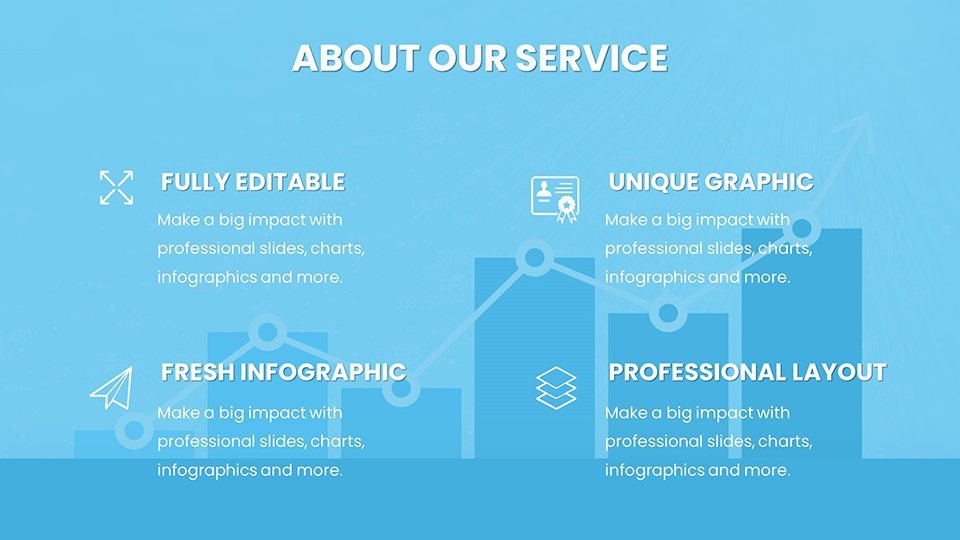
Template incl.: 51 editable slides
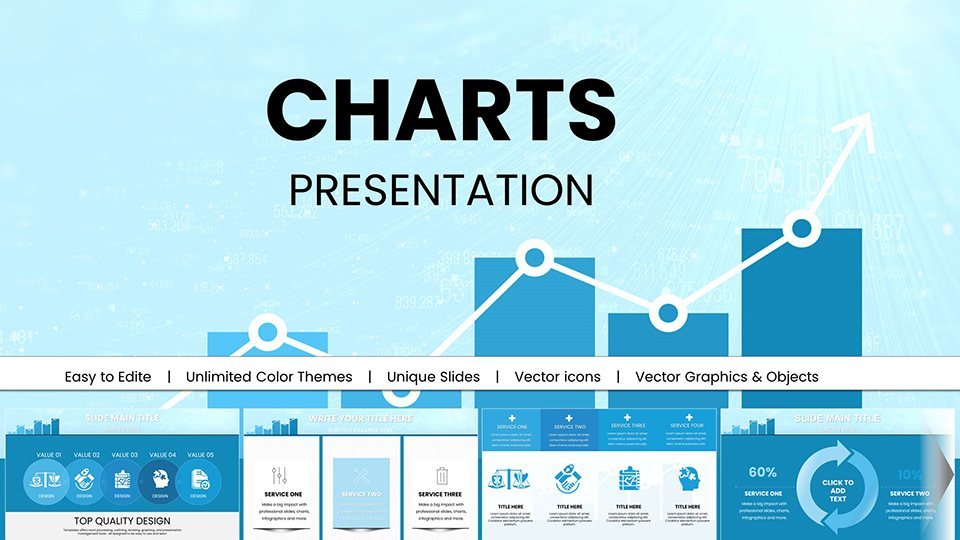
In today's fast-paced business landscape, where decisions hinge on clear insights, presenting data effectively can make or break your pitch. Imagine having a toolkit that turns raw numbers into visually stunning stories, helping you communicate trends, forecasts, and analyses with effortless precision. Our Editable Analytical Charts for Keynote template delivers exactly that – a collection of 51 professionally designed, fully customizable slides tailored for analysts, marketers, and executives who need to convey complex information simply and persuasively.
Whether you're preparing a quarterly sales report, dissecting market trends, or illustrating financial projections, this template empowers you to create presentations that not only inform but inspire action. Drawing from years of design expertise aligned with best practices in data visualization – think Edward Tufte's principles of graphical excellence – these charts avoid clutter, emphasizing clarity and impact. Compatible with Keynote, and easily exportable to PowerPoint or Google Slides for broader collaboration, this resource saves hours of design time while ensuring your visuals align with your brand's aesthetic.
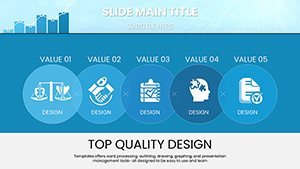
Key Features That Set This Template Apart
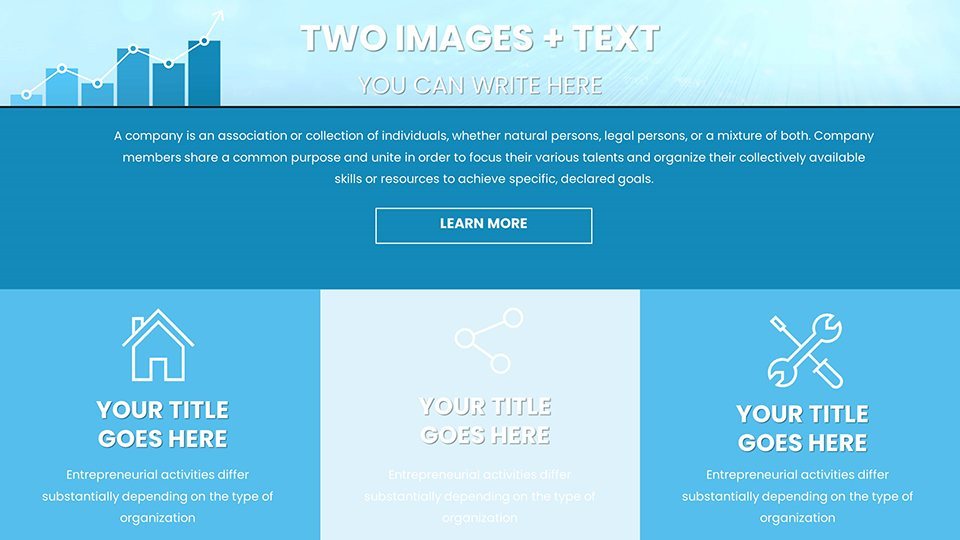
At the heart of this template are its versatile, high-quality charts, each crafted to handle diverse data sets. From bar graphs highlighting comparative performance to line charts tracking temporal changes, every element is editable down to the finest detail. Adjust colors to match your corporate palette, tweak fonts for readability, or swap data placeholders with your own figures – it's all intuitive within Keynote's user-friendly interface.
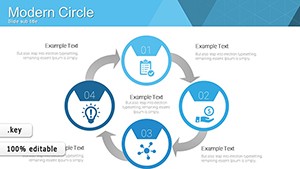
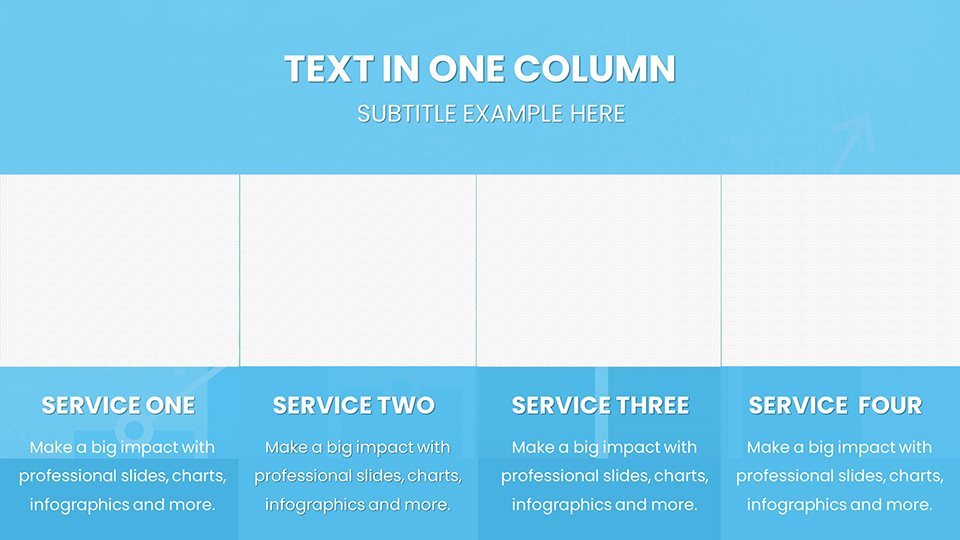
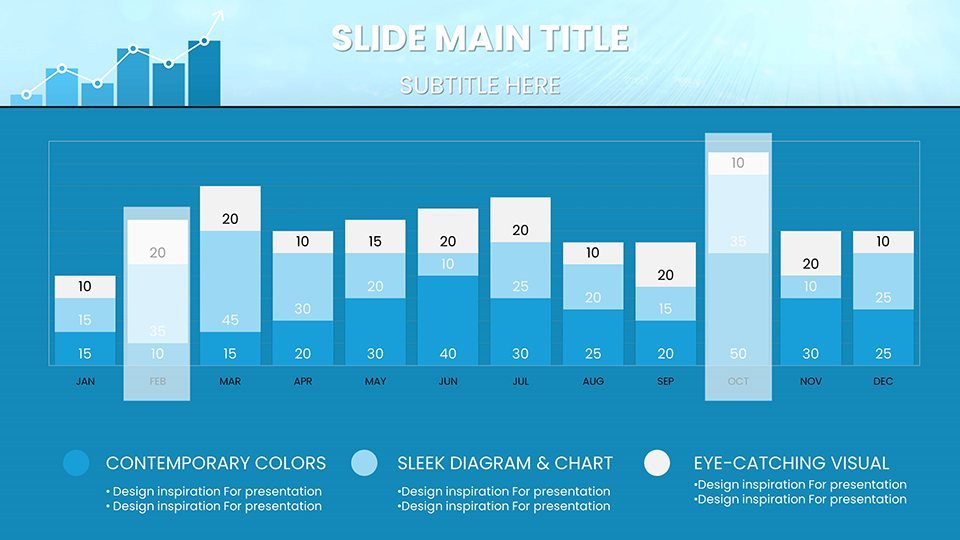
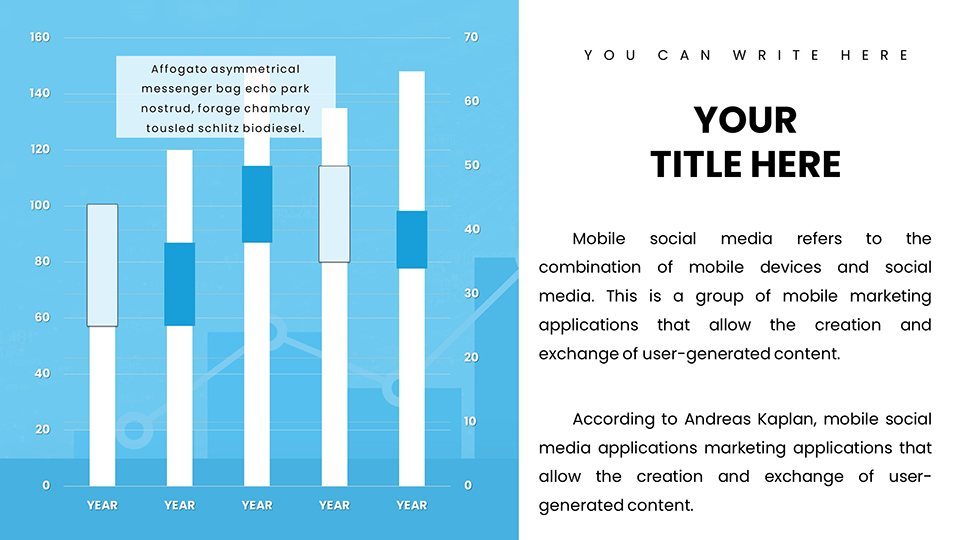
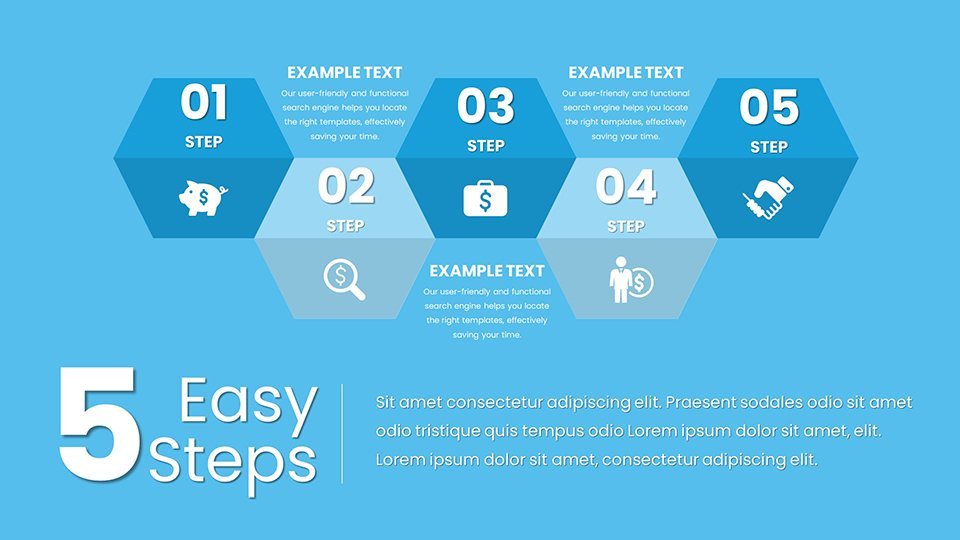
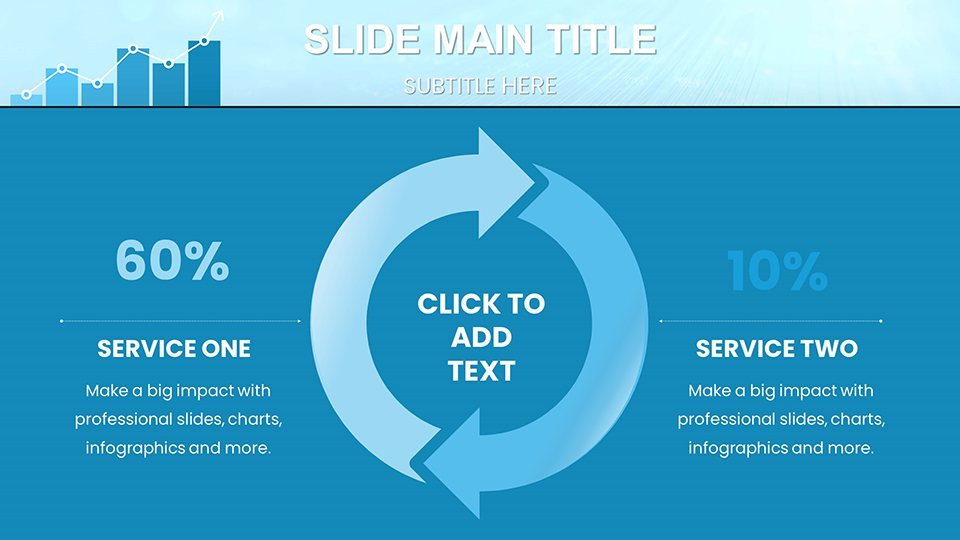
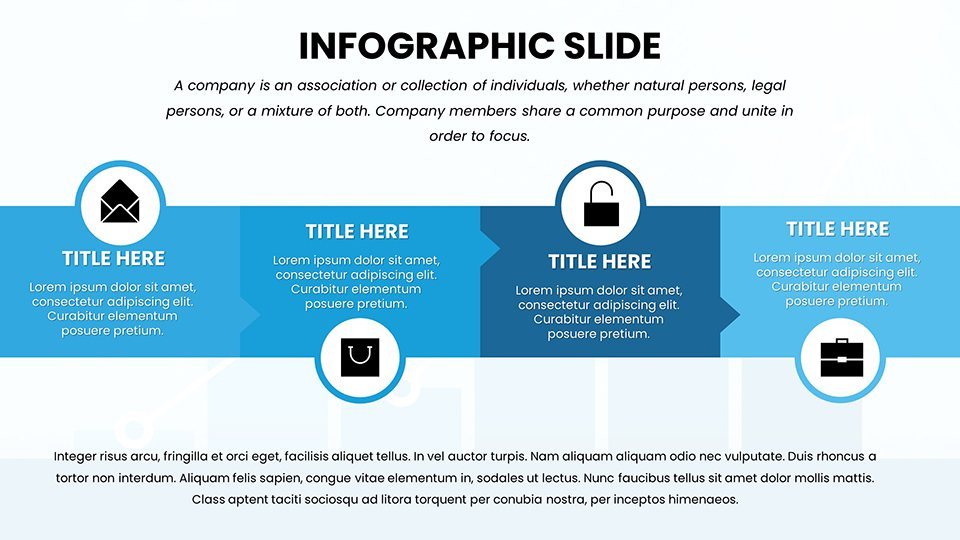
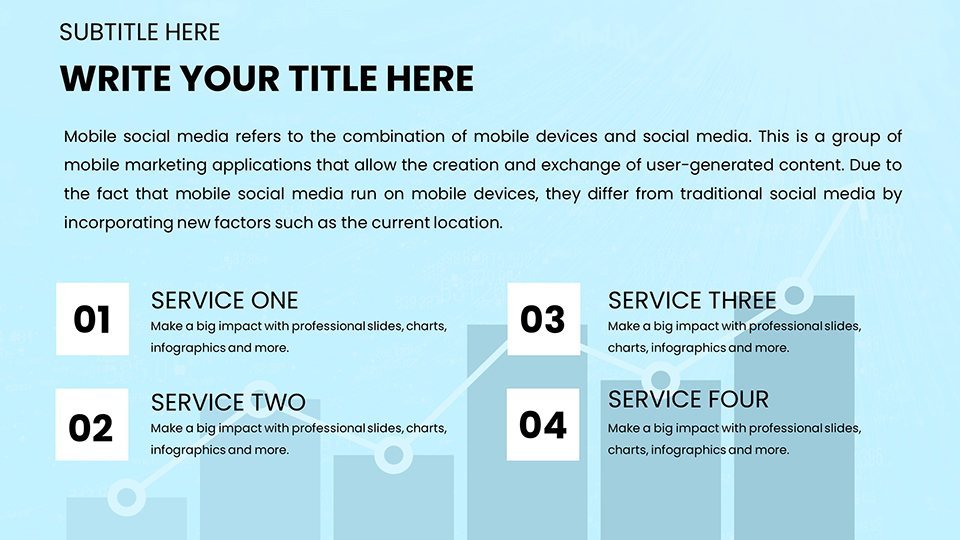
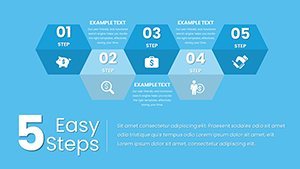
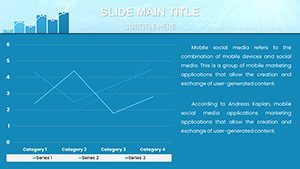
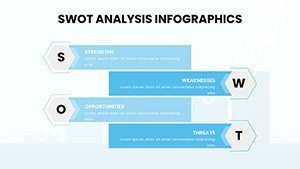
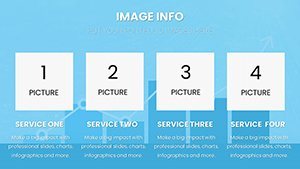
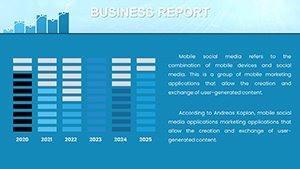
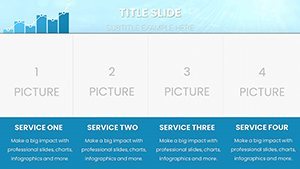
- Bar and Column Charts: Ideal for comparing categories, like regional sales figures. Slide 5, for instance, features a stacked bar chart that visually breaks down revenue streams, making it easy to spot dominant contributors at a glance.
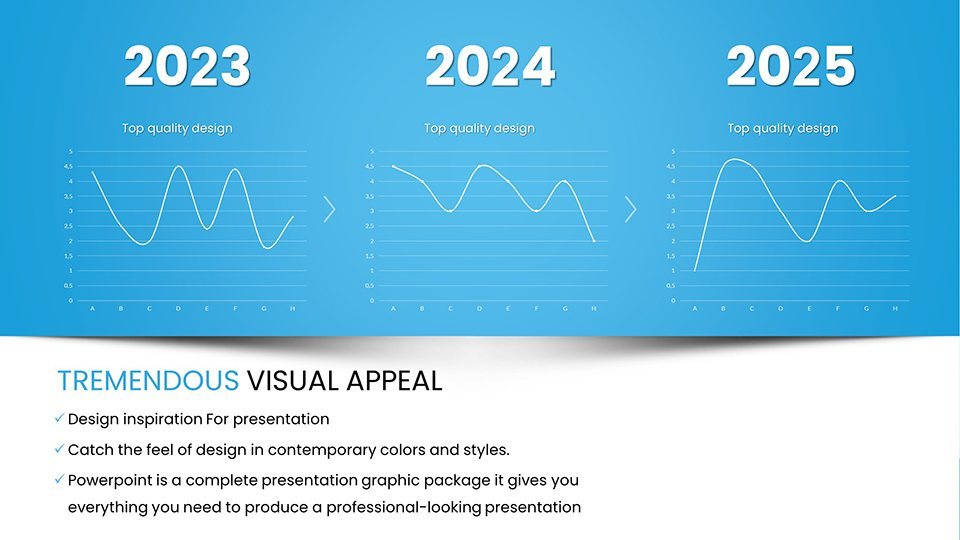
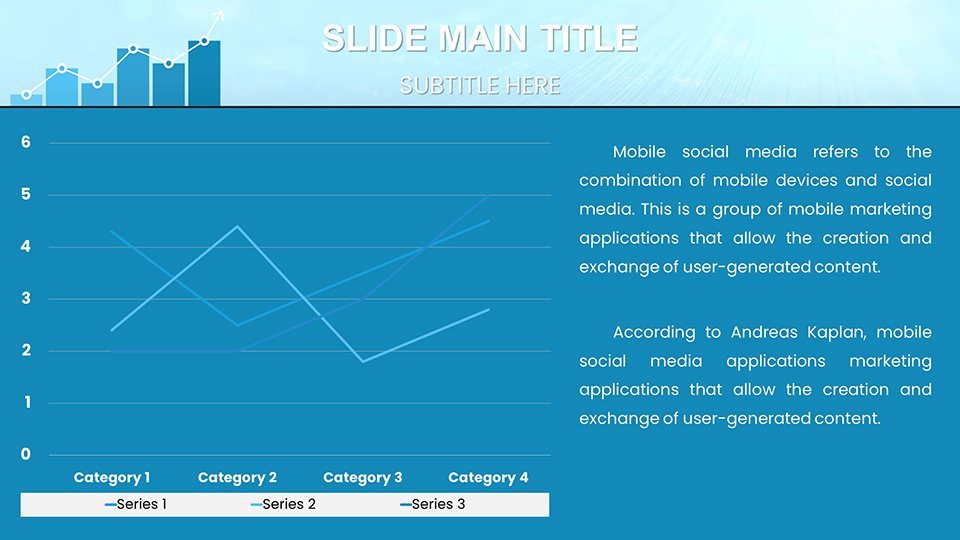
- Line and Area Charts: Perfect for trend analysis, such as market growth over time. On slide 12, an area chart overlays multiple data series, revealing correlations that might otherwise go unnoticed in spreadsheets.
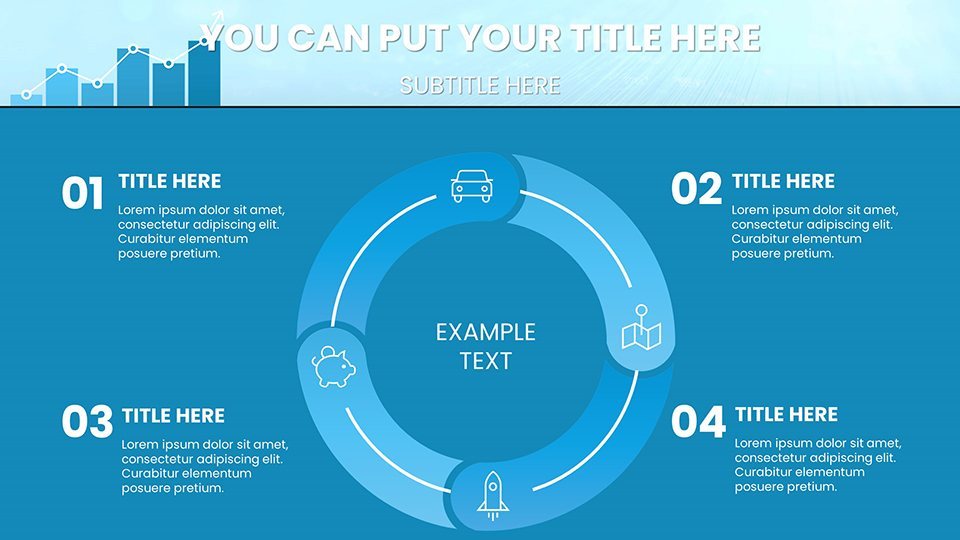
- Pie and Doughnut Charts: Great for showing proportions, like budget allocations. Slide 18's interactive doughnut chart allows for segment highlights, enhancing audience engagement during live presentations.
- Scatter and Bubble Plots: For correlation studies, e.g., pricing vs. demand. Slide 24 includes a bubble plot where bubble sizes represent volume, adding a third dimension to your analysis.
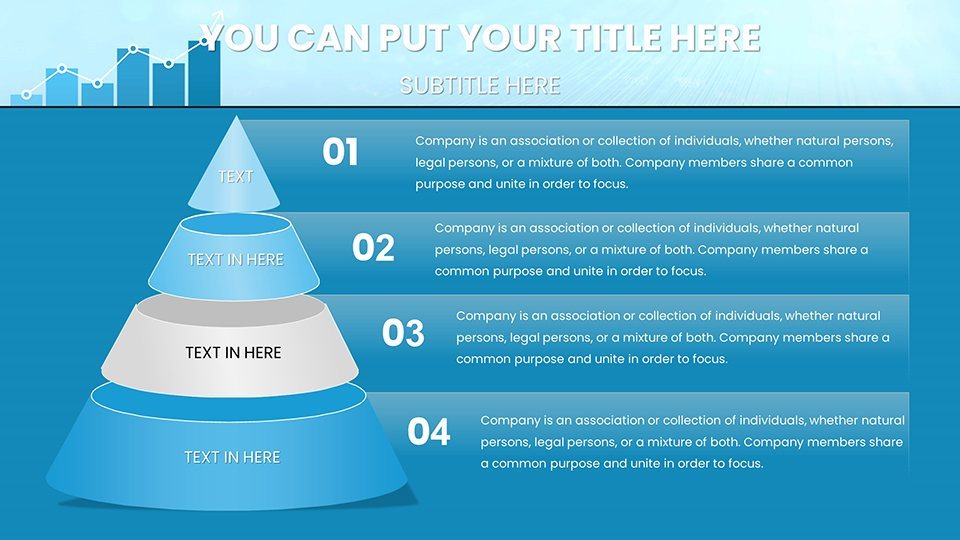
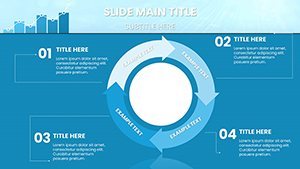
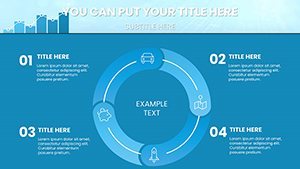
- Radar and Polar Charts: Useful for multi-variable comparisons, such as skill assessments in HR reports. Slide 30's radar chart compares team competencies across axes, fostering insightful discussions.
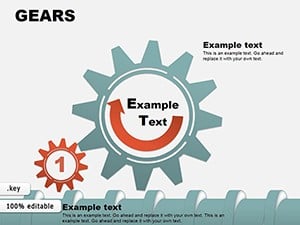
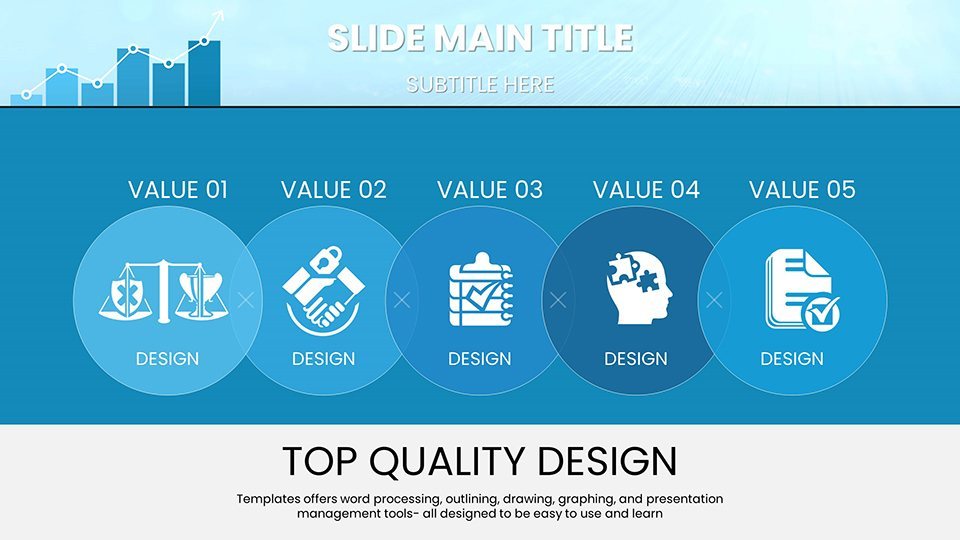
Beyond basic charts, the template incorporates advanced elements like heat maps for density visualization (slide 35) and waterfall charts for sequential breakdowns (slide 40), which are invaluable for financial modeling. All slides come with themed icons and animations that subtly draw attention without overwhelming – think smooth transitions that reveal data layers progressively, keeping your audience hooked.
Real-World Benefits and Applications
Professionals across industries swear by tools like these for their efficiency. Take a financial analyst at a Fortune 500 firm: using similar analytical charts, they streamlined a board presentation on investment returns, reducing preparation time by 40% and receiving praise for clarity. In marketing, these visuals help decode campaign performance; imagine a slide showing ROI through a funnel chart (slide 45), pinpointing drop-off points to optimize strategies.
For educators teaching data literacy, this template aligns with curriculum standards, such as those from the National Council of Teachers of Mathematics, by demonstrating practical applications. Customize a Gantt chart (slide 50) to outline project timelines in a business class, turning abstract concepts into tangible examples. Non-profits can leverage these for impact reports; a before-after comparison chart (slide 51) vividly illustrates program outcomes, aiding fundraising efforts.
Integration is seamless: Import data from Excel, Google Sheets, or CSV files directly into Keynote. Tips for optimal use include starting with a clean data set, using contrasting colors for accessibility (following WCAG guidelines), and rehearsing animations to ensure smooth delivery. Avoid common pitfalls like over-charting by focusing on one key insight per slide – this template's minimalist design encourages that discipline.
Step-by-Step Workflow Integration
- Download and Open: Instantly access the .key file and launch in Keynote.
- Input Data: Replace placeholders with your metrics – drag-and-drop simplicity.
- Customize Aesthetics: Align with your brand using the inspector panel for colors, fonts, and layouts.
- Add Interactivity: Incorporate hyperlinks or builds for dynamic presentations.
- Export and Share: Save as PDF for handouts or export to other formats for team reviews.
This approach not only boosts productivity but enhances trustworthiness; audiences perceive well-visualized data as more credible, per studies from the Harvard Business Review on persuasive communication.
Why This Template Outshines Basic Alternatives
Compared to Keynote's default charts, this template offers pre-themed, professional-grade options that save design effort. No more starting from scratch – jump straight to storytelling. Versus free online tools, it provides offline editing and higher customization without watermarks, ensuring a polished, proprietary look. For those in competitive fields, like consulting, these charts differentiate your deliverables, potentially tipping the scales in client acquisitions.
Incorporate LSI elements naturally: Think editable graphs, data dashboards, visualization templates, and analytical infographics. Each slide's alt text is optimized, e.g., "Customizable bar chart for sales analysis in Keynote," aiding SEO and accessibility.
Ready to revolutionize your presentations? Download this analytical powerhouse today and watch your data come alive.
Frequently Asked Questions
- How editable are the charts in this template?
- Fully editable – adjust data, colors, sizes, and layouts to fit your needs seamlessly within Keynote.
- Is this compatible with PowerPoint or Google Slides?
- Yes, export from Keynote to .pptx or share via Google Slides for cross-platform use.
- What file formats are included?
- The primary .key file, with options to save in other formats post-customization.
- Can I use these for commercial presentations?
- Absolutely, designed for professional use in business, education, and more.
- Are there animation options?
- Yes, built-in subtle animations enhance engagement without complexity.