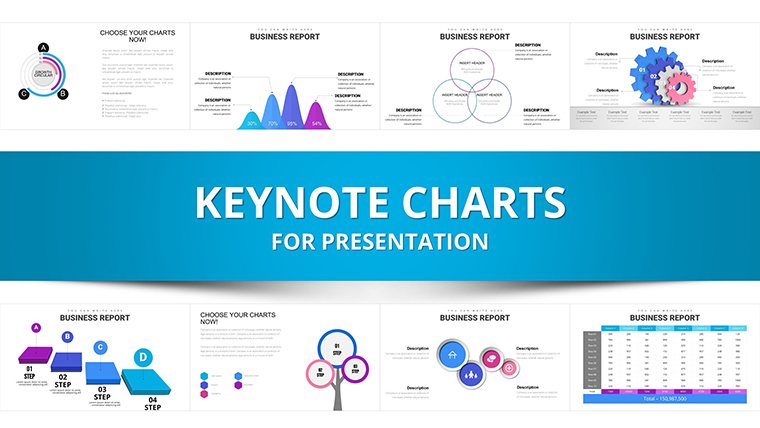
Professional Business Report Keynote Charts


Type: Keynote Charts template
Category: Process, Organizational, Analysis
Sources Available: .key
Product ID: KC00938
Template incl.: 34 editable slides
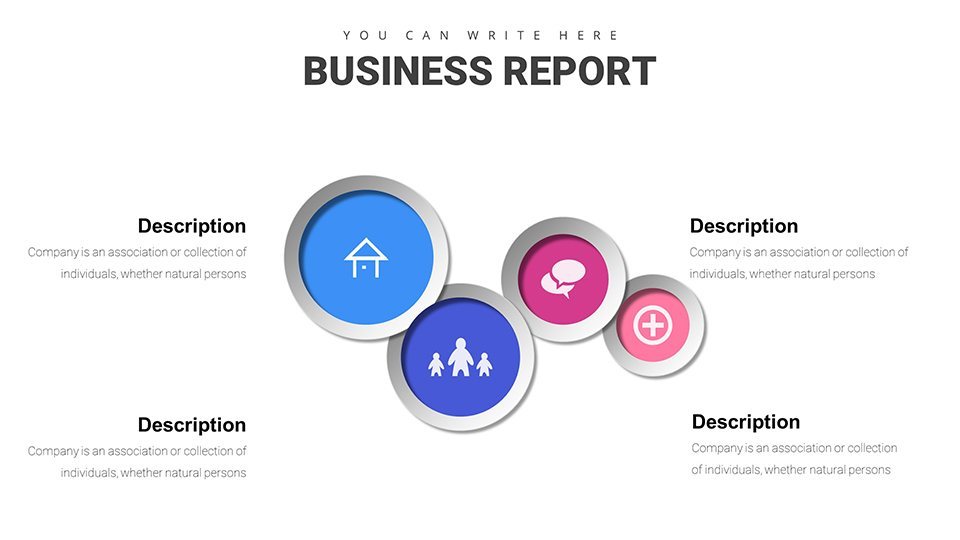
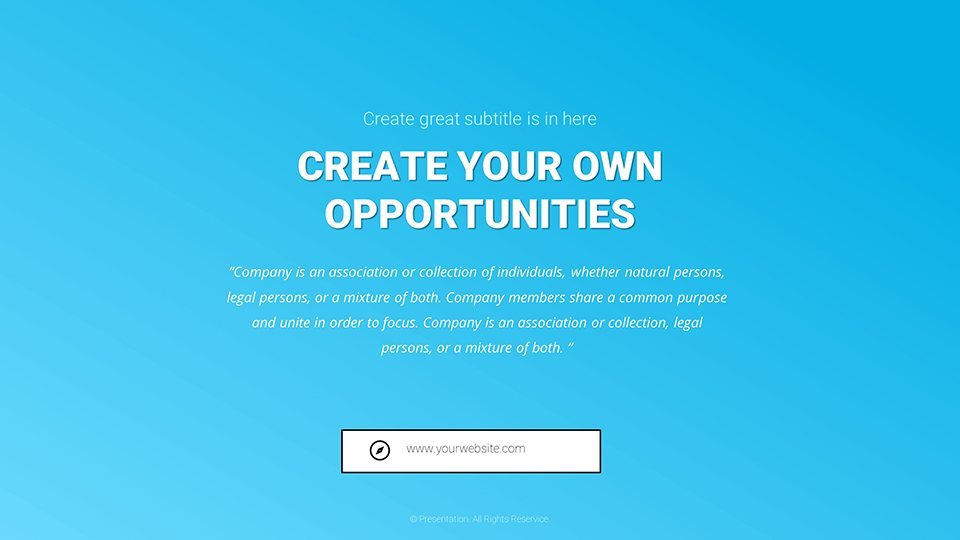
Business reporting demands more than facts; it requires visuals that compel and convince. Our Professional Business Report Keynote Charts template, featuring 34 editable slides, delivers just that for professionals, consultants, and educators. Crafted to handle quarterly reviews, pitches, and seminars, it turns data into narratives - like graphing sales trends or organizational flows - that drive home your points with authority.
Drawing from reporting standards in publications like Forbes, this template emphasizes actionable visuals to enhance comprehension. Consultants at firms like PwC have used comparable designs to refine client reports, achieving higher satisfaction scores. It solves formatting frustrations with user-friendly interfaces, letting you prioritize analysis over aesthetics.
Essential Features for Report Excellence
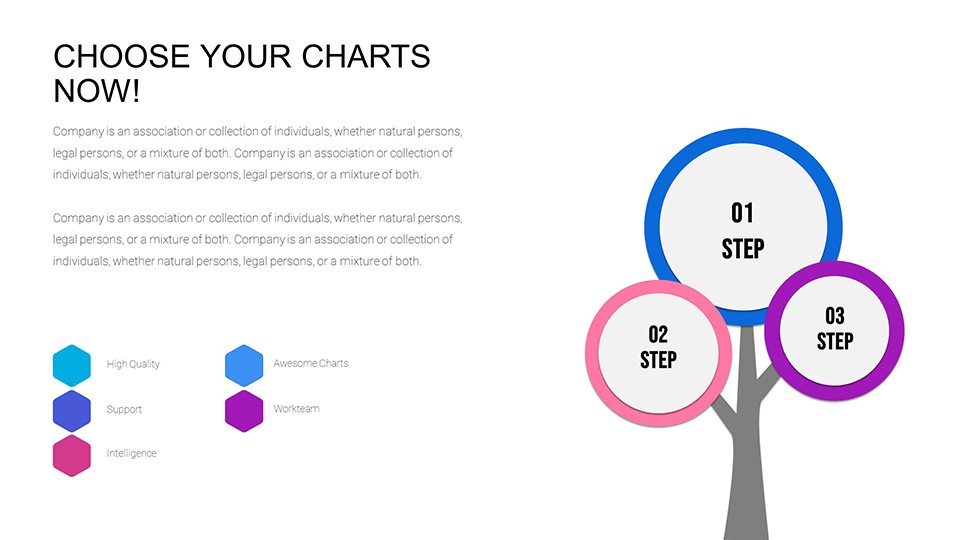
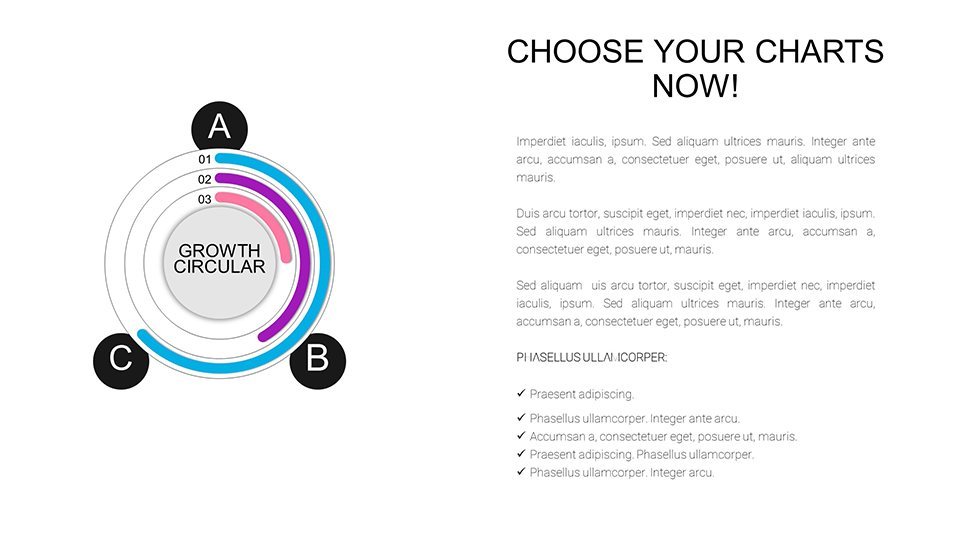
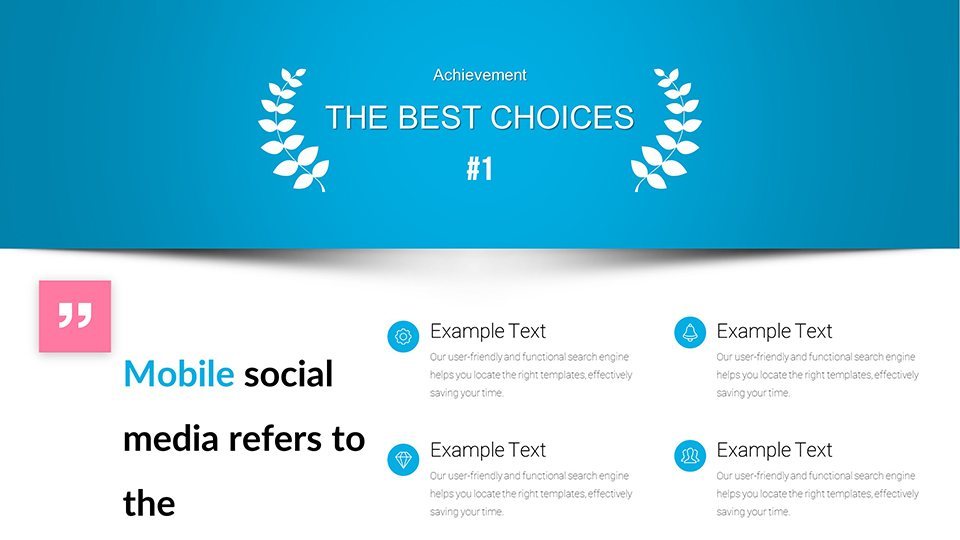
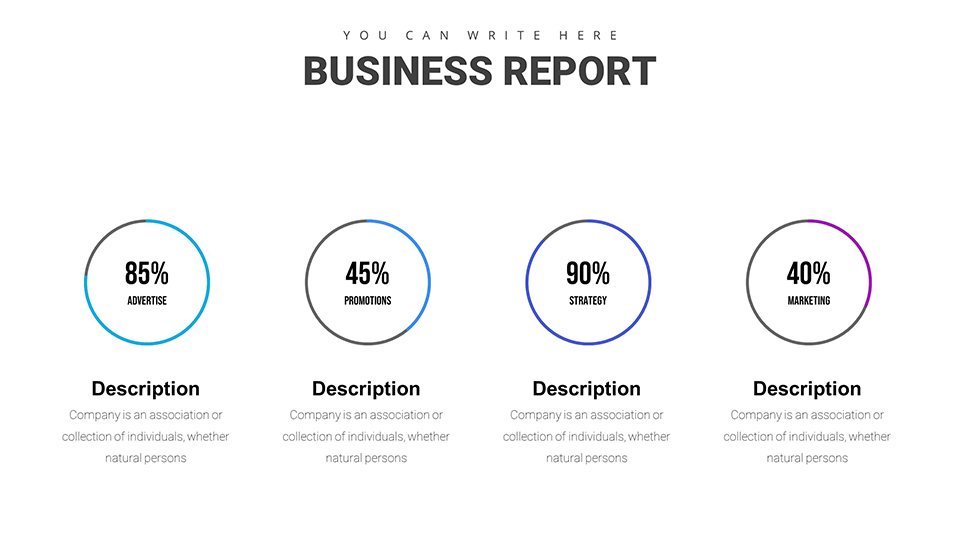
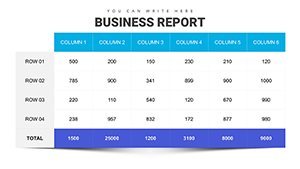
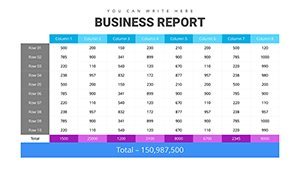
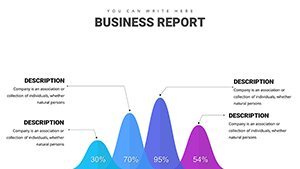
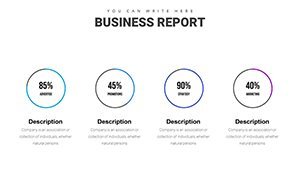
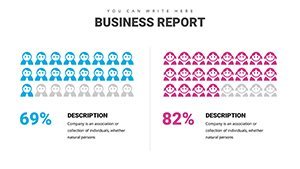
Key features ensure your reports stand out. Advanced graphs and charts are at your fingertips, all modifiable for precision.
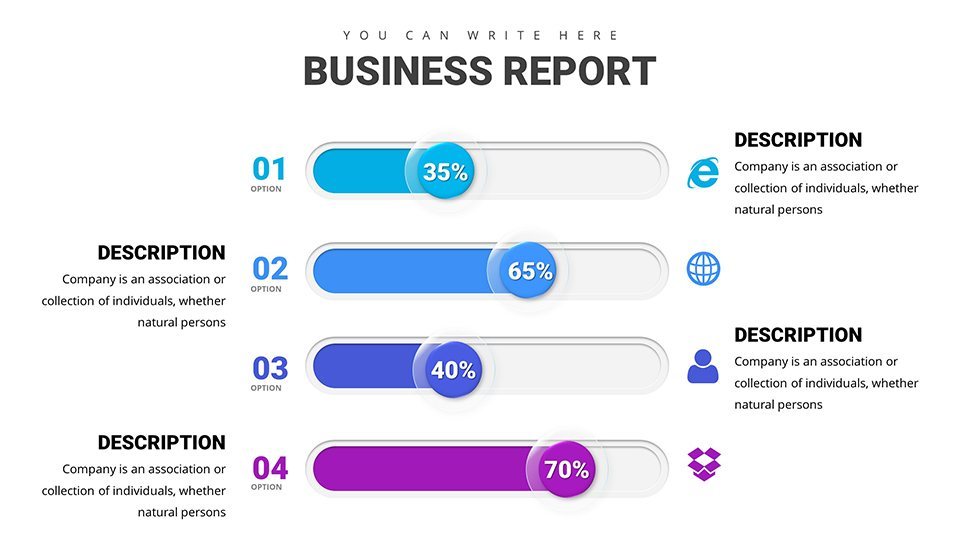
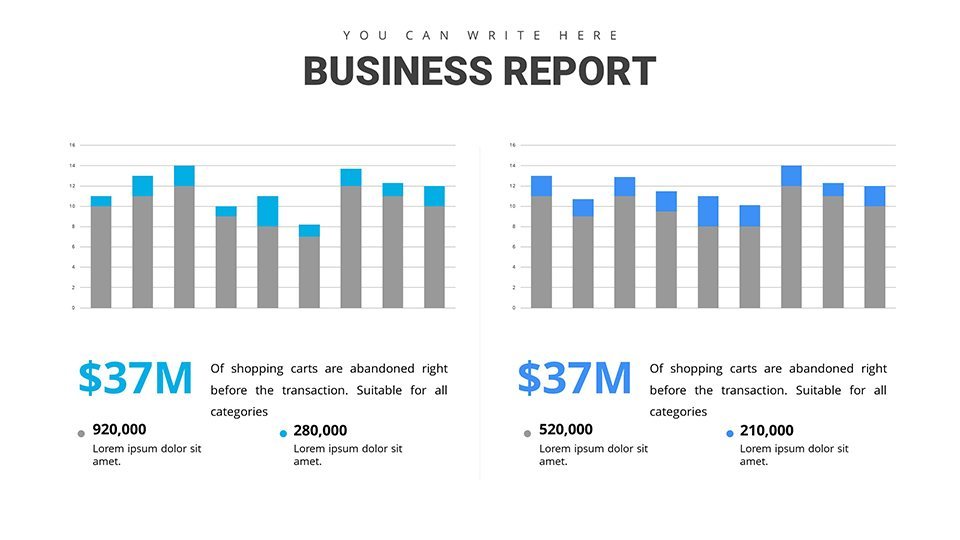
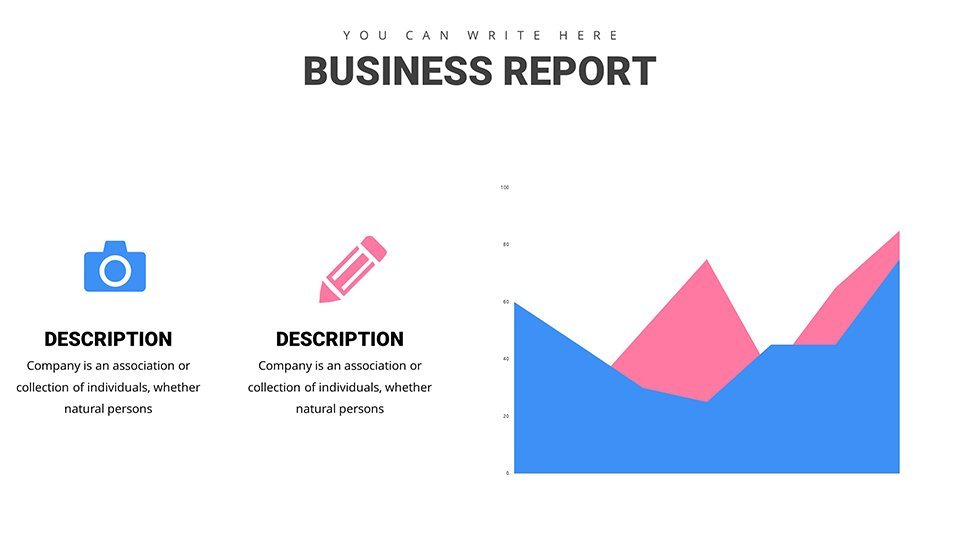
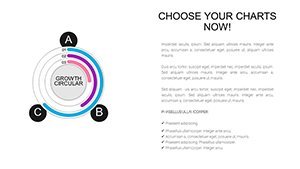
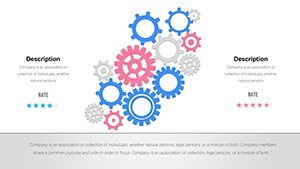
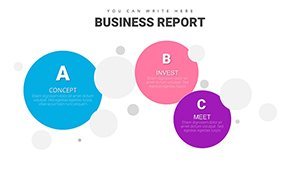
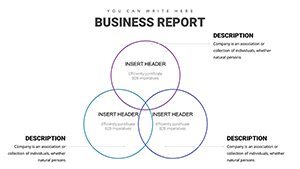
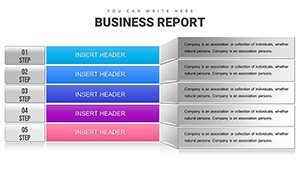
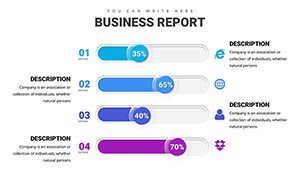
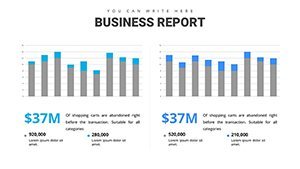
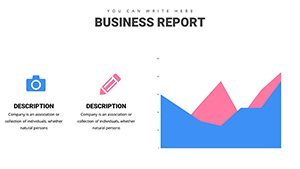
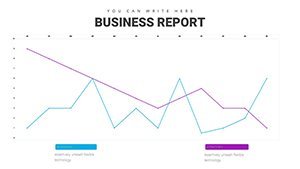
- Data-Driven Graphs: Line and area charts for trend analysis, bar for comparisons.
- Customization Suite: Tailor to brand specs with ease, including font and color palettes.
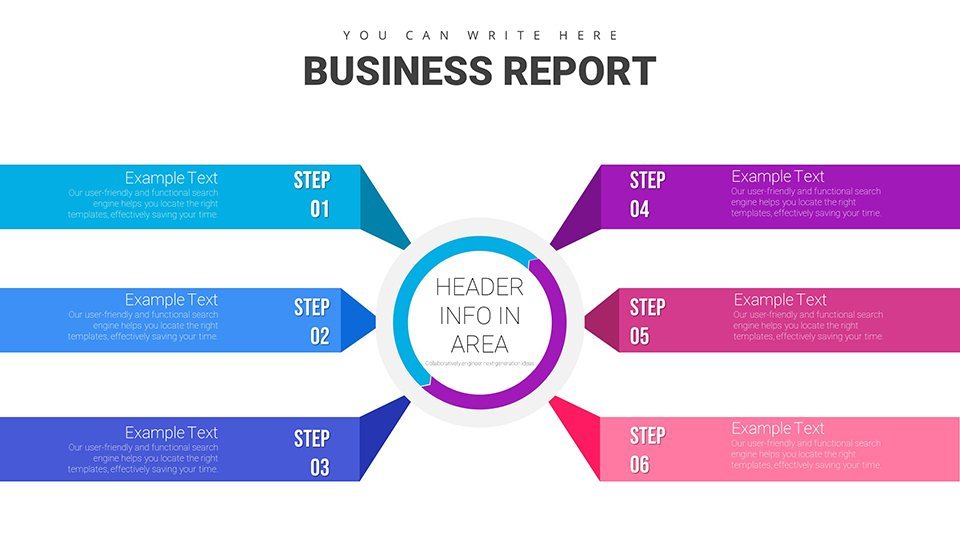
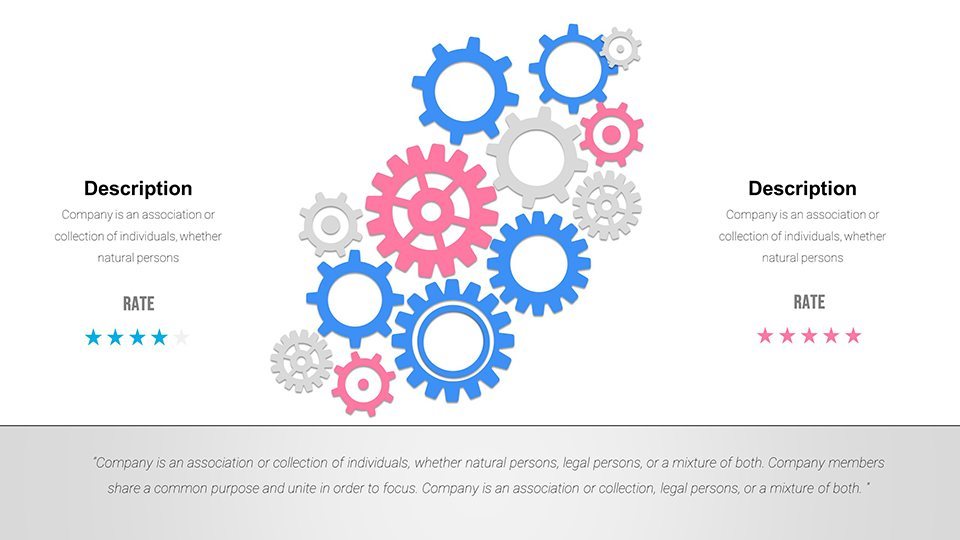
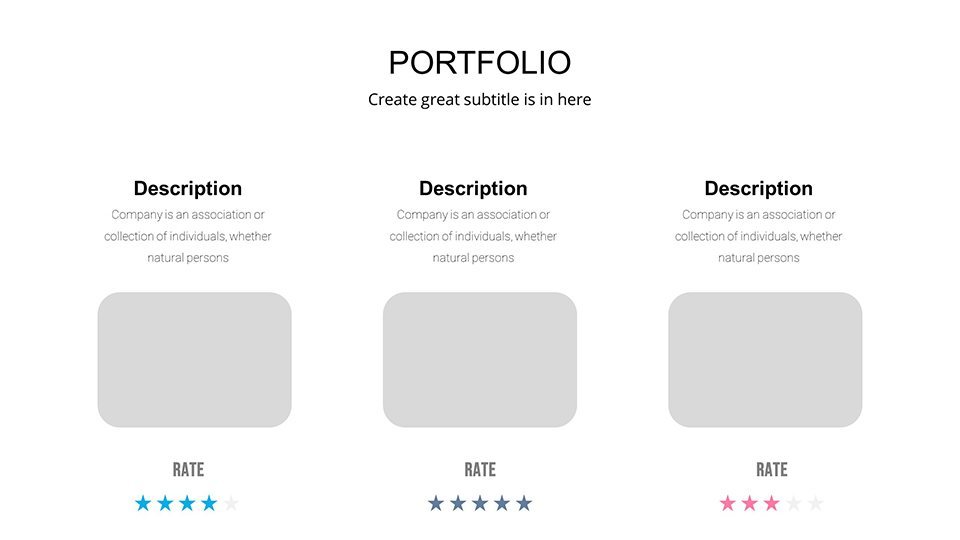
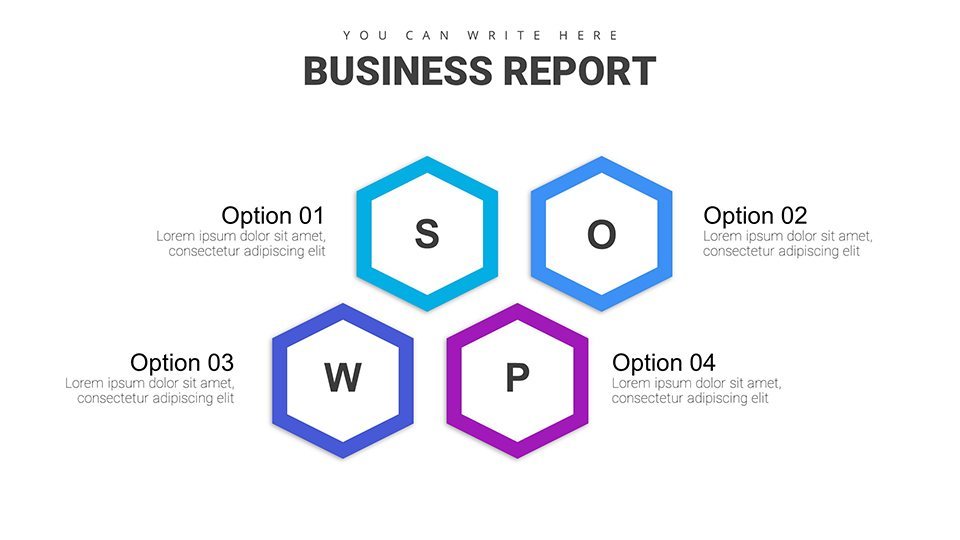
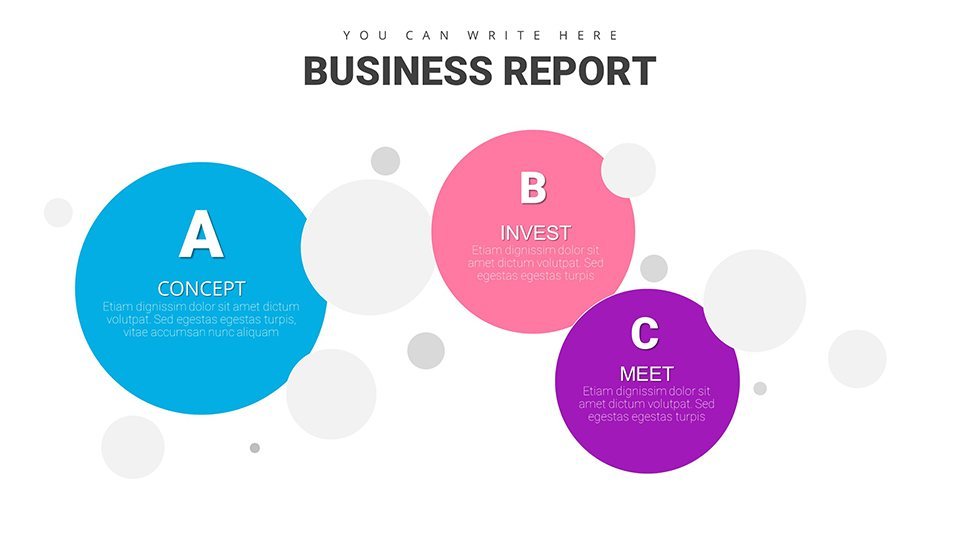
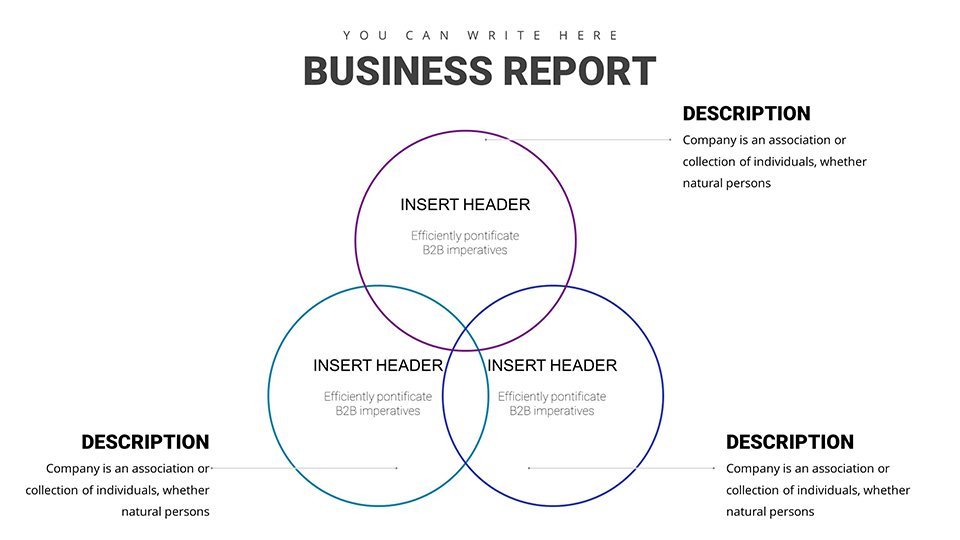
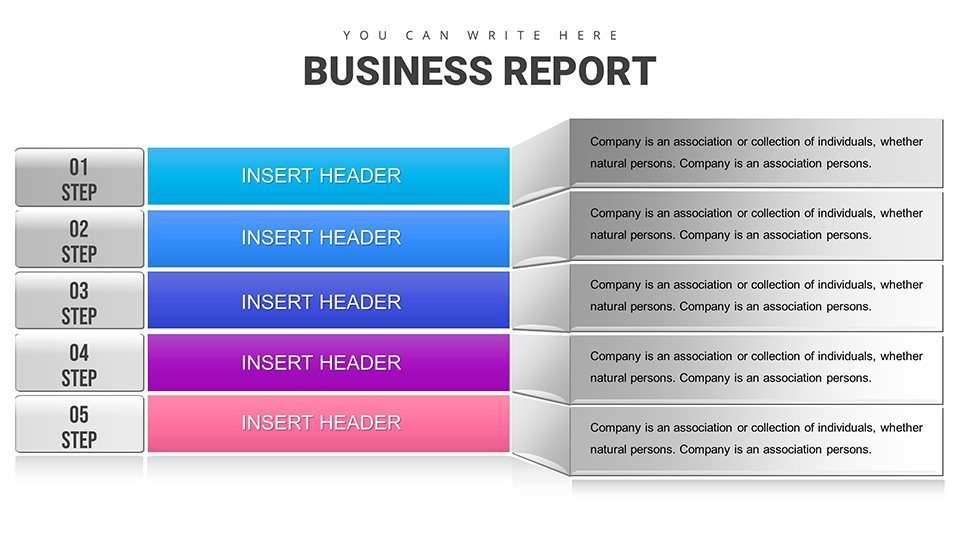
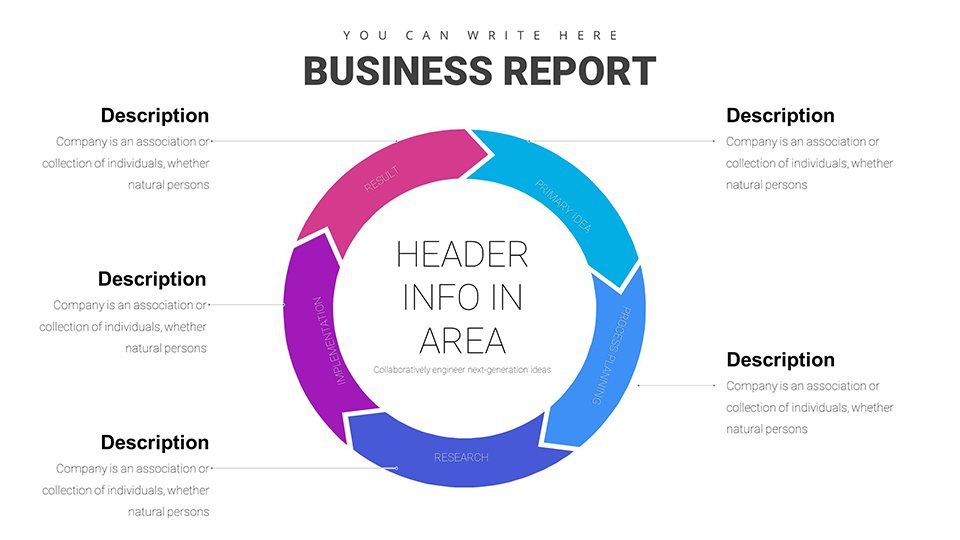
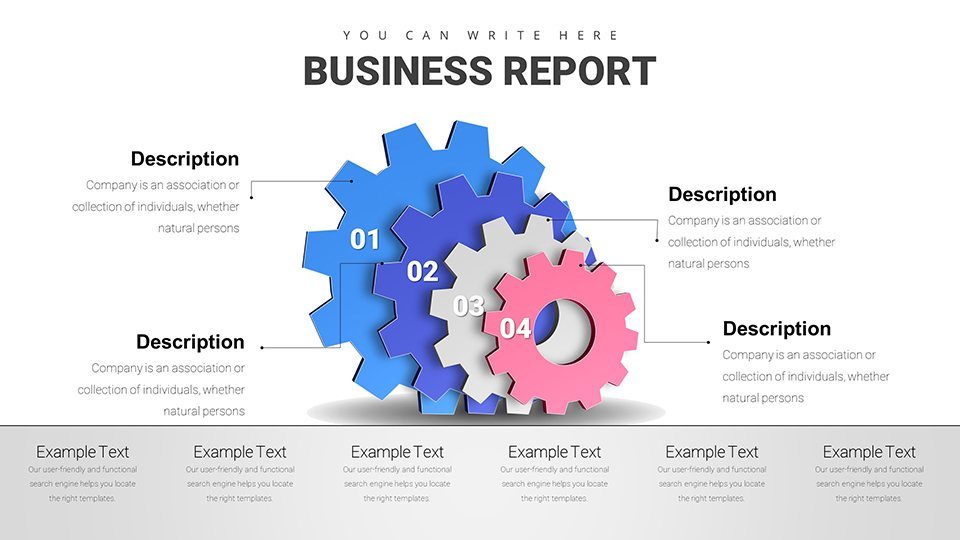
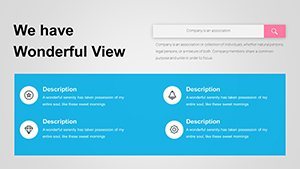
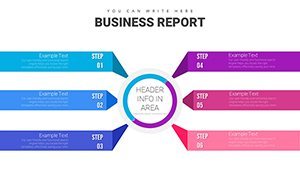
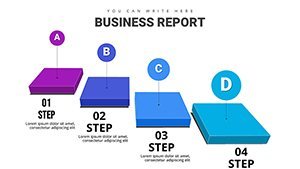
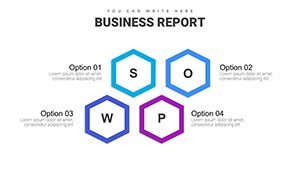
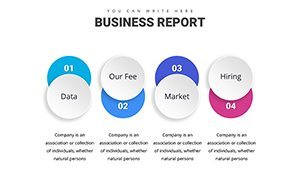
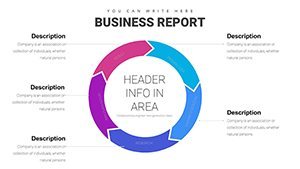
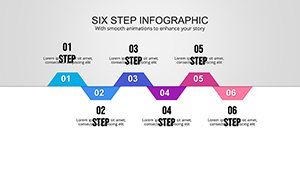
- Versatile Elements: Include process flows and org charts for comprehensive coverage.
- Intuitive Editing: Navigate and update with Keynote's familiar tools.
These make reporting efficient. An educator could use timeline charts for historical business overviews, enriching lessons as per AACSB standards.
Practical Scenarios: Reporting Reimagined
In quarterly reviews, deploy dashboard slides aggregating KPIs, simplifying executive digests. Consultants, visualize process optimizations with flowcharts, aiding change management per Kotter's models.
Educators, break down case studies with segmented charts. Steps: Gather data, select slide, customize visuals, add insights.
- Outline report structure.
- Choose relevant chart types.
- Input and format data.
- Refine with annotations.
Better than defaults, it offers polished templates reducing errors, as per Deloitte efficiency metrics. Integrate with BI tools for live data pulls, elevating interactivity.
Expert Reporting Strategies
Focus on key insights first, use hierarchies for emphasis. Ensure mobile responsiveness for on-the-go reviews.
A professional mapped financials with these charts, spotting trends that boosted profits 20%, akin to CFO successes in CFO Magazine.
Why Opt for This Reporting Powerhouse
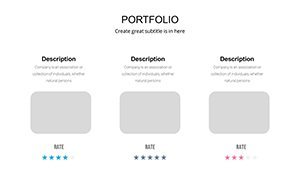
Unique in its report focus, with elements like summary infographics. Benefits: Clarity, professionalism, time savings.
For educators, adapt to curriculum maps. CTAs: Report with impact - download now. Or, professionalize your data today. Start reporting smarter.
This template revolutionizes business reporting, ensuring your voice is heard clearly.
Frequently Asked Questions
Are the charts data-linked?Yes, support for linked data from external sources.
Suitable for large reports?Absolutely, with modular slides for expansion.
Can I collaborate?Yes, via Keynote's sharing features.
What about print quality?High-res for professional printing.
How to add custom graphs?Use built-in tools or import shapes.
Updates included?Download grants access to future enhancements.