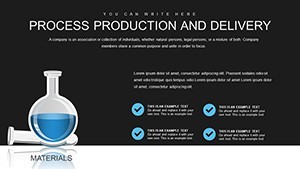
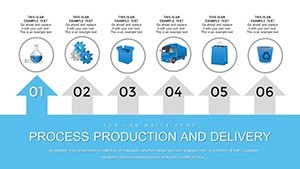
Production and Delivery Process Keynote Charts Template


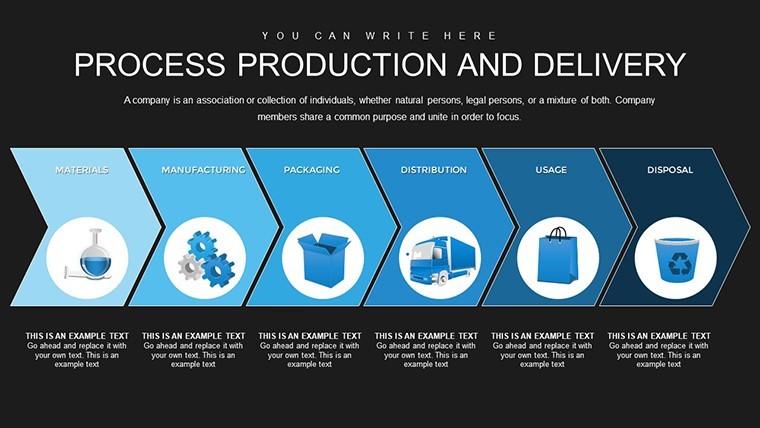
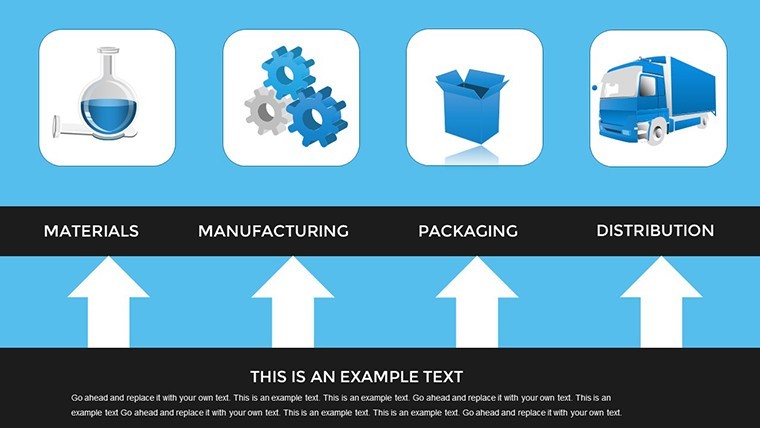

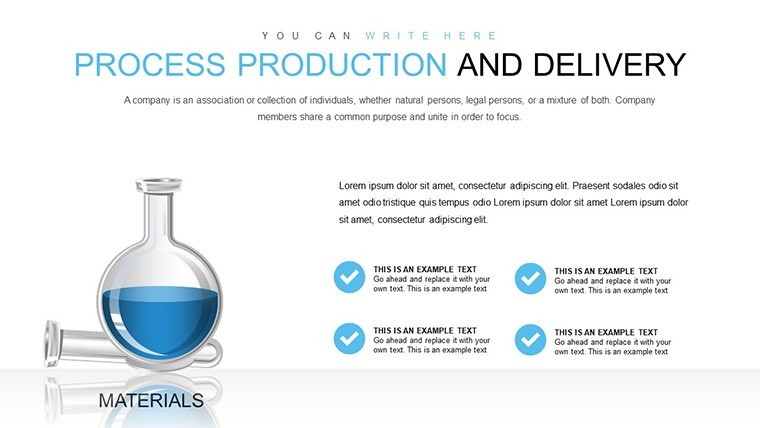
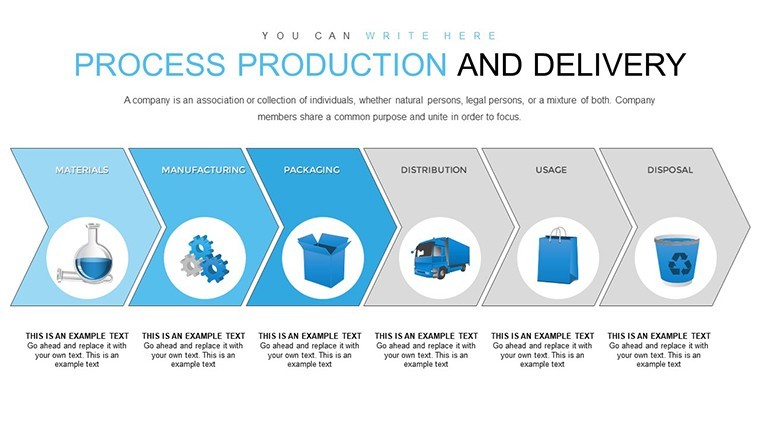
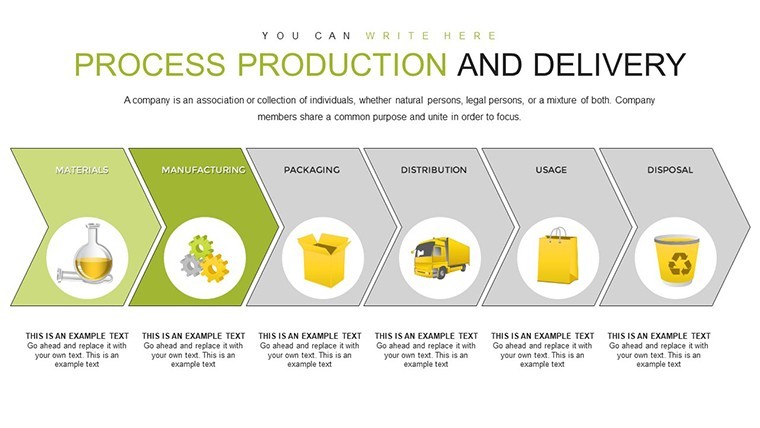
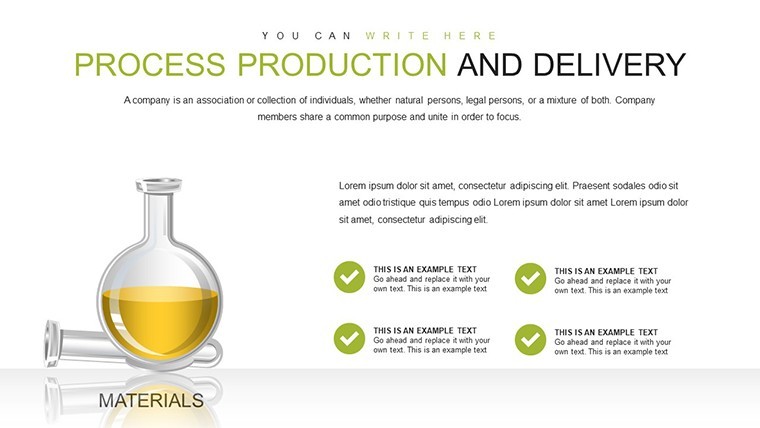
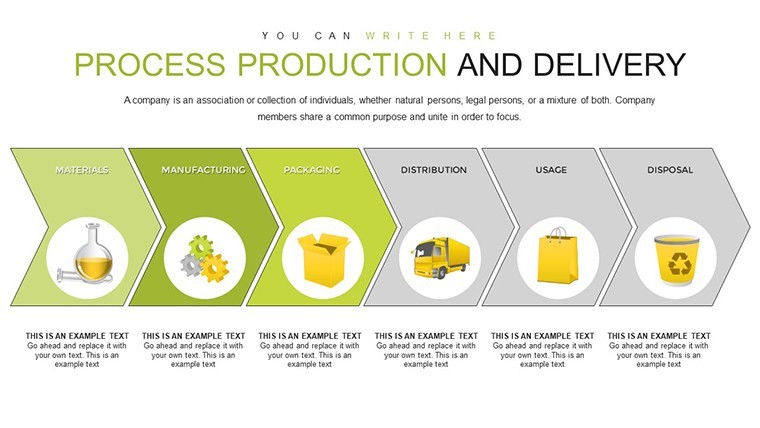
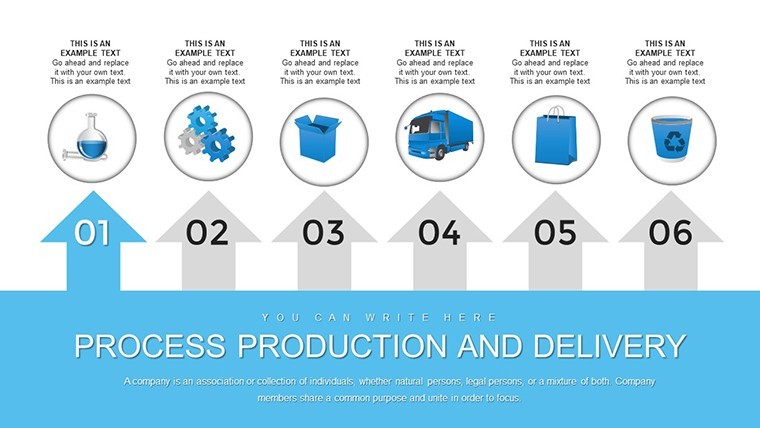


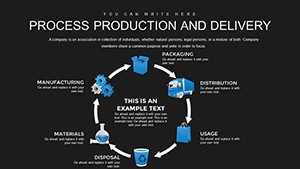
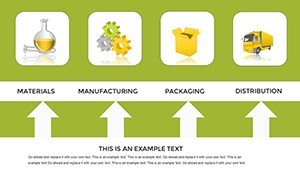
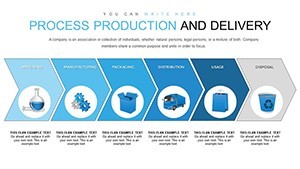
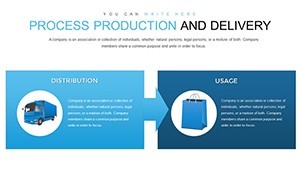
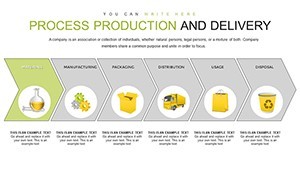
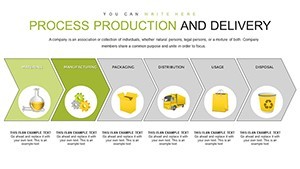
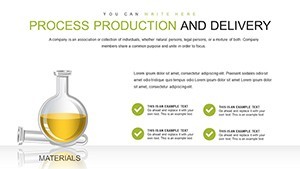
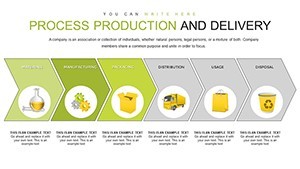
In the fast-paced world of supply chain management and project execution, conveying complex production and delivery workflows can make or break your stakeholder buy-in. Imagine transforming dense data into visually compelling stories that highlight every stage from raw material sourcing to final customer delivery. Our Production and Delivery Process Keynote Charts Template is crafted precisely for this purpose, offering 39 fully editable slides that blend functionality with aesthetic appeal. Designed for professionals like project managers, supply chain analysts, and operations leaders, this template empowers you to illustrate timelines, resource allocations, and process optimizations with clarity and precision. Whether you're pitching a new logistics strategy or reporting on manufacturing efficiencies, these charts turn abstract concepts into tangible visuals that resonate with your audience.
Tailored Visuals for Dynamic Business Environments
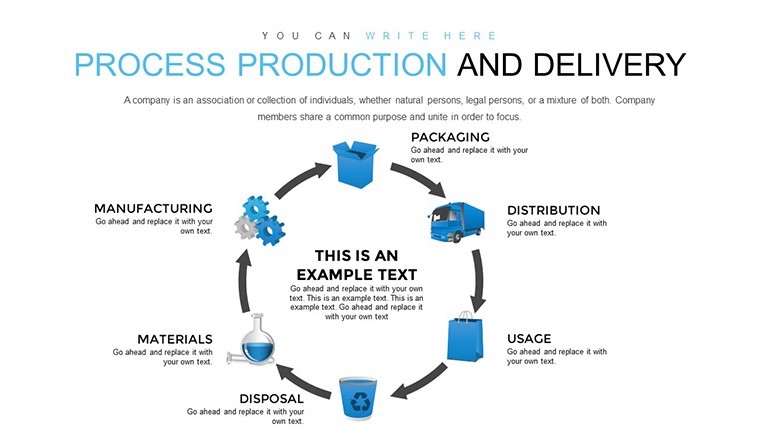
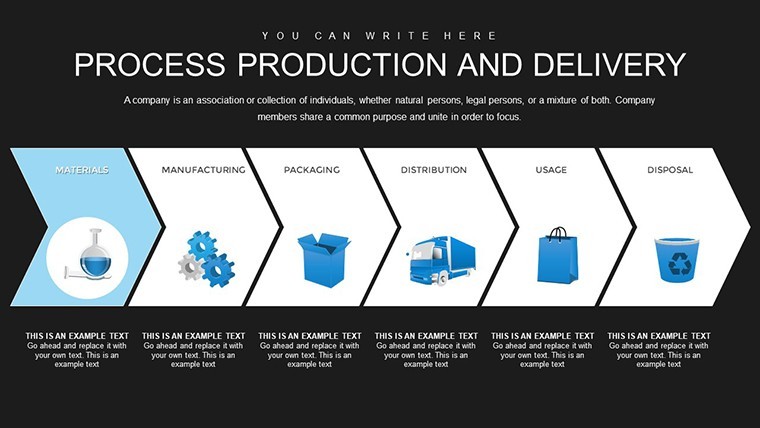
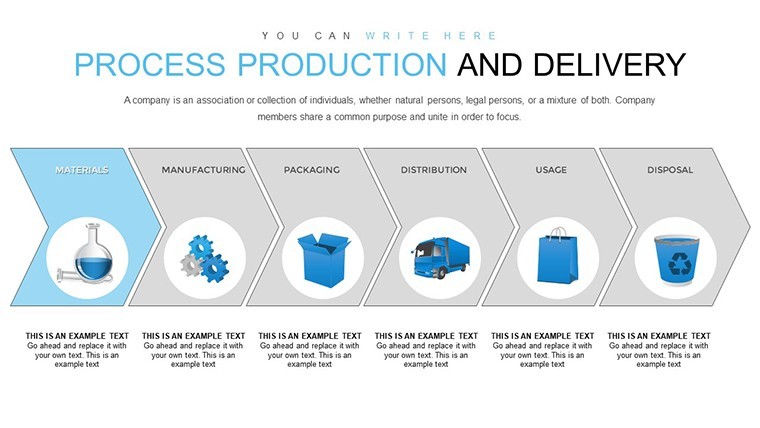
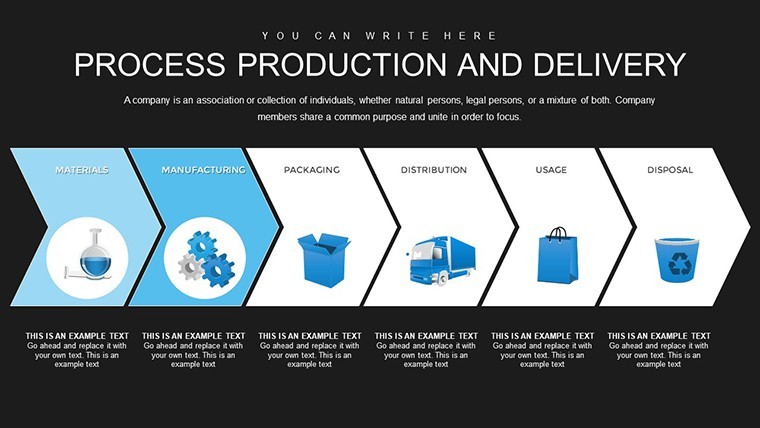
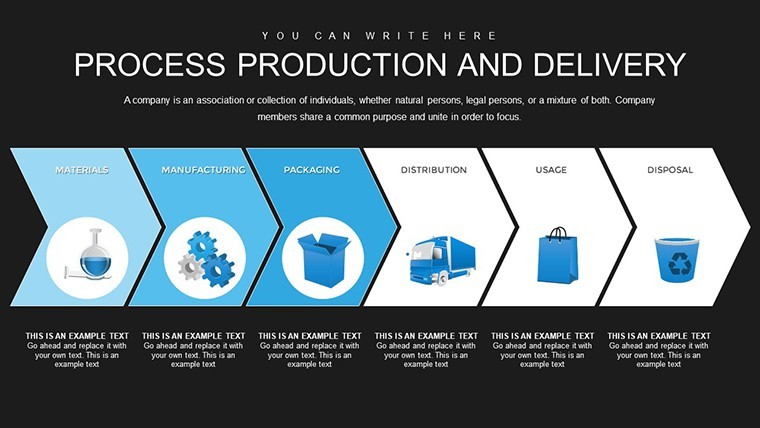
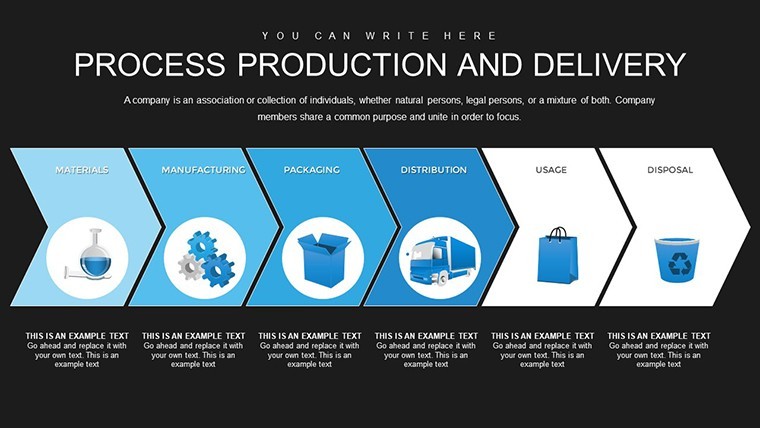
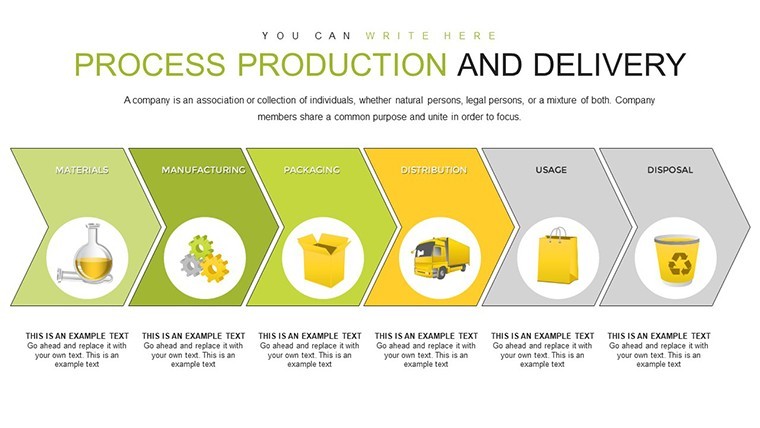
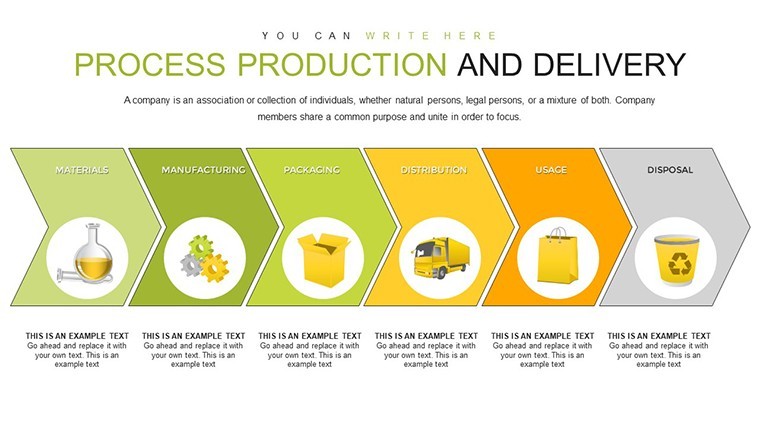
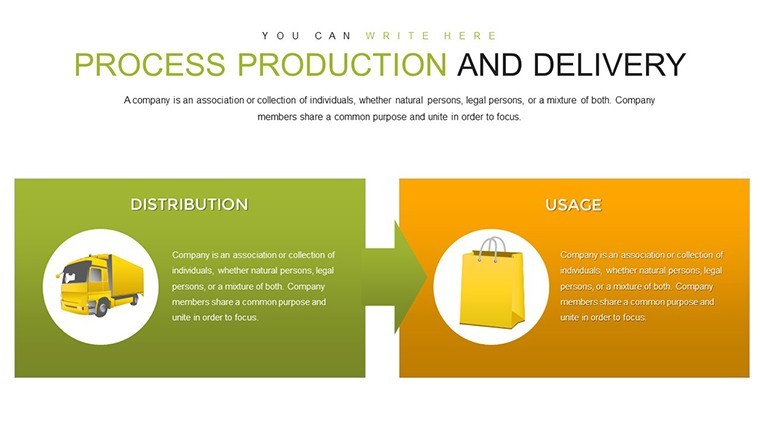
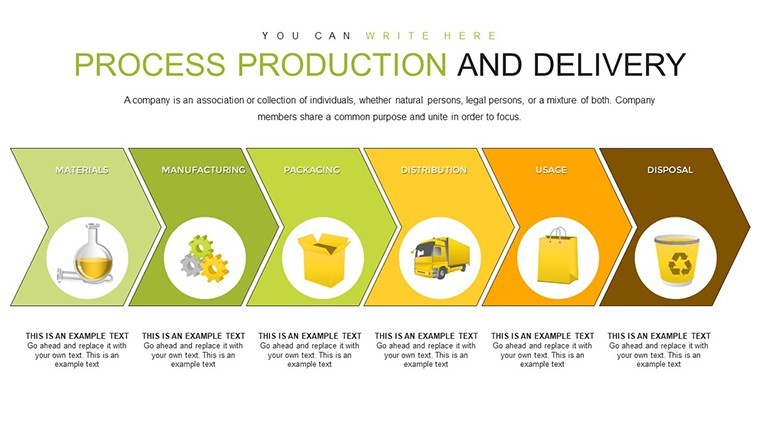
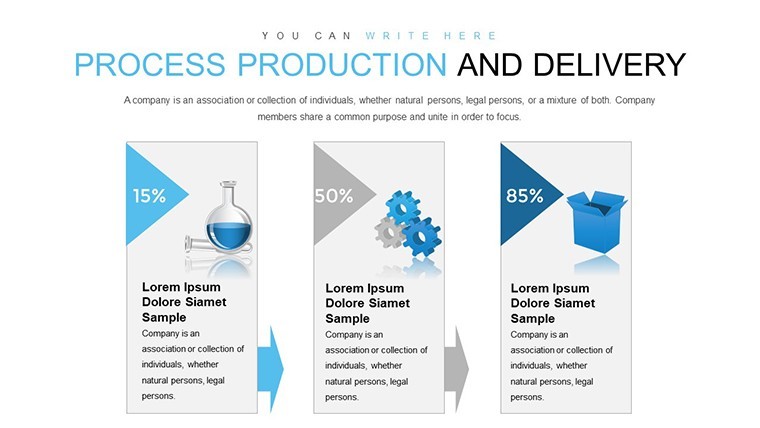
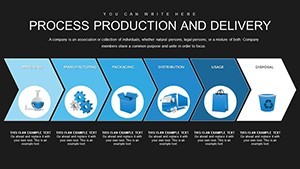
At the heart of effective communication lies the ability to simplify intricate processes without losing critical details. This template excels in that arena, providing a suite of tools that adapt to your unique needs. Start with the foundational flowcharts that map out sequential steps in production cycles – think of outlining how components move from assembly lines to quality checks. These aren't just static diagrams; they're interactive canvases where you can drag and drop elements, adjust arrows for directional flow, and incorporate real-time data imports from tools like Excel. For instance, in a real-world scenario, a global electronics manufacturer used similar process charts to streamline their supply chain, reducing delivery times by 20% as reported in a Supply Chain Management Review case study. By visualizing bottlenecks in their delivery routes, they identified inefficiencies that were previously buried in spreadsheets.
Moving beyond basics, the template includes advanced Gantt charts that are indispensable for project timelines. These horizontal bar graphs allow you to plot tasks against time, assigning dependencies and milestones with ease. Customize bar colors to represent different departments – blue for production, green for delivery – and add annotations for key events like supplier audits or shipping deadlines. The intuitive editing interface means no steep learning curve; even if you're not a design expert, you can resize elements, change fonts, and align everything to your brand's style guide in minutes. This level of customization ensures your presentations aren't just informative but also professionally polished, aligning with industry standards like those from the Project Management Institute (PMI), which emphasize clear visual aids for better stakeholder engagement.
Key Features That Drive Efficiency
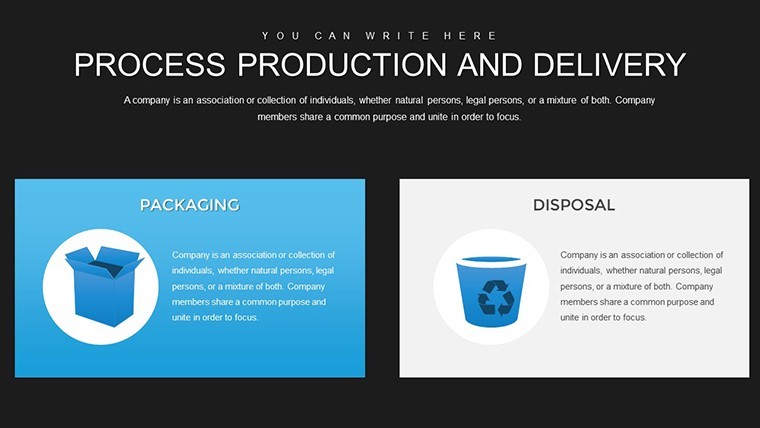
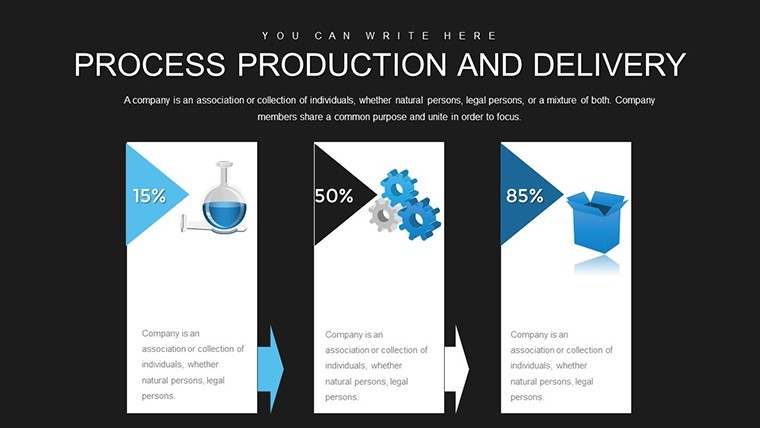
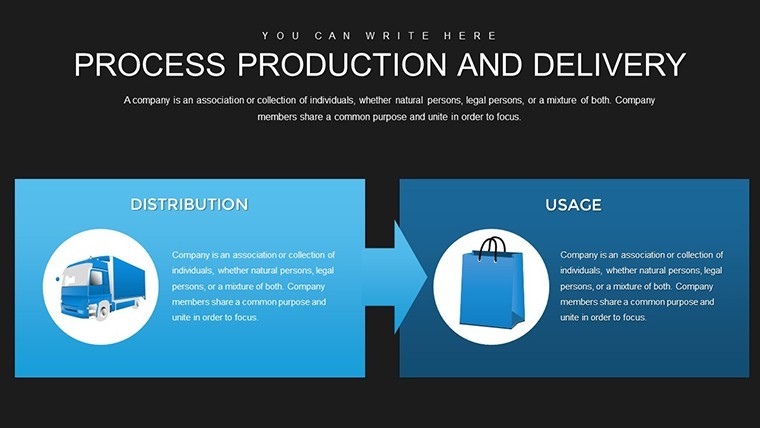
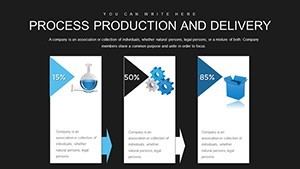
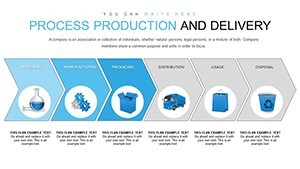
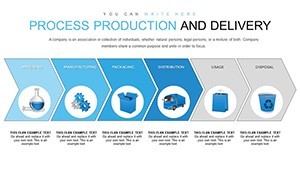
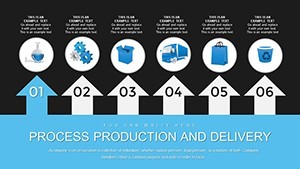
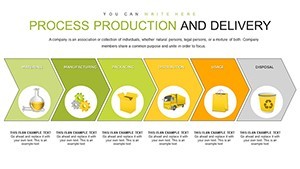
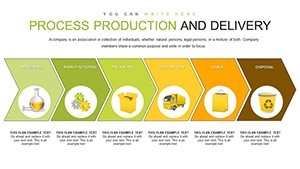
- Comprehensive Chart Library: Dive into a rich assortment of visuals including timelines for long-term planning, flowcharts for step-by-step processes, and Gantt charts for task management. Each is pre-designed with modern aesthetics but fully modifiable to fit your narrative.
- Seamless Data Integration: Import metrics directly from spreadsheets or databases, ensuring your charts reflect the latest figures. This feature is a game-changer for data-driven decisions, allowing real-time updates during live presentations.
- User-Friendly Customization: Adjust colors, shapes, and text effortlessly. Whether matching your company's palette or emphasizing critical paths with bold hues, the tools are intuitive and responsive.
- High-Resolution Graphics: All elements are vector-based, guaranteeing crisp visuals even when projected on large screens or printed for handouts.
These features aren't just add-ons; they're built to solve common pain points in presentation creation. Consider a logistics firm facing delays in international shipments – using the timeline charts, they could pinpoint customs clearance as a recurring issue, leading to process tweaks that improved on-time delivery rates, much like a FedEx optimization story where visual mapping reduced operational costs by 15%.
Real-World Applications and Use Cases
This template shines in diverse scenarios, adapting to the demands of various industries. For project managers in manufacturing, envision using the Gantt charts to orchestrate a new product launch. Break down phases from design prototyping to market rollout, assigning resources and tracking progress. In a case inspired by Toyota's lean manufacturing principles, such visualizations helped teams eliminate waste, fostering a culture of continuous improvement.
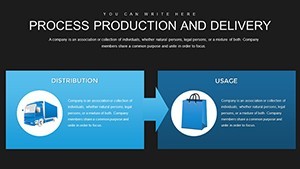
Supply chain professionals will appreciate the flowchart options for mapping vendor relationships and inventory flows. Picture diagramming a just-in-time delivery system, highlighting how raw materials arrive precisely when needed. A notable example comes from Amazon's warehouse operations, where process charts have been key to scaling their global network, ensuring packages reach customers swiftly and efficiently.
Sales and marketing teams can leverage these charts to present client proposals. Use timelines to outline campaign rollouts or delivery schedules, building trust through transparency. In educational settings, trainers might employ them to teach operations management, breaking down concepts like Six Sigma into digestible steps.
To get started, simply download the template, open it in Keynote, and begin populating with your data. For a seamless workflow, import your Excel sheets directly into the charts – watch as bars and lines auto-adjust to reflect your inputs. Add animations for emphasis, like fading in milestones during your talk, to keep audiences engaged. Pro tip: Always preview in slideshow mode to ensure smooth transitions, and consider exporting to PDF for easy sharing post-presentation.
Why Choose This Template for Your Next Presentation
In an era where data overload is common, standing out requires tools that cut through the noise. This Production and Delivery Process Keynote Charts Template does just that, offering not only versatility but also a professional edge that positions you as an expert. Backed by design principles that prioritize user experience, it aligns with best practices from authorities like the Institute for Supply Management (ISM), ensuring your visuals are both accurate and persuasive.
Don't settle for generic slides that fail to captivate. Elevate your presentations with charts that tell a story, drive decisions, and deliver results. Ready to transform how you communicate processes? Customize and conquer your next pitch today.
FAQ
- How editable are the charts in this template?
- All 39 slides are fully editable, allowing changes to colors, text, shapes, and data integration for complete customization.
- Is this template compatible with other software besides Keynote?
- It's primarily designed for Keynote (.key files), but you can export slides to PDF or images for use in other tools like PowerPoint.
- Can I import data from Excel?
- Yes, seamless data import from Excel or similar spreadsheets is supported, making it easy to populate charts with real metrics.
- What industries benefit most from this template?
- Ideal for manufacturing, logistics, project management, and supply chain sectors focused on process visualization.
- Are there animation options included?
- Keynote's built-in animations can be applied to elements, enhancing presentation flow without additional setup.