24 Free Thinking Charts - Editable Keynote | ImagineLayout


Type: Keynote Charts template
Category: Free Templates, Illustrations
Sources Available: .key
Product ID: KC00651
Template incl.: 24 editable slides
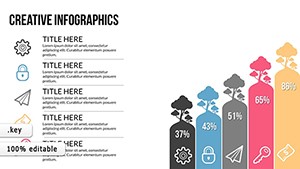
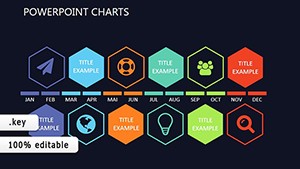
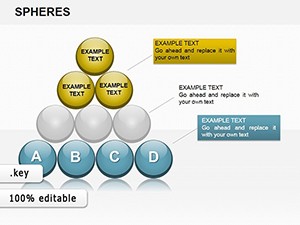
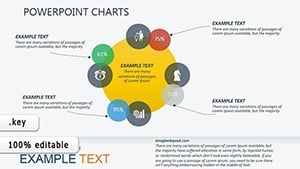
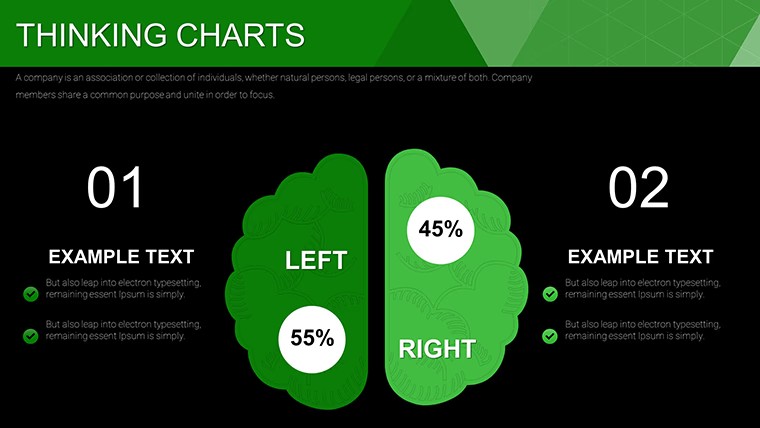
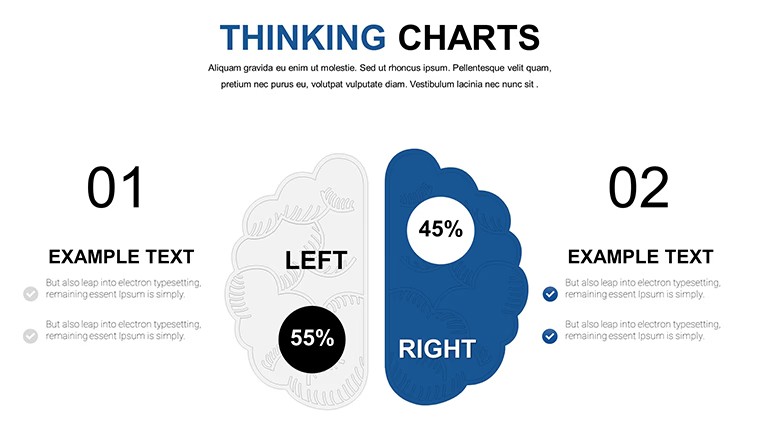
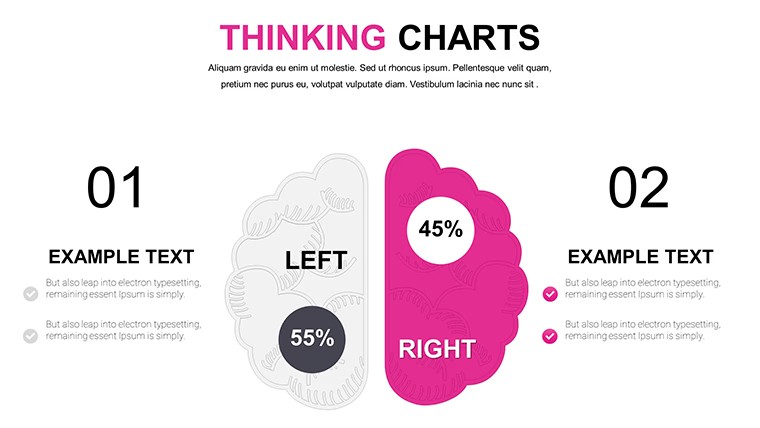
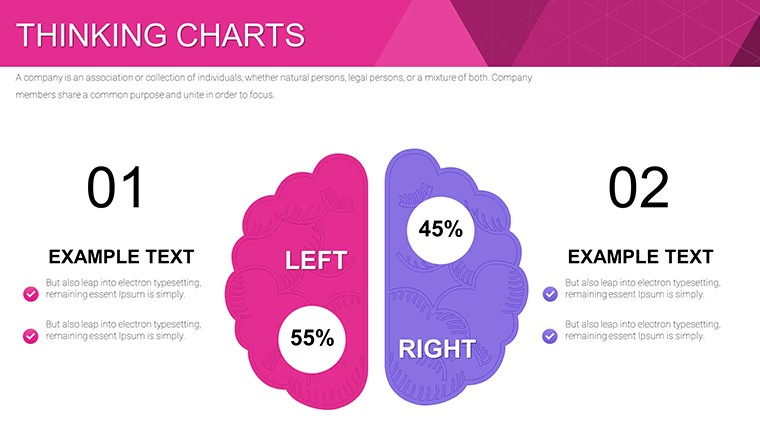
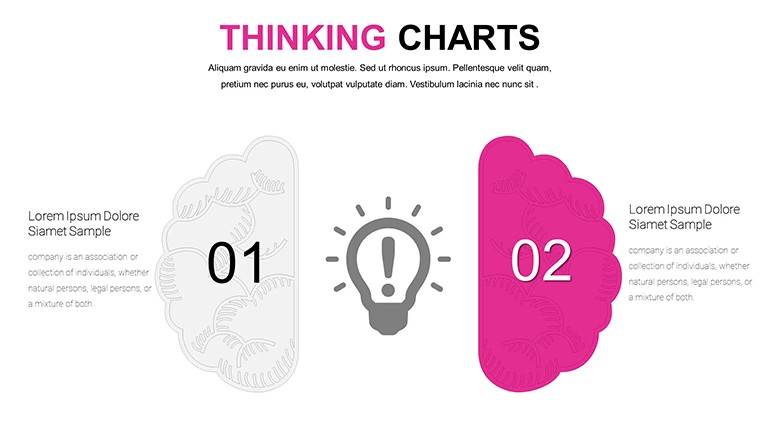
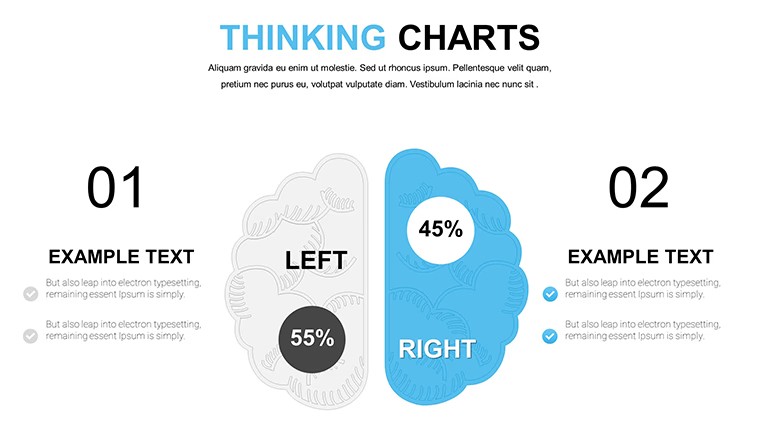
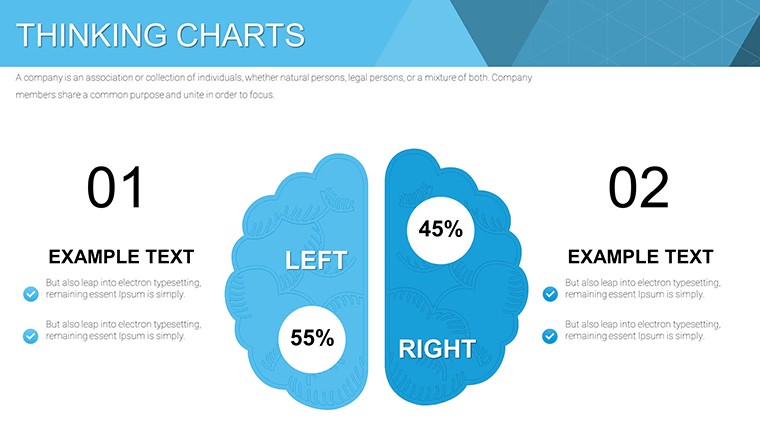
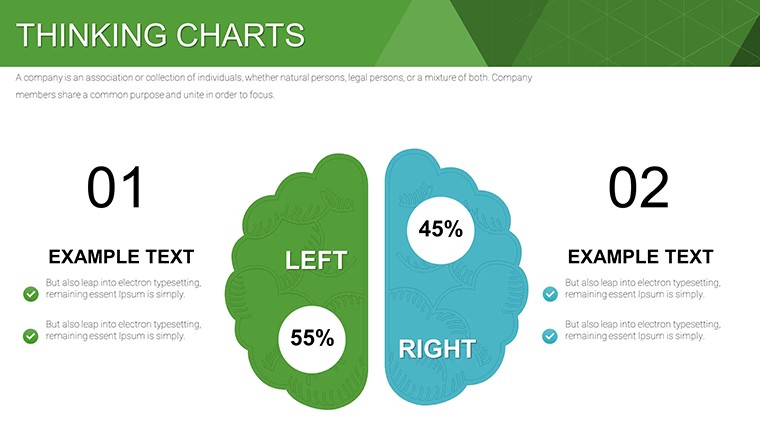
The KEY file delivers 24 editable charts with pie bar line and mind-map hybrids suited for brainstorming idea evolution in workshops.
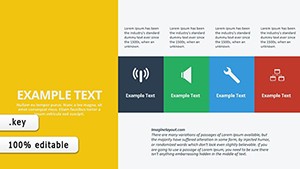
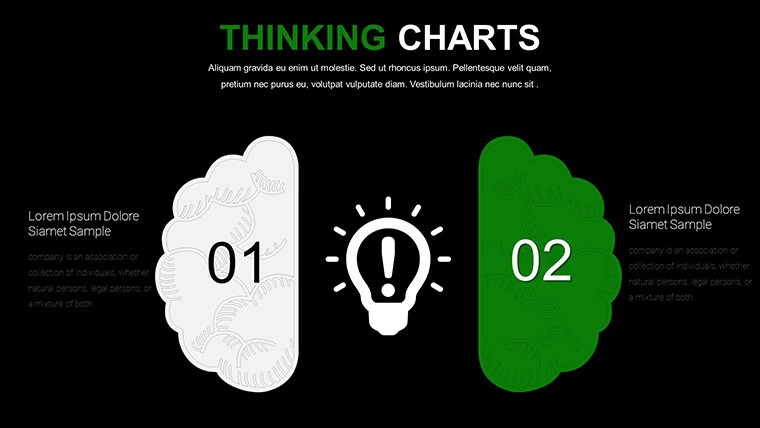
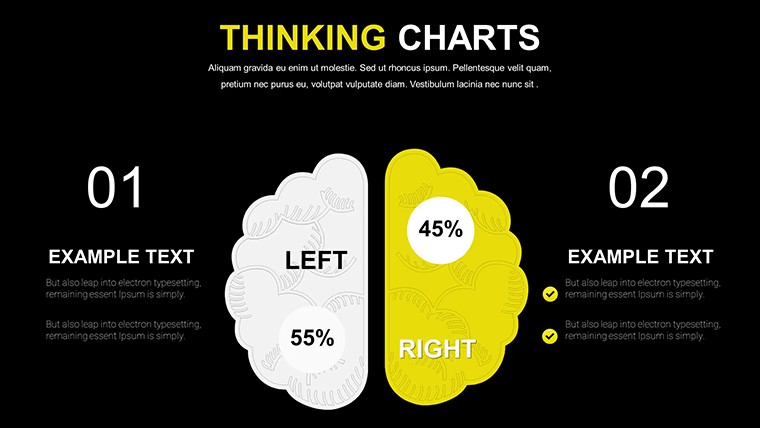
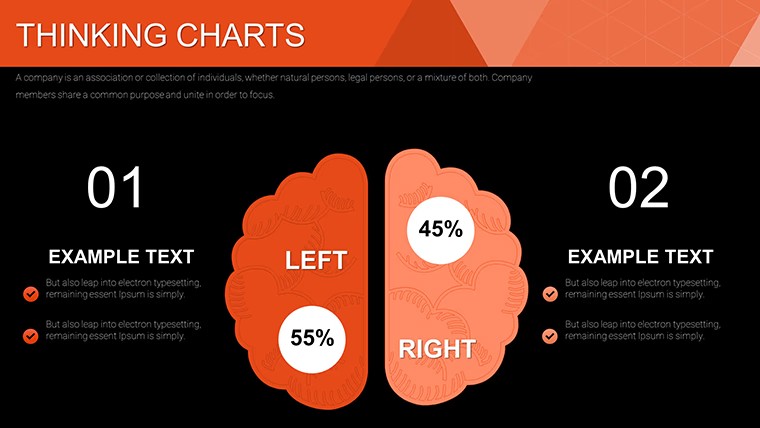
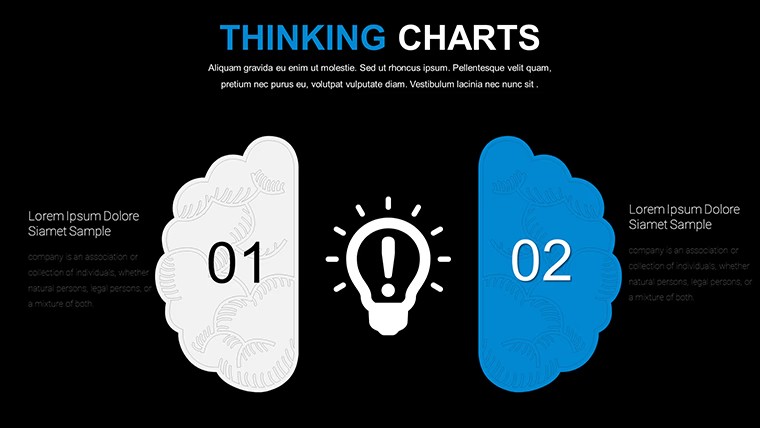
No gradients just clean structured blocks.
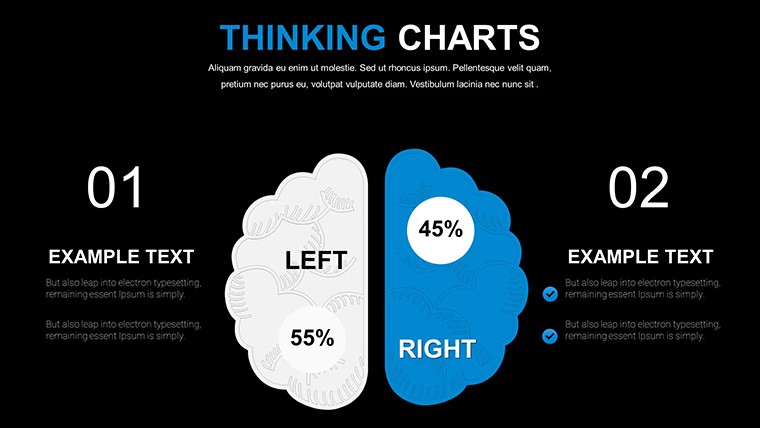
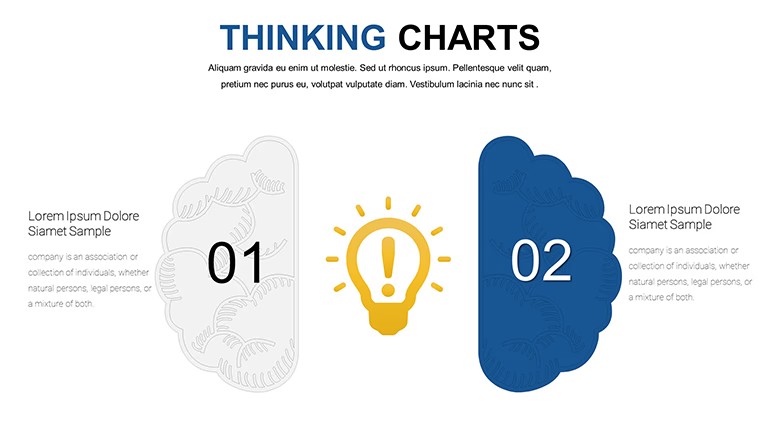
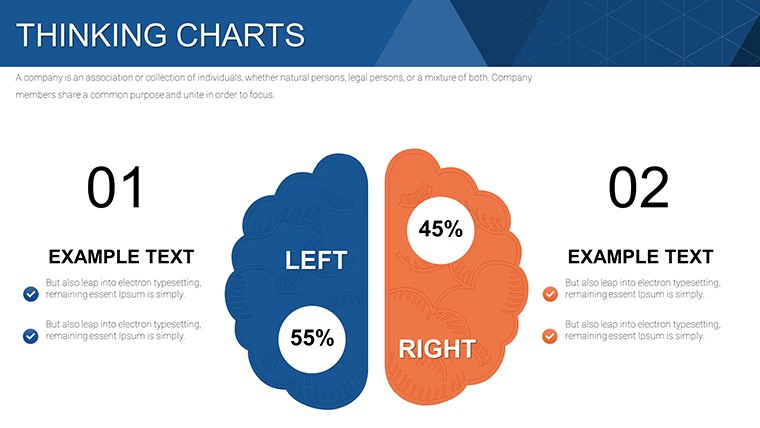
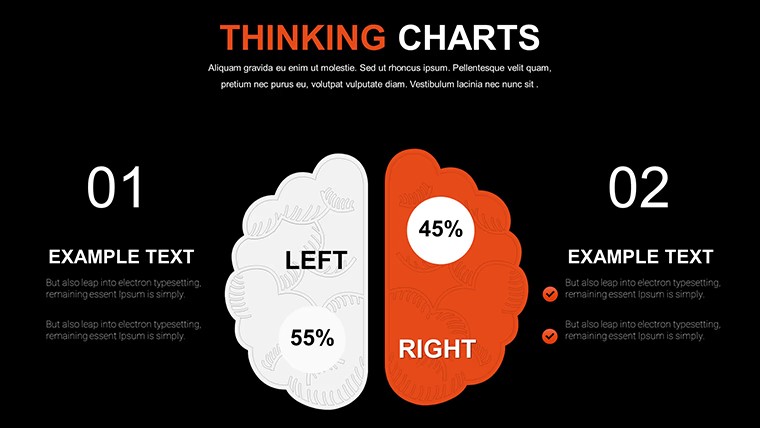
In practice the mix-and-match layouts let you branch free associations without rearranging elements manually.
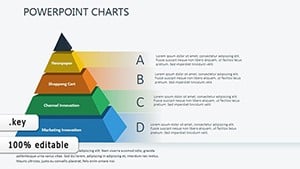
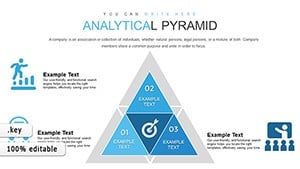
For innovation sessions the mind-map style chart organizes complex creative data on one slide.
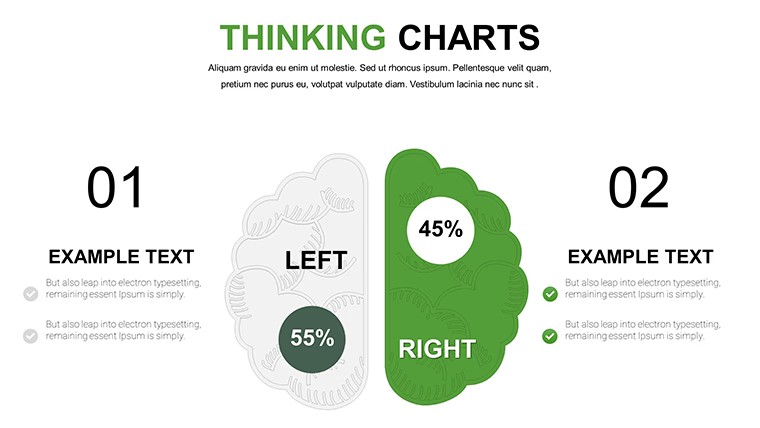
Typically this supports prioritization analysis of ideas so teams can decide which concepts to develop further.
Use this instead of building diagrams manually in Keynote.
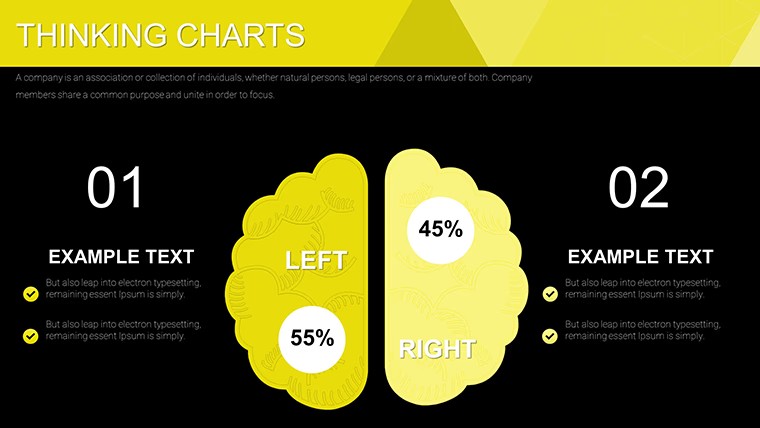
The hybrid views keep every branch readable preventing overcrowded layouts.
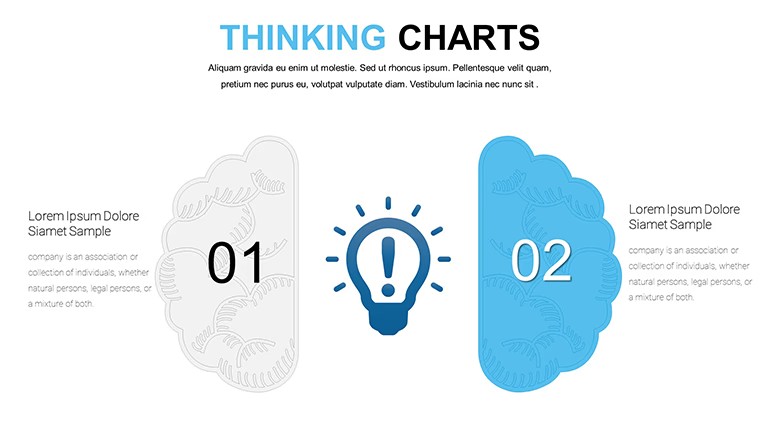
Strategists or workshop facilitators presenting creative processes will benefit most.
Not ideal for strict financial reporting.
Avoid it if you need purely hierarchical org charts rather than branching idea maps.
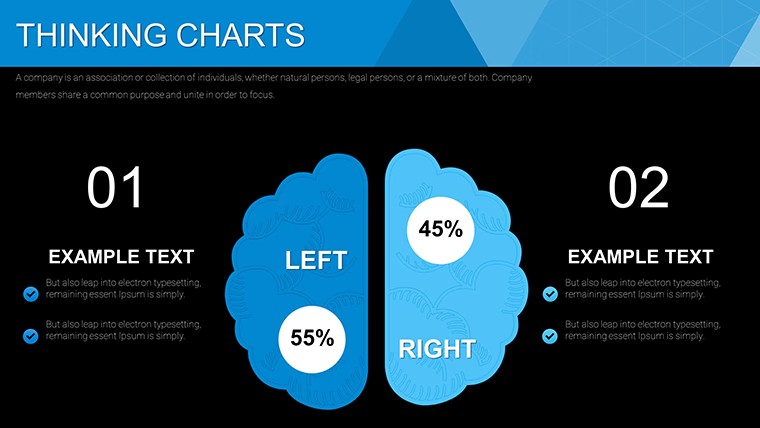
In most cases you only replace text and adjust colors via the slide master.
See more free keynote charts templates.
You open the file and start editing.
Download and start editing immediately
What Keynote version is required?
The template is fully compatible with recent Keynote versions on macOS.
Standard KEY files load without extra configuration.
All chart types and hybrids display as intended.
How to change colors via slide master?
Open the file in Keynote and enter master slide mode.
Modify colors on the pie bar or line elements then exit to apply the palette to all 24 slides.
This updates the entire free template in seconds.
Can I use this template for client work?
Yes you may use the free template for client presentations.
Customize and deliver decks freely.
Do not resell the original files as your own.
What are the free vs paid differences?
This is the full free version with 24 editable slides.
No paid upgrade is listed on the page.
All charts mind-maps and hybrids are included at no cost.
What are the refund conditions?
As a free digital download refunds do not apply.
Support is available for any technical questions.
Contact us if the file does not open correctly in your Keynote version.