Data Driven Charts Keynote Template - Instant Download | ImagineLayout


Type: Keynote Charts template
Category: Free Templates, Analysis
Sources Available: .key
Product ID: KC00637
Template incl.: 32 editable slides
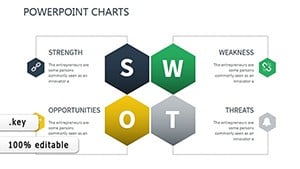
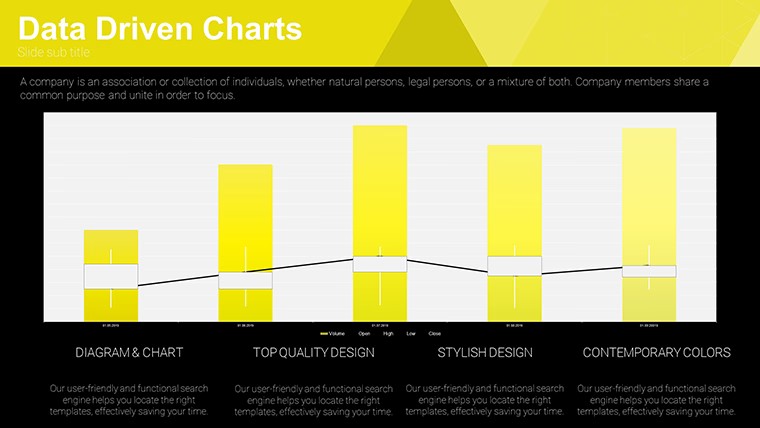
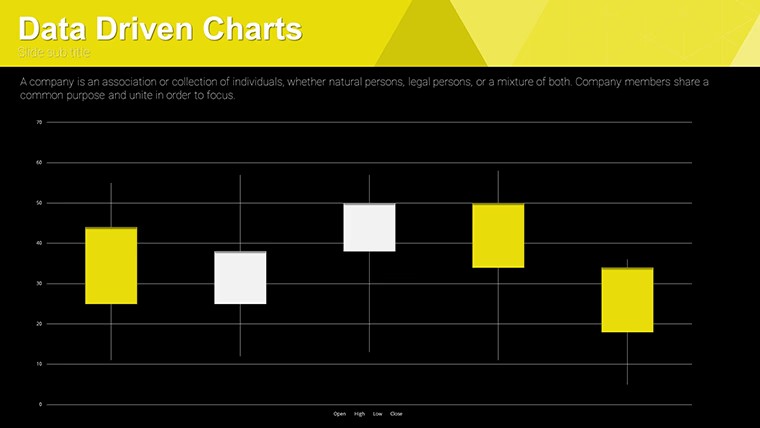
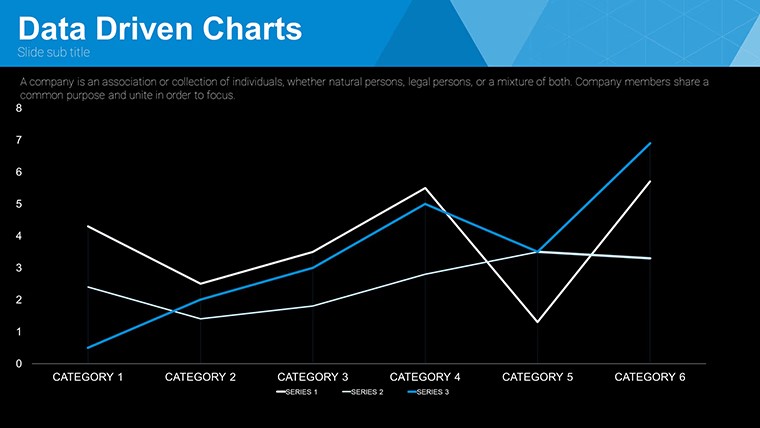
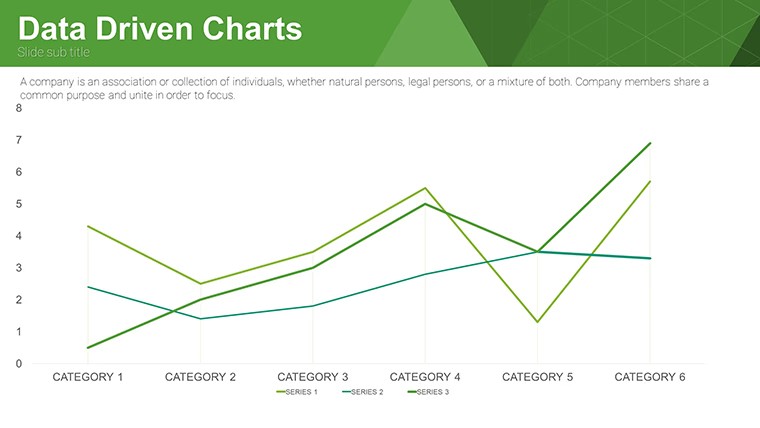
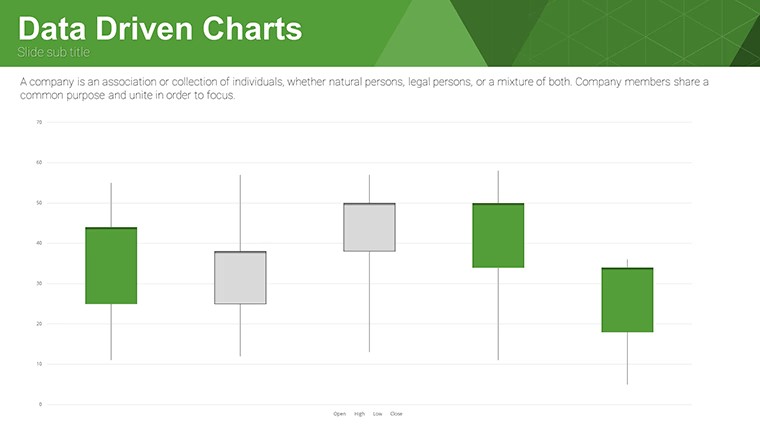
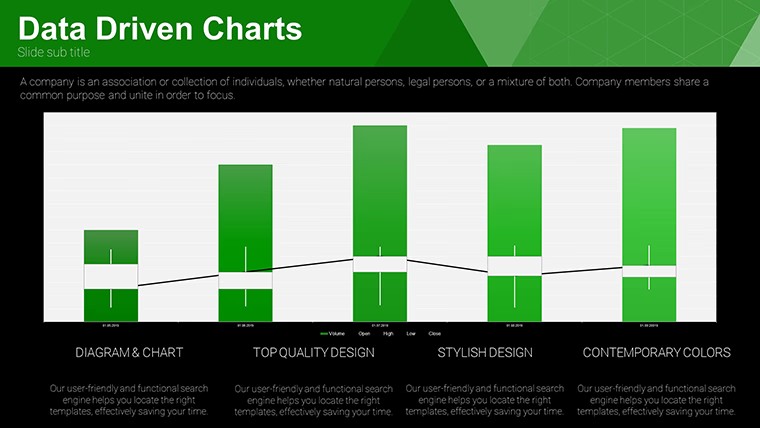
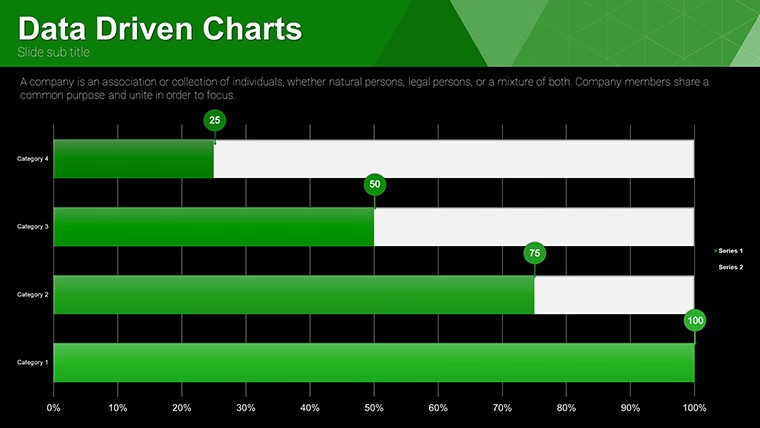
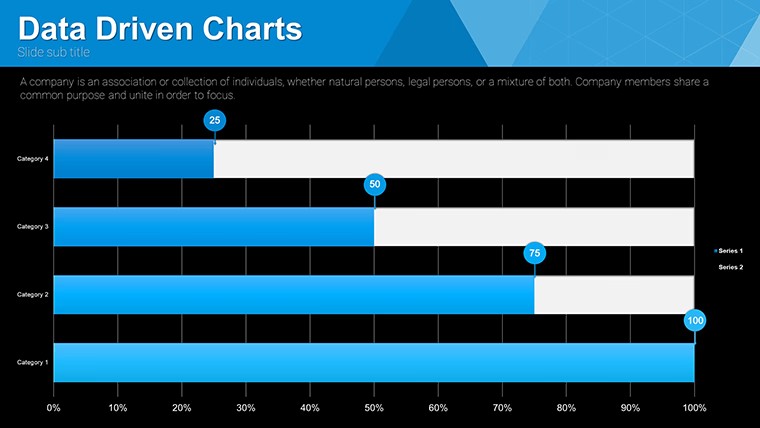
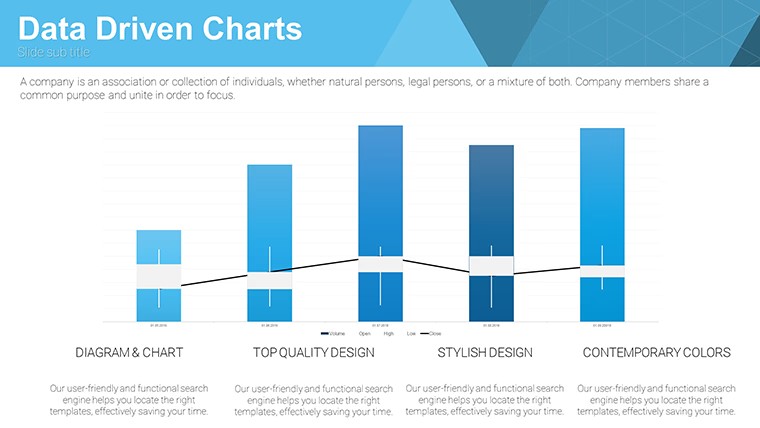
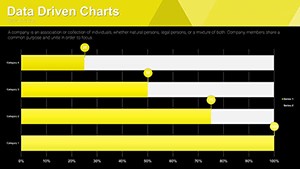
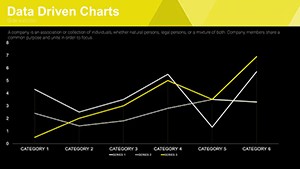
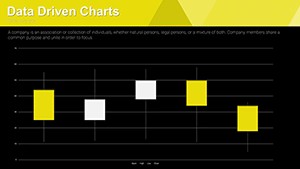
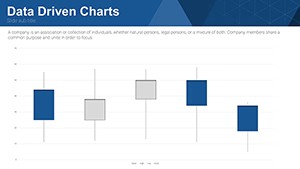
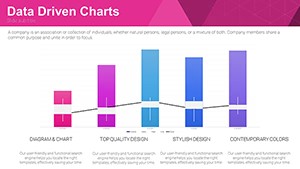
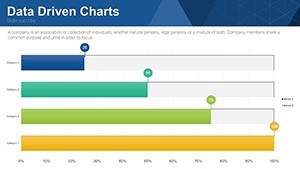
Free Data Driven Charts Keynote Template: Insightful Visuals Await
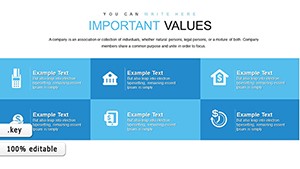
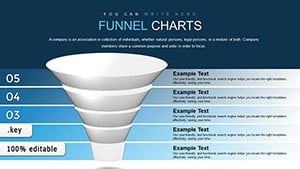
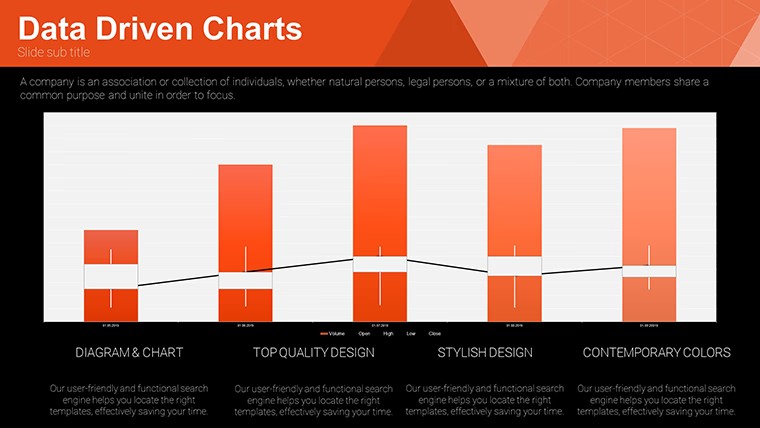
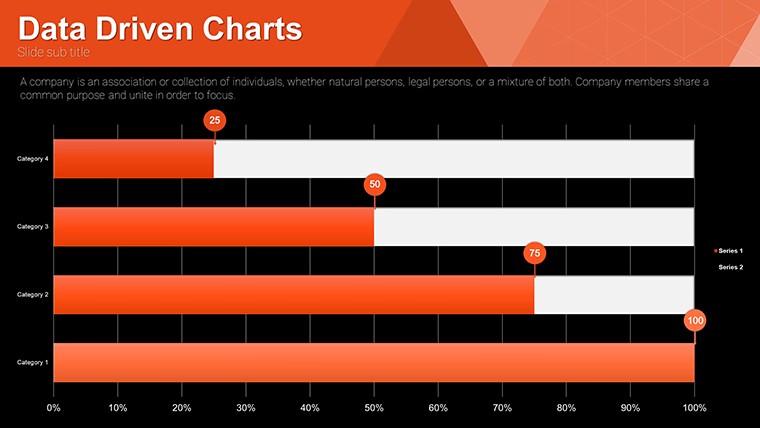
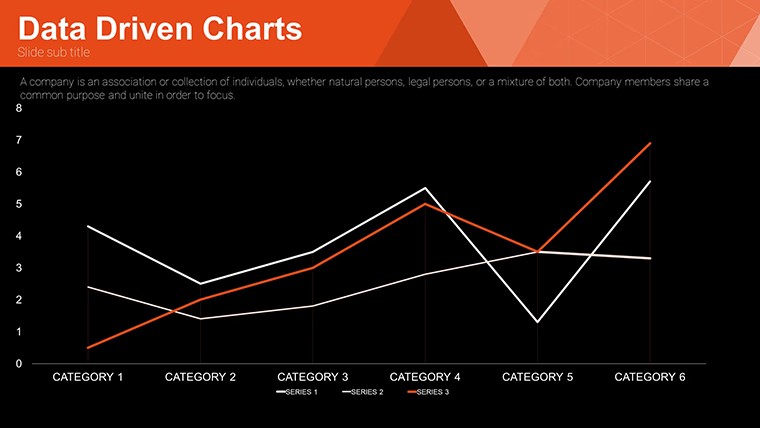
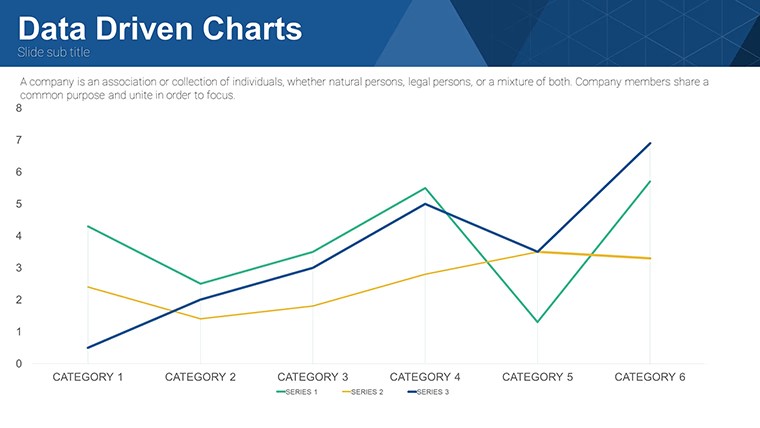
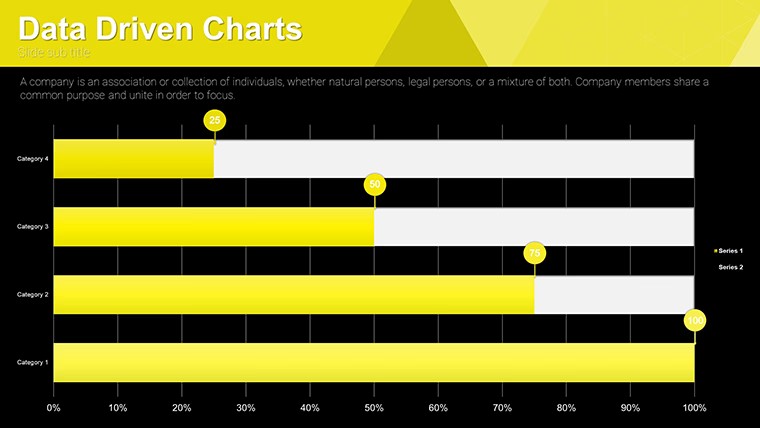
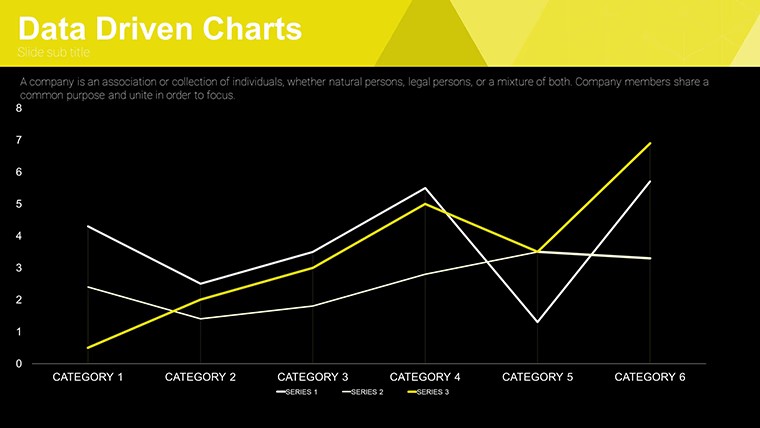
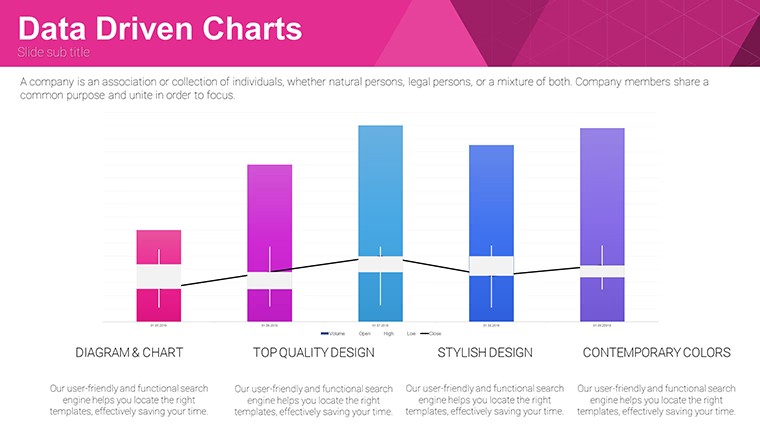
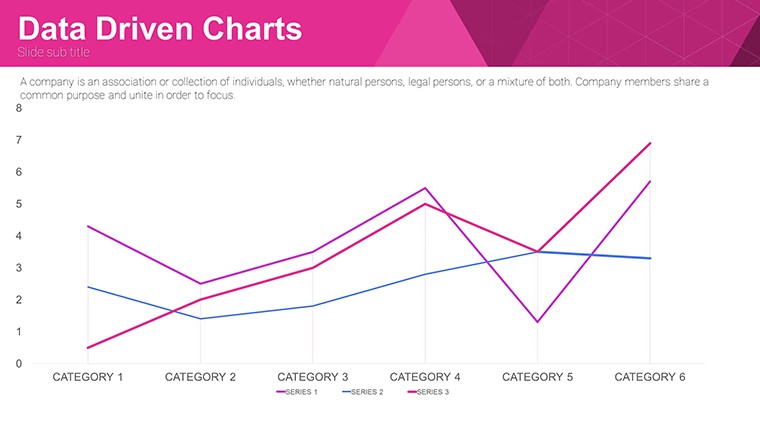
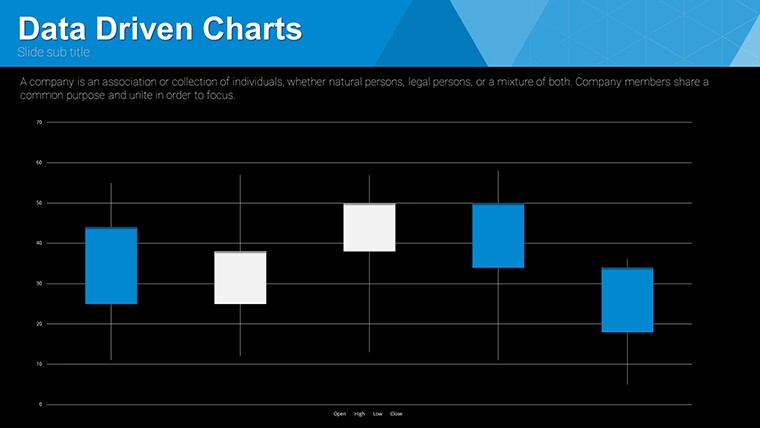
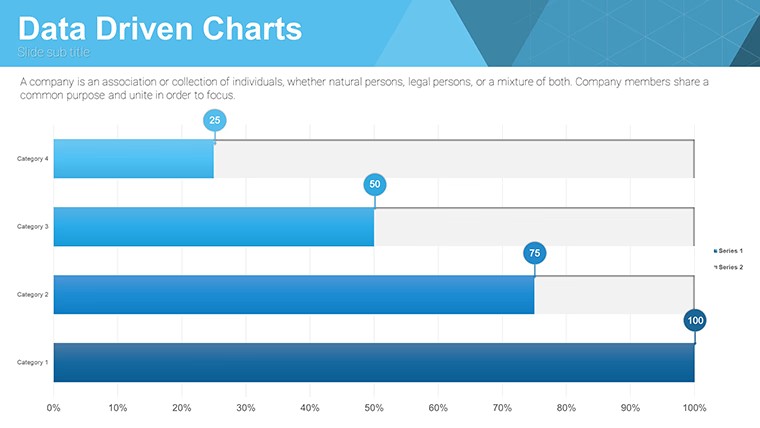
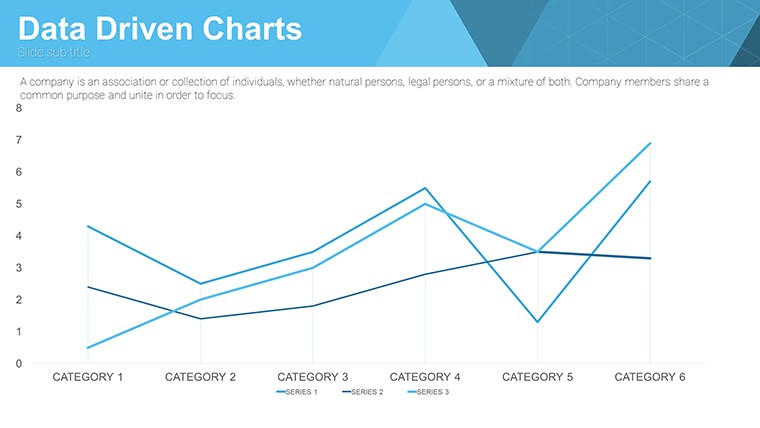
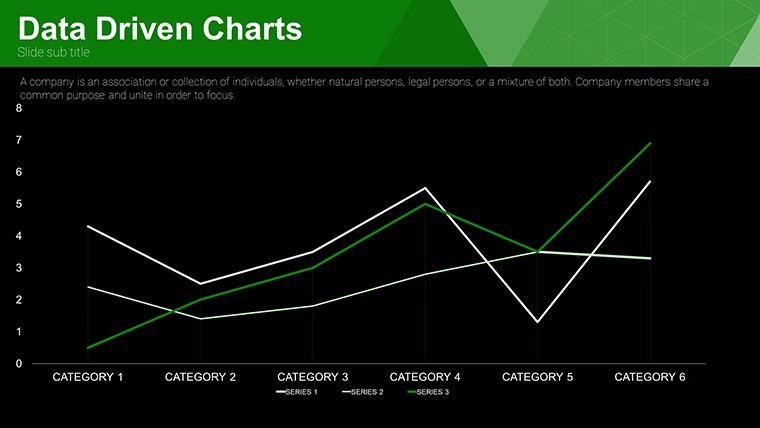
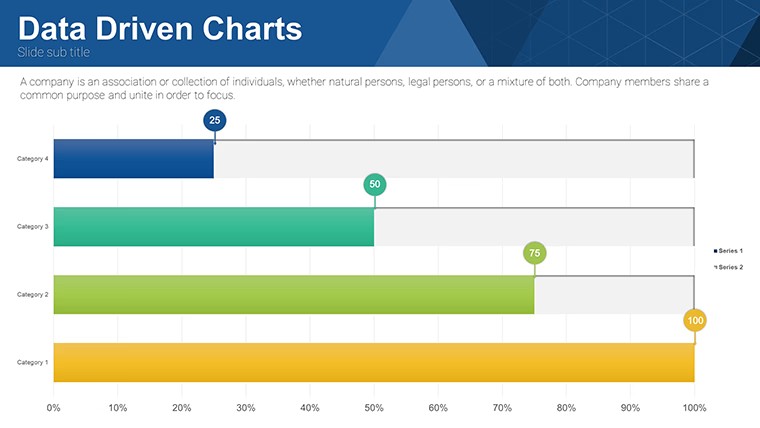
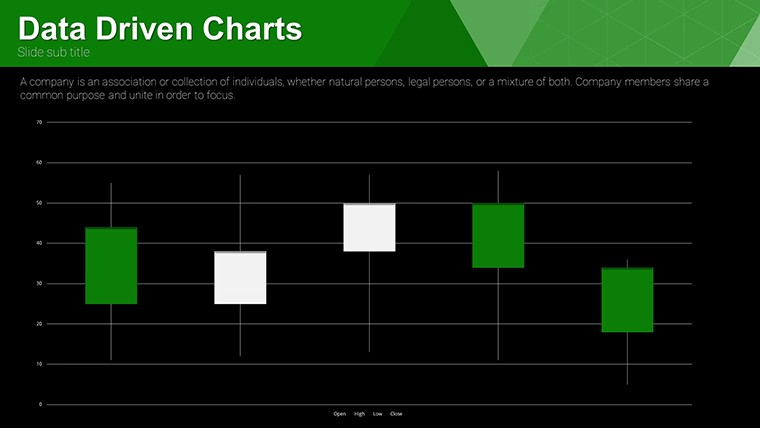
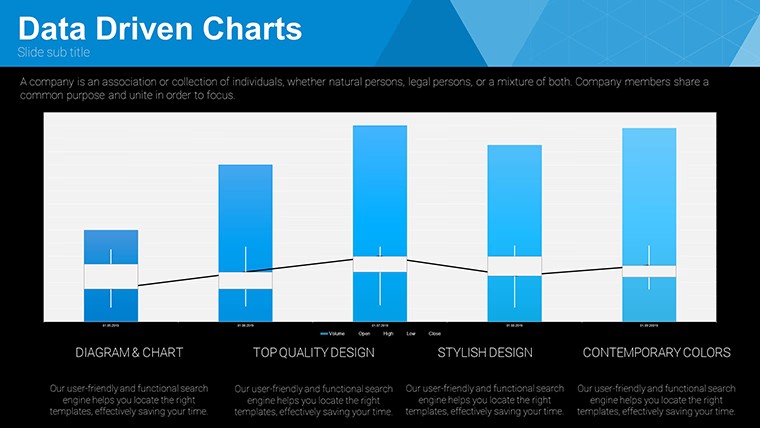
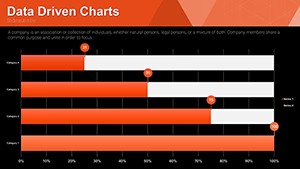
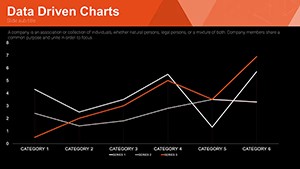
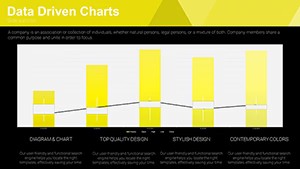
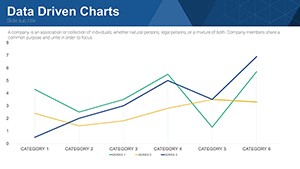
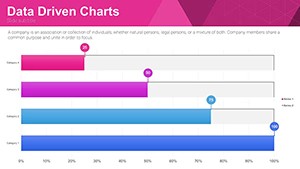
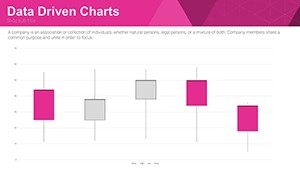
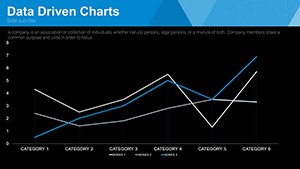
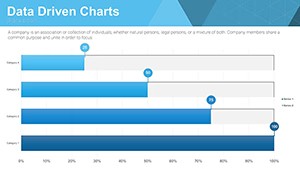
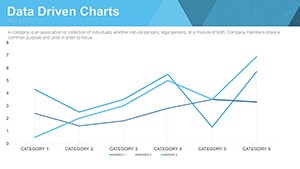
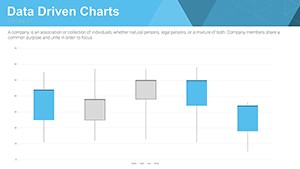
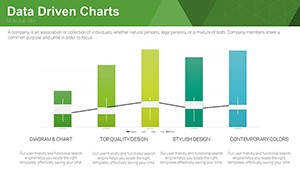
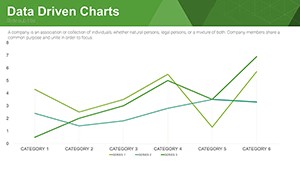
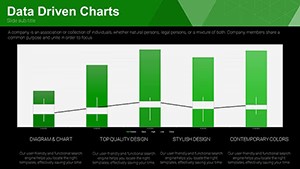
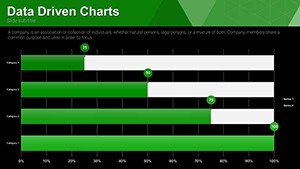
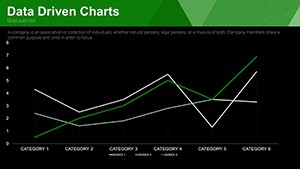
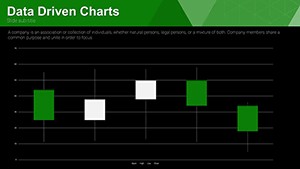
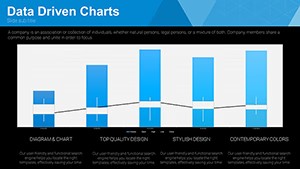
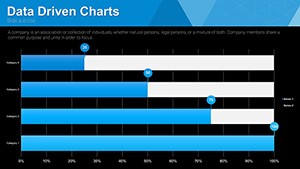
32 editable slides packed with bar column pie and line charts transform raw figures into trend stories for analysts and executives.
You replace numbers and the layouts hold alignment automatically in most cases.
No complex layouts just structured blocks.
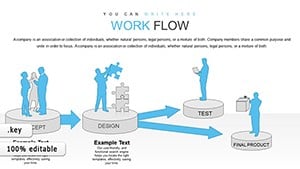
This Keynote chart template works across internal reports when you track revenue growth or survey results. The structures replace manual chart building so you finish faster than starting from scratch.
The page does not list exact preview details or paid options but the files follow standard KEY formats compatible with current installations.
Use this instead of building diagrams manually in Keynote. Predefined chart types keep structure readable on one slide and prevent spacing adjustments slide by slide.
It is not ideal for purely textual strategy overviews without numerical data.
Marketers rely on it for trend presentations because the bar and pie elements update via the slide master in seconds.
| Feature | Details |
|---|---|
| Slides / diagrams | 32 editable bar column pie and line charts |
| File format | KEY |
| Software version | Keynote 12+ on macOS and iOS |
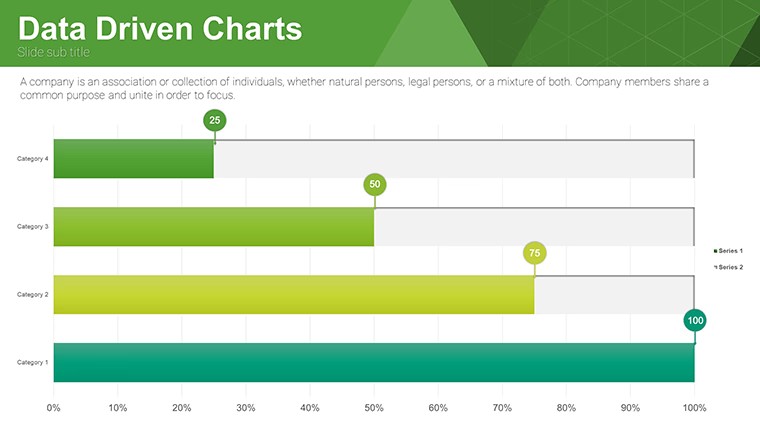
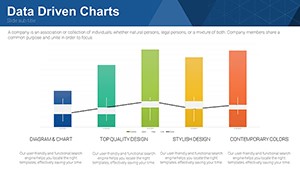
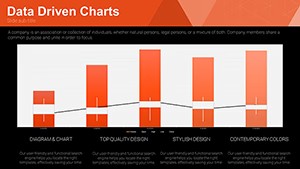
| Color schemes | Update via slide master for instant deck-wide changes |
| Editable elements | Text icons and data series resize and recolor independently |
| Aspect ratio | 16:9 widescreen |
| Free vs Paid | Full set of 32 slides included at no cost no paid version listed |
| Masters / Backgrounds | Master slides enable global palette switches |
Everything is already structured.
Download and start editing immediately
How do I change colors across all slides?
Go to slide master view adjust the color palette once then return to normal view. All 32 charts adopt the update without individual edits. This approach keeps decks consistent for weekly data reviews.
Can I use this template for client work?
Yes the license permits client work under standard terms. Deliver finished presentations created with the template as part of your services. You cannot resell or redistribute the original KEY files themselves.
What is the difference between free and paid versions?
This template is offered completely free with all 32 slides included. No paid version appears on the page so the download gives you the full set immediately. Everything required for editing is already inside the file.
What are the refund conditions?
As a free template no refund process applies. Download and open the file in Keynote to verify compatibility first. Reach out to support only if the KEY file fails to load on supported software.
Is the template compatible with PowerPoint?
The native format is Keynote yet you can export directly to PowerPoint 2016 or newer. Results stay clean when exported from Keynote. Test the output file on your target device for best alignment.