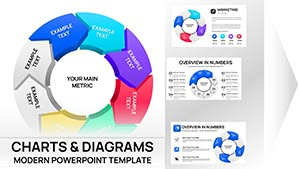
Harness the full spectrum of data visualization with volume chart templates for Microsoft PowerPoint. These robust designs tackle everything from sales metrics to production volumes, delivering clarity in high-stakes presentations.
Crafted for business analysts, educators, and project managers, they feature intuitive edits and pro-level polish. Advantages: Built-in animations for phased reveals and flexible axes for varied scales. Incorporate bar, line, and area styles with volume-specific labels for precise storytelling.
Seamless integration with Excel data makes updates a breeze. Suited for reports or pitches, these charts elevate your narrative. Scan the selection and integrate one into your workflow for sharper insights.

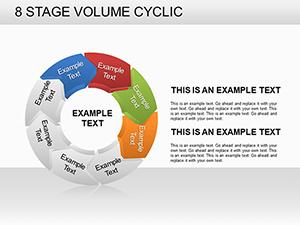
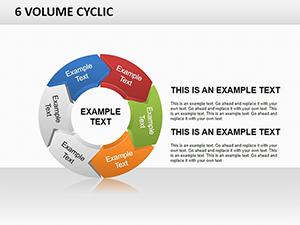
Volume charts in PowerPoint thrive in sales reviews, where reps graph quarterly shipments via clustered columns. Project leads track resource allocations with stacked areas, highlighting bottlenecks. In academia, professors illustrate population volumes in histograms for demographic studies.
Marketers dissect traffic volumes in funnel diagrams, optimizing funnels. Operations teams monitor inventory turns with line trends, forecasting needs. Non-profits use them for donation volume maps, inspiring support.
PowerPoint defaults offer basics, but our templates add volume-optimized grids and tooltips for deeper dives. They reduce clutter with auto-hiding legends, unlike static natives. Advanced morph transitions simulate volume shifts smoothly.
Excel synergy allows pivot refreshes, far beyond manual inputs. Themed colors align with corporate palettes, ensuring brand harmony. Accessibility via alt descriptions and color-blind modes broadens usability.
Teams report faster prep times and stronger audience reactions to the polished outputs.
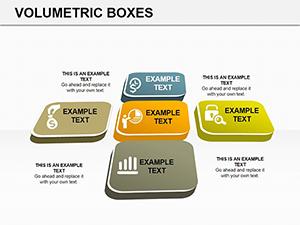
Distinguishing elements include drill-down interactivity, clicking segments for sub-data. Benefits: Scalable vectors for large venues and exportable SVGs for reports. Strategies: Employ 3D rotations sparingly for emphasis, and layer transparency for overlays.
Prioritize linear scales for straightforward volumes, reserving logs for exponentials. Test in slideshow mode for flow checks.
An analyst`s pitch featured waterfall charts decomposing revenue volumes, clinching deals. Educators animated growth curves for economic volumes, simplifying concepts. Marketers used radar charts for multi-metric volumes, revealing opportunities.
Ops dashboards stacked volumes by category, streamlining audits. Variations like combo charts merge lines and bars for hybrid views. One standout: Heatmap overlays for spatial volume distributions.
Creative hack: Embed hyperlinks to detailed spreadsheets within chart elements for on-the-fly access.
Right-click the chart, select Edit Data, and refresh from linked sources.
Use Animation Pane to sequence grows or fades tailored to data flow.
Yes, with variant themes for inverted color schemes.
Save as PDF or PNG for high-res sharing without edits.
Chart your path to clearer insights - grab a volume template for PowerPoint and transform your data stories now.
Copyright © 2009-2026 ImagineLayout All rights reserved.